
Quick Navigation
- Introduction
- Editor’s Choice
- General Email Marketing Statistics and Facts
- Email Marketing Usage Statistics
- Mobile Email Marketing Statistics
- AI Email Marketing Statistics
- B2B Email Marketing Statistics
- B2C Email Marketing Statistics
- Personalised Email Marketing Statistics
- Email Segmentation Statistics
- Statistics of Email Automation
- Email Subject Line Statistics
- Benefits of Email Marketing
- Email Marketing Demographics
- Email Marketing Conversion Rates
- Day-wise Email Marketing Statistics
- Email Marketing Fun Facts
- Recent Developments
- Email Marketing Future Predictions
- Conclusion
Introduction
Email Marketing Statistics: Email marketing constitutes a digital marketing approach that leverages email to foster relationships, promote products or services, and stimulate sales with both potential and existing customers. It entails dispatching targeted communications, such as newsletters or promotional offers, to a subscriber list that has consented to receive such messages.
The primary objective is to engage the audience, cultivate brand loyalty, and drive conversions through persuasive content and effective calls-to-action. Email marketing is recognized as a highly efficient and extensively utilized channel, bolstered by robust statistics concerning user engagement, return on investment (ROI), and its significance in both B2B and B2C strategies. Key statistics indicate a high frequency of daily email usage, a notable ROI (with a common figure being $36 for every $1 invested), and a consumer and marketer preference for email over alternative channels, although personalization remains essential for achieving success.
Editor’s Choice
- Currently, there are approximately 4.48 billion email users globally.
- It is noteworthy that 48.63% of all emails are classified as spam.
- The global number of email users is projected to reach 4.84 billion by the year 2027.
- 35% of email marketers emphasize a mobile-first strategy in their email design.
- 63% of marketers utilize generative AI tools for email marketing.
- 79% of B2B companies and agencies consider email to be the most effective digital marketing channel for distributing content.
- 75% of survey participants dislike encountering content that is not pertinent to them.
- Email marketing yields an average return on investment of $36 for every dollar spent.
General Email Marketing Statistics and Facts
- Currently, there are approximately 4.48 billion email users globally.
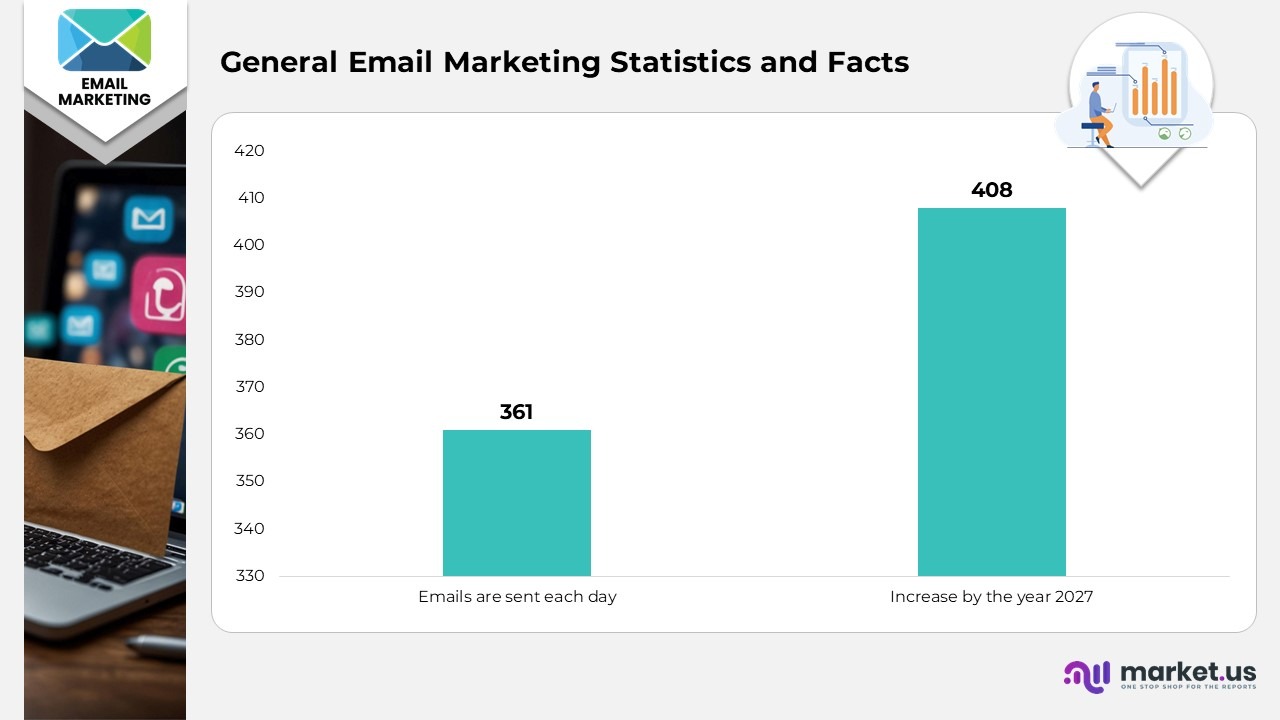
- Around 361 billion emails are sent each day, with projections indicating an increase to 408 billion by the year 2027.
- A significant 81% of businesses incorporate email into their marketing strategies.
- Additionally, 64% of small enterprises utilize email marketing.
- The average open rate for email campaigns stands at 36.5%.
- Faith-based organizations boast the highest open rate at 45.50%, followed closely by child care services and family and social services.
- Furthermore, 37% of brands are already planning to increase their email marketing budgets.
- Most marketers send out 2-3 marketing emails daily.
- According to 27% of survey participants, Tuesday is considered the optimal day for sending marketing emails.
- It is noteworthy that 48.63% of all emails are classified as spam.
- In terms of return on investment, email marketing yields an impressive $41 and $43 for every dollar spent by brands in the US and EU, respectively.
- Moreover, email marketing is 40 times more effective for customer acquisition than Facebook and X combined.
- In the US, marketers allocate 12% of their budgets to email marketing.
- A survey conducted by Zero Bounce revealed that 39% of respondents check their inboxes three to five times daily.
- Additionally, 44% of respondents cited receiving too many emails as the primary reason for unsubscribing from mailing lists.
- Notably, 61% of individuals check their email on their mobile devices, while 25% of respondents indicated that they never check the Promotions tab.
- Lastly, 56% of respondents possess at least three email addresses.
Email Marketing Usage Statistics
- The global number of email users is projected to reach 4.84 billion by the year 2027.
- Approximately 361.6 billion emails were dispatched daily in 2024.
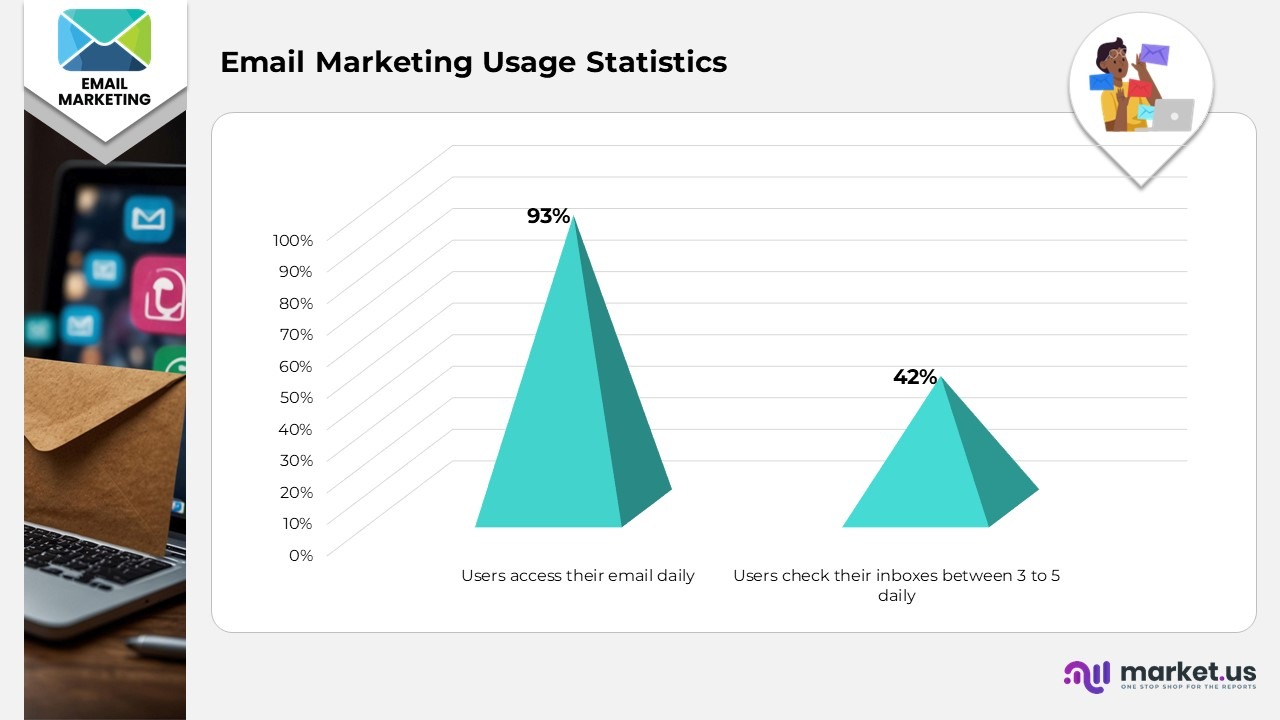
- A significant 93% of users access their email on a daily basis. Among these email users, 42% of consumers check their inboxes between three to five times each day.
- Furthermore, 86% of customers express a desire to be contacted by the businesses they interact with, with 60% indicating a preference for email as their primary communication method.
- In terms of marketing strategies, 22% of marketers send marketing emails two to three times daily, while 12% opt for weekly email communications.
- For 64% of small enterprises, email serves as an effective tool for maintaining competitiveness against larger corporations, even when operating on a limited budget.
Mobile Email Marketing Statistics
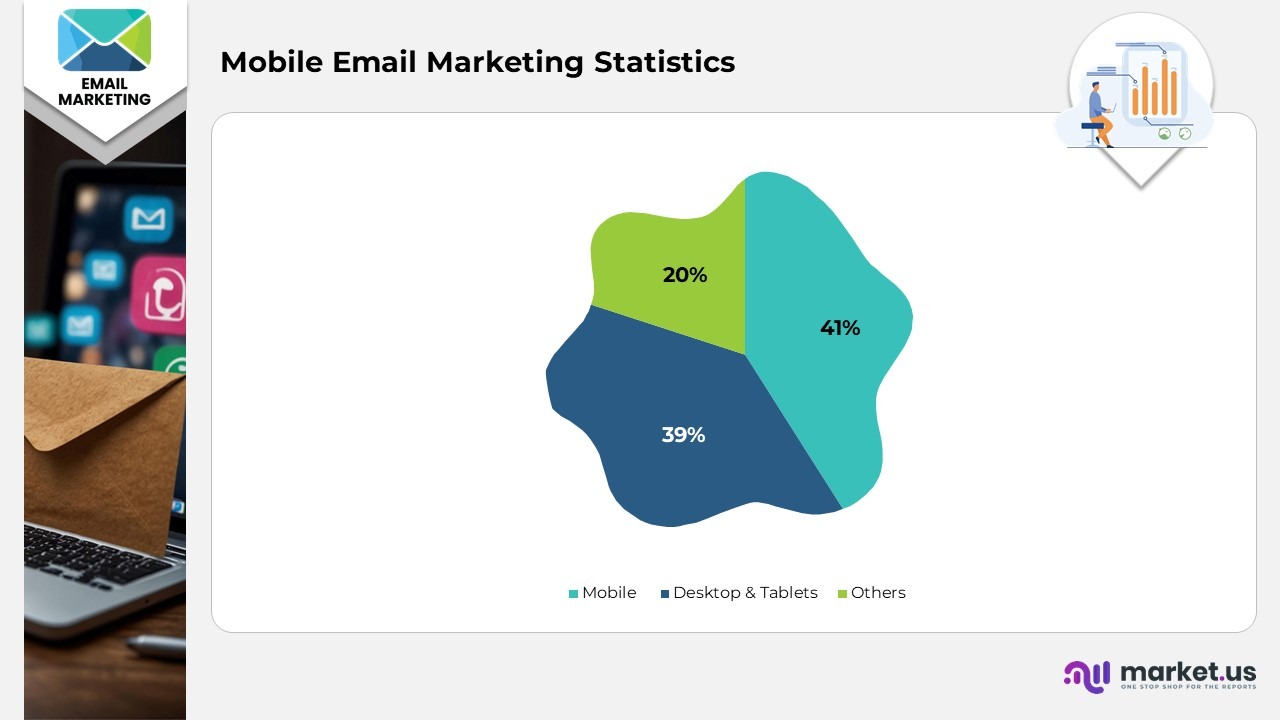
- Mobile devices account for 41% of email openings, with desktop following at 39%, and tablets, along with other devices, making up 20%.
- 33% of emails are accessed via iPhone.
- A majority of email marketers, over half, tailor their email campaigns for mobile viewing.
- 35% of email marketers emphasize a mobile-first strategy in their email design.
- 59% of millennials favor checking their emails on their mobile phones.
- 46% of smartphone users are open to receiving marketing communications from brands through email.
- Brands have observed a 15% rise in mobile clicks when they optimize email designs for mobile viewing.
- Following iPhone’s email application, Gmail holds the second-largest market share.
- Gmail has surpassed 10 billion downloads on Google Play.
- More than 20% of consumers who access their emails on mobile devices are likely to do so again.
- 81% of consumers prefer to open emails on their smartphones, whereas only 21% opt for tablets.
- 50% of consumers would choose to delete an email if it is not optimized for mobile viewing.
AI Email Marketing Statistics
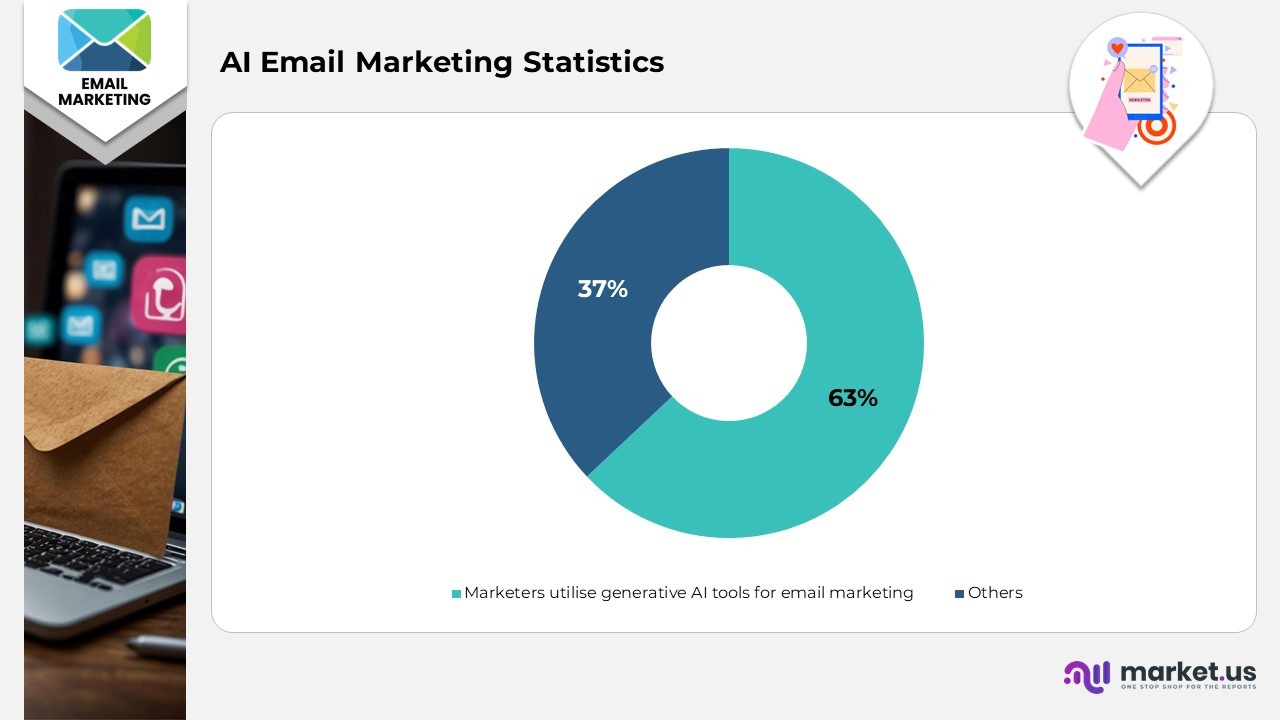
- 63% of marketers utilize generative AI tools for email marketing.
- 38% of marketers primarily employ generative AI to compose emails.
- 3% of marketers are convinced that the application of AI can enhance their email newsletters.
- 41% of marketers assert that AI-driven email marketing enables them to generate greater revenue.
- At present, 10% of email marketing teams are utilizing AI for crafting email content.
- The implementation of generative AI tools has resulted in a 13.44% increase in the click-through rate.
- 39% of marketers are of the opinion that AI-enabled hyper-personalisation will exert the most significant influence on email marketing.
- For 18% of marketers, blockchain technology is anticipated to have the least effect on AI email marketing in the future.
- 57% of marketing organizations with more than 500 employees are already incorporating AI into their email campaigns.
- For 95% of marketers, the use of generative AI for email creation is deemed “effective,” while 54% consider it “very effective.”
- AI-driven email marketing results in a 41% boost in revenue.
- 87% of marketers are leveraging AI to enhance their email marketing efforts.
- 51% of generative AI users within the email sector utilize ChatGPT.
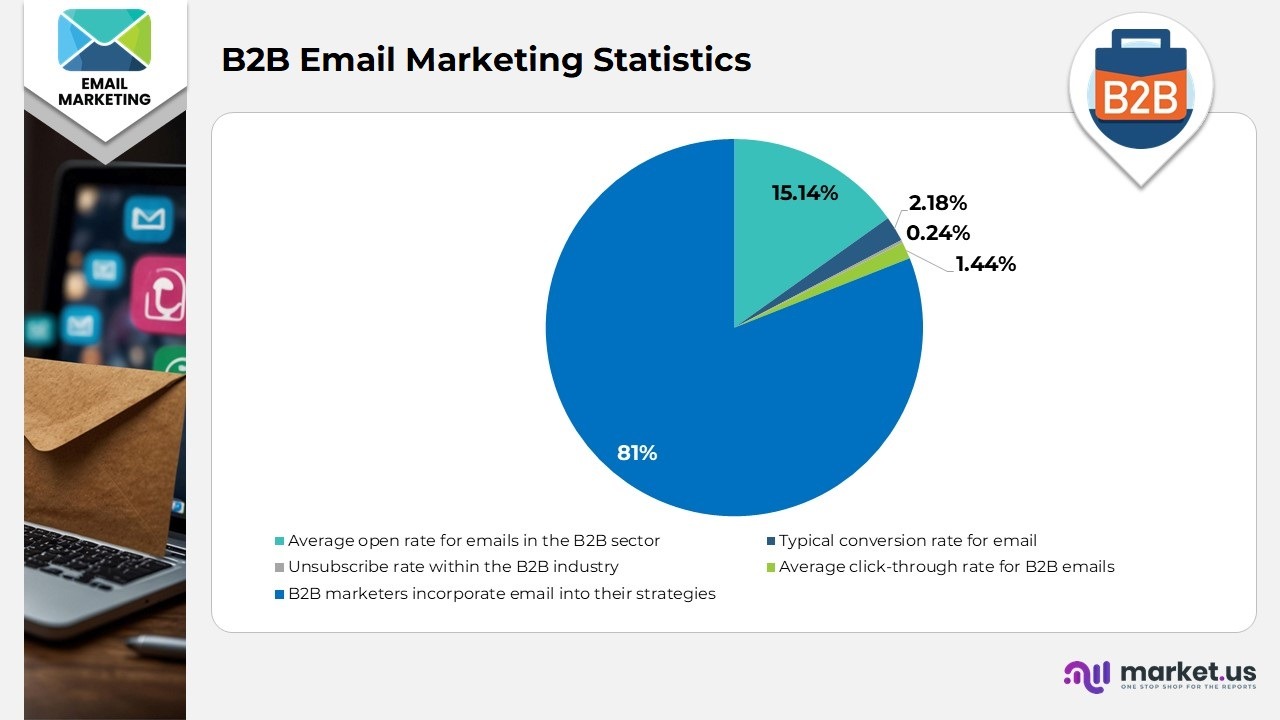
B2B Email Marketing Statistics
- The average open rate for emails in the B2B sector stands at 15.14%.
- The typical conversion rate for email in B2B is 2.18%.
- The unsubscribe rate within the B2B industry is roughly 0.24%.
- The average click-through rate for B2B emails is 1.44%.
- A notable 73% of B2B marketers view email as the most effective digital marketing channel for engaging potential clients.
- At present, 81% of B2B marketers incorporate email into their strategies.
- 77% of B2B consumers prefer email as their chosen communication method.
- In light of the high volume of emails received, 67% of B2B consumers have created a separate junk email account.
- Email is ranked as the third most frequently used media platform by B2B marketers.
- 79% of B2B companies and agencies consider email to be the most effective digital marketing channel for distributing content.
- 40% of B2B marketers recognise email newsletters as the most crucial element of their overall content marketing success.
- Over the past year, 55% of B2B marketers have raised their budget for email marketing.
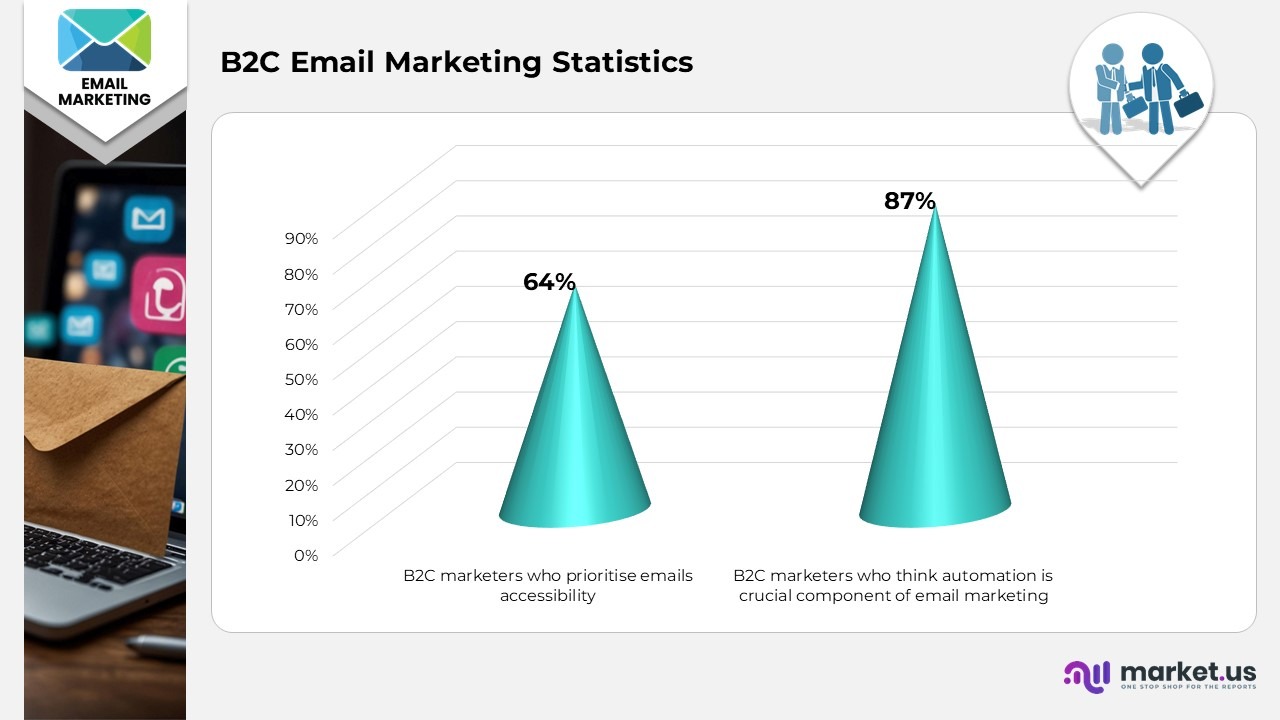
B2C Email Marketing Statistics
- Half of consumers make purchases directly as a result of marketing emails at least once each month.
- More than 80% of consumers tend to open a welcome email, resulting in double the number of opens and quadruple the number of clicks compared to other email types.
- For 87% of B2C marketers, automation is a crucial component of email marketing.
- According to a survey, 60% of participants indicated that marketing emails have influenced their purchasing decisions.
- When crafting emails, 64% of B2C marketers prioritize accessibility.
- The average open rate for abandoned cart emails stands at 50.5%, which is 15% higher than that of other marketing emails.
- Individuals are three times more inclined to make purchases through marketing emails rather than social media.
- Automated or triggered emails yield 30 times more revenue per recipient.
- 80% of retail companies consider email marketing to be their most effective strategy for customer retention.
- 51% of consumers in the United States favor email over other marketing channels for receiving discounts.
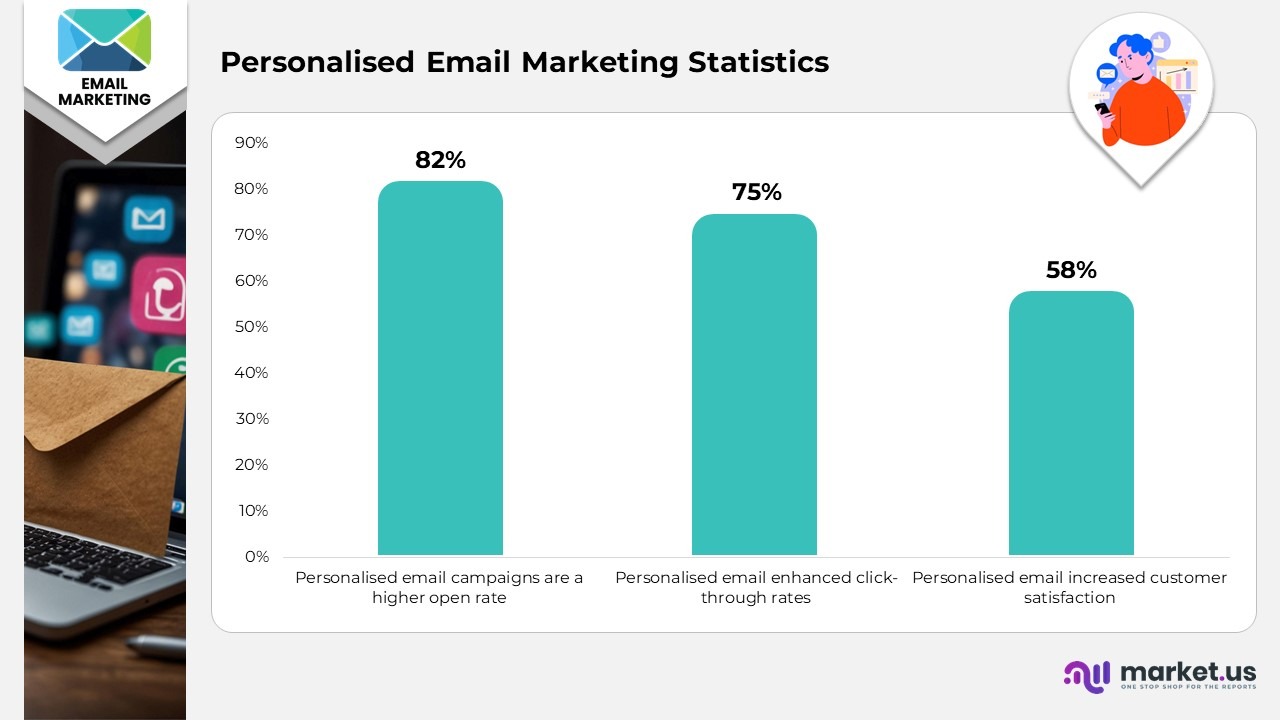
Personalised Email Marketing Statistics
- 75% of survey participants dislike encountering content that is not pertinent to them.
- Irrelevant content remains the primary reason for 43% of individuals opting out of an email subscription.
- 58% of revenue generated from email marketing is attributed to targeted and personalised campaigns.
- 75% of consumers prefer to purchase from a brand that understands their purchase history and suggests relevant products.
- 74% of Baby Boomers view email as their most intimate means of communication.
- Using the recipient’s first name can enhance the open rate by 35%.
- Segmenting email lists results in an astonishing 760% increase in revenue.
- Personalised subject lines are 26% more likely to result in opens.
- The leading three motivations for personalised email campaigns are a higher open rate (82%), followed by enhanced click-through rates (75%), and increased customer satisfaction (58%).
- 96% of companies indicate that personalisation contributes to the success of email marketing.
- Email personalisation decreases acquisition costs by 50%, boosts spending efficiency by 10-30%, and increases revenue generation by 5-15%.
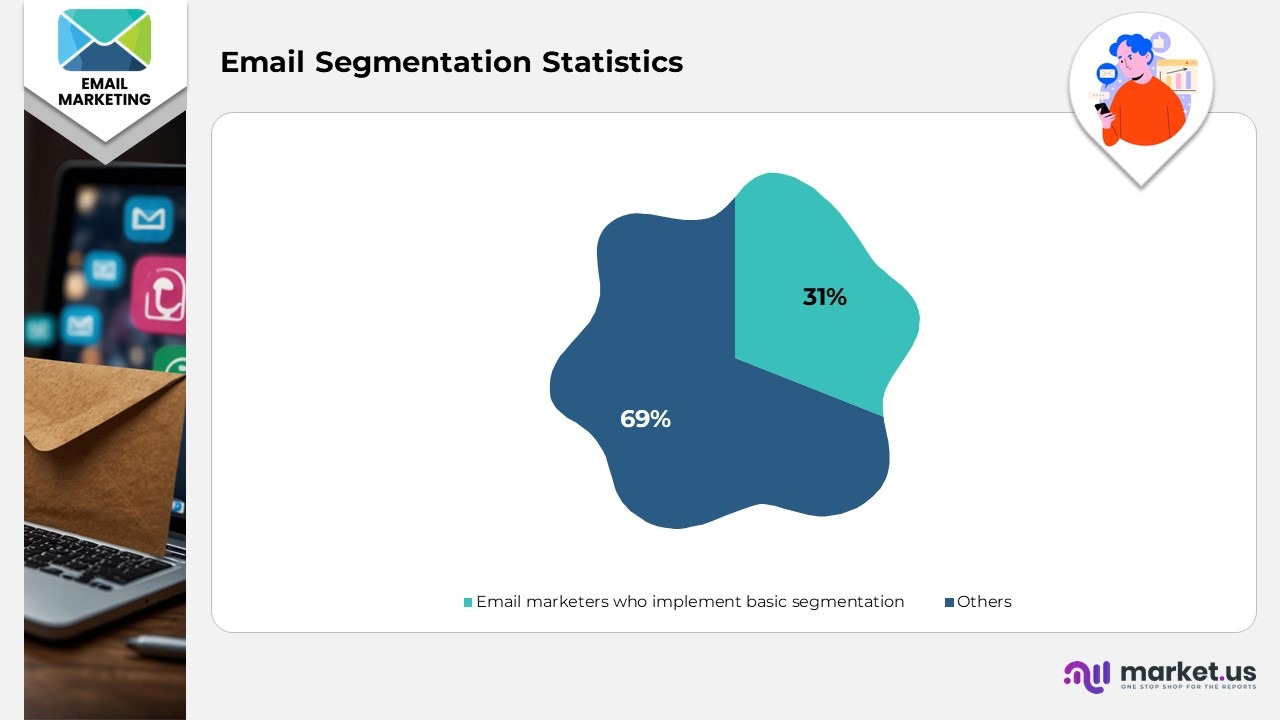
Email Segmentation Statistics
- A quarter of revenue generation can be attributed to segmented lists.
- 74% of customers express frustration when email content does not correspond with their personal interests.
- Only 31% of email marketers implement basic segmentation.
- 78% of marketers regard list segmentation as essential to their marketing strategy.
- Segmented campaigns achieve a click rate of 100.95% compared to non-segmented email campaigns.
Statistics of Email Automation
- In 2023, email emerged as the most automated marketing channel.
- Automation ranks as the third most effective marketing strategy in the present day.
- 18% of brands engaged in email marketing regard automation as their primary approach.
- 31% of email orders result directly from automated campaigns.
- In a study involving 17 billion emails, automated emails achieved open rates that were 84% higher, a conversion rate increase of 2,270%, and a 341% rise in click rates.
- 48% of email marketers intend to enhance automation over the next 12 months.
- According to 55% of marketers, the most automated email campaigns are those focused on onboarding and post-purchase.
Email Subject Line Statistics
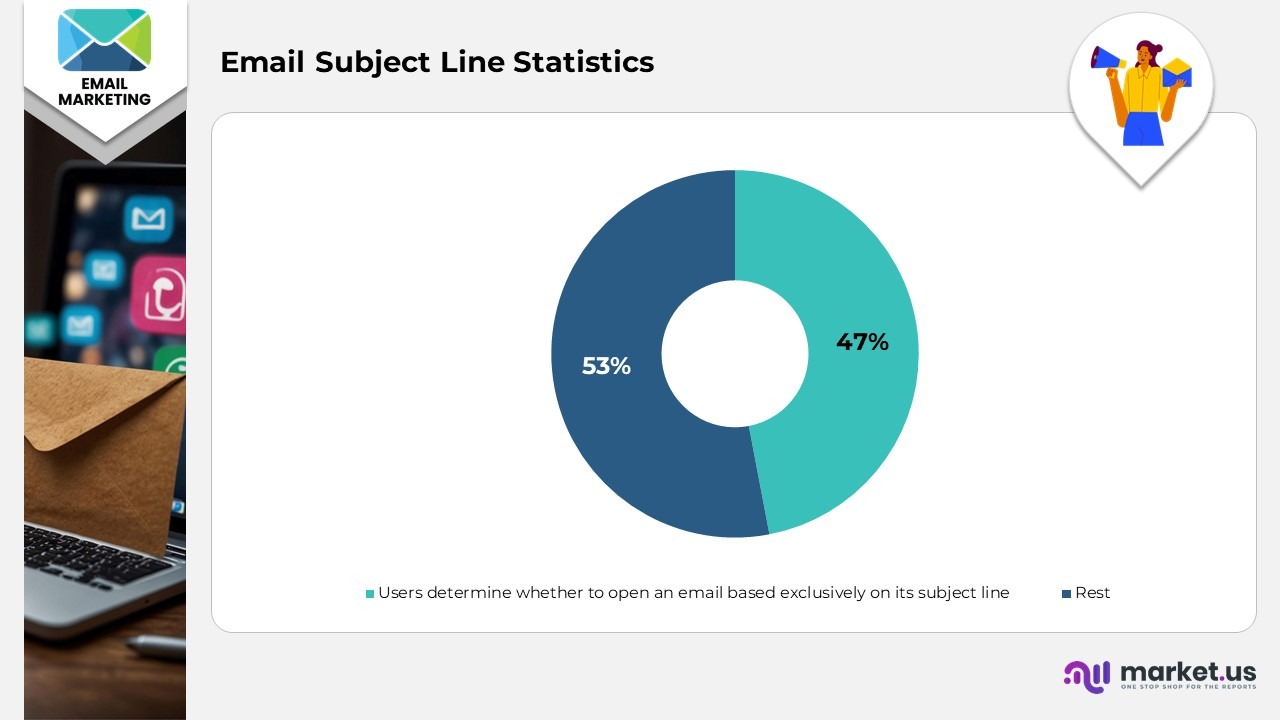
- 47% of recipients determine whether to open an email based exclusively on its subject line.
- Again, relying solely on the subject line, 68% of recipients choose whether to classify an email as spam.
- Subject lines containing 61-70 characters generally achieve the highest open rate of 32.1%.
- The addition of preheader text alongside the subject line yields an average click-through rate of 3.12%.
- Over 60% of recipients consider email subject lines that consist solely of block letters to be unacceptable.
- Incorporating emojis into your subject lines significantly boosts the open rate by 56%.
- Emails featuring the word “update” in their subject lines enjoy the highest average open rate at 42.84%, followed closely by “events” at 42.76%, “news” at 37.98%, “newsletter” at 37.25%, and “prize” at 35.07%.
Benefits of Email Marketing
- Email marketing yields an average return on investment of $36 for every dollar spent.
- Email newsletters rank as the third most utilized channel for content distribution, boasting a 71% usage rate.
- In a survey involving 1,000 small business owners, email marketing was identified as the second most effective channel for enhancing brand awareness, with social media marketing being recognized as the most effective.
- 59% of consumers have made a purchase following the receipt of a marketing email.
- 73% of B2B marketers concur that email marketing is the most effective method for engaging prospects, significantly surpassing the effectiveness of phone calls, events, advertisements, and text messages.
Email Marketing Demographics
- 99% of email users access their inboxes daily, with some individuals checking them more than ten times each day.
- 58% of email users report that they check their inboxes immediately upon waking in the morning.
- In a survey conducted in the United States, 35% and 28% of respondents indicated that they possess two or more than four email addresses, respectively.
- On average, consumers spend 10 seconds reading emails related to brands.
- 40% of email users express a positive attitude towards having at least 50 unread emails in their inbox.
- In the United States, consumers primarily discover brand coupons through email.
- The average email bounce rate across various industries stands at 10.31%.
- 59% of Millennials predominantly use smartphones to check their inboxes.
- 67% of Generation Z members access their inboxes via mobile devices.
- 53% of millennial Gmail users check the promotions tab at least once a day.
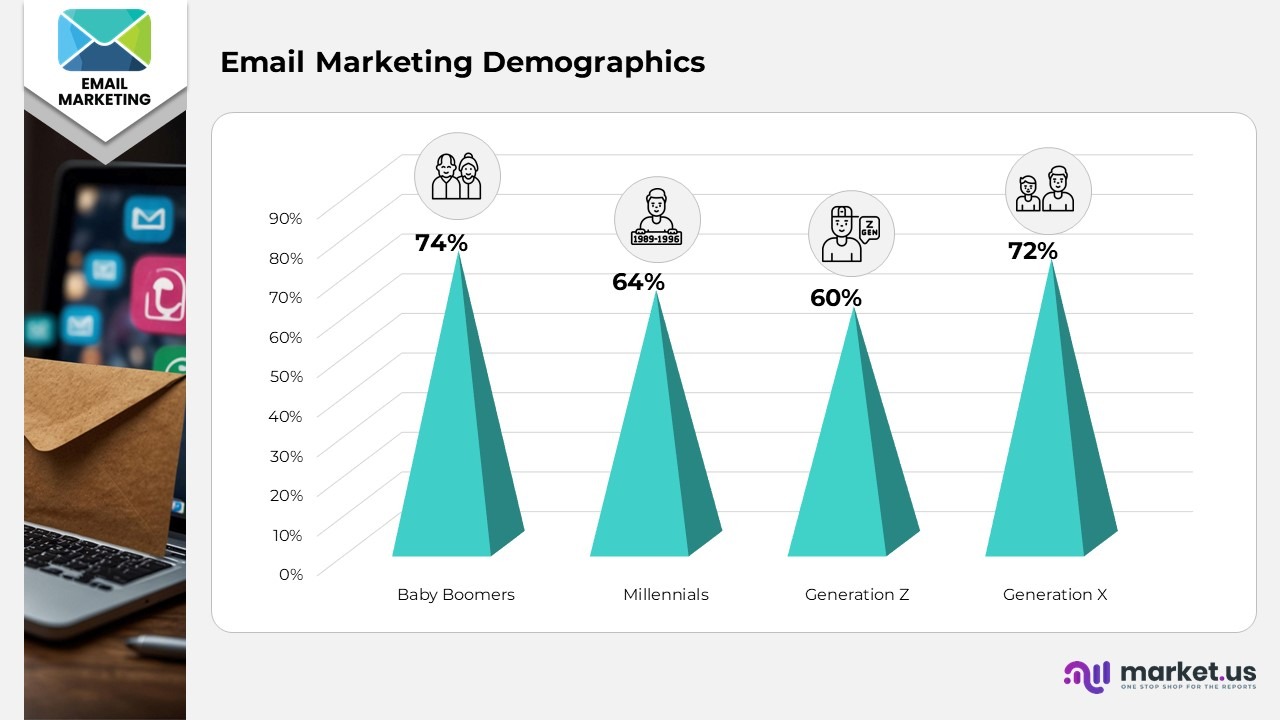
- 74% of Baby Boomers, 72% of Generation X, 64% of Millennials, and 60% of Generation Z utilize email as a personal communication channel with brands.
Email Marketing Conversion Rates
- E-commerce email campaigns typically achieve an average conversion rate of approximately 2.5%.
- Email marketing is recognised for its remarkable return on investment (ROI) of 4400%.
- Cart abandonment emails generally exhibit an average conversion rate of 18.64%.
- The average click-through rate (CTR) for ecommerce emails hovers around 2-3%.
- Mailmodo indicates that the conversion rate for e-commerce email marketing is below 2% of the overall industry.
- As reported by Custora E-Commerce Pulse, email was responsible for 19.8% of all transactions, ranking just behind organic traffic (21.8%) and paid search (19.9%).
- Cart abandonment emails boost sales by 4.43% across all e-commerce sectors.
- The conversion rate for landing pages derived from email marketing in e-commerce enterprises stands at 2.31%.
Day-wise Email Marketing Statistics
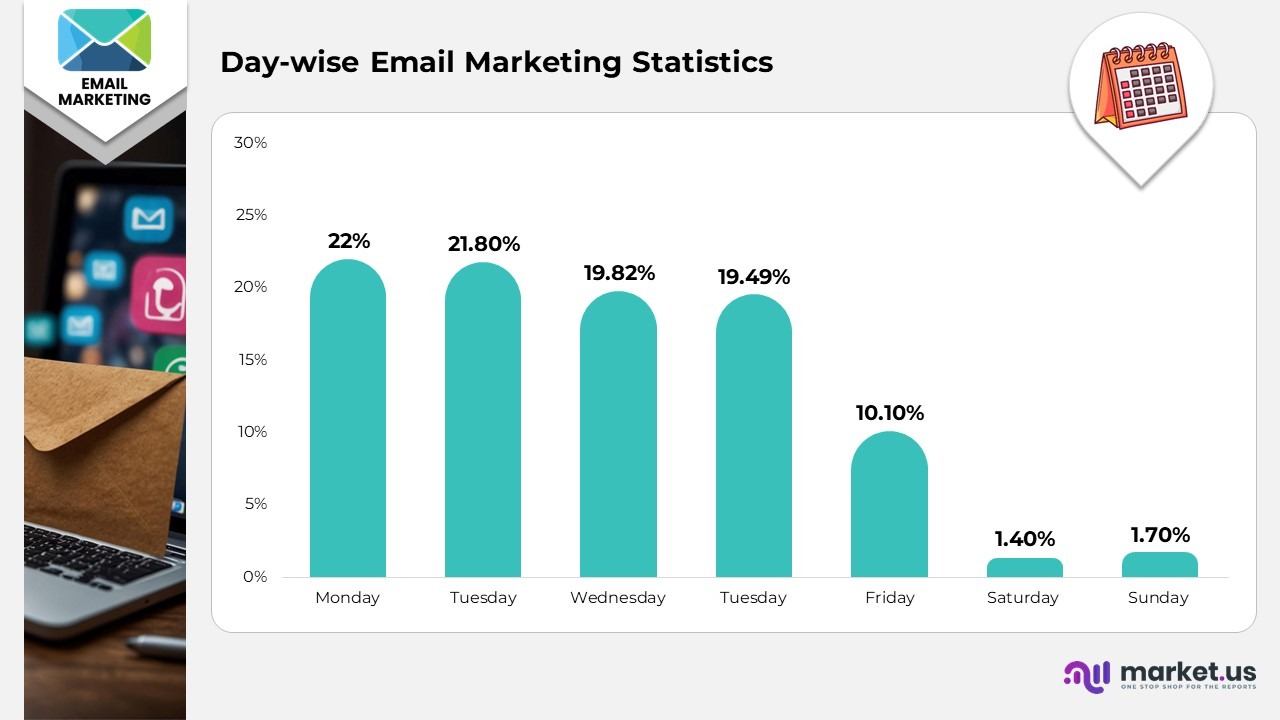
- Monday boasts the highest email open rate at 22%.
- Tuesday records the highest email click-through rate at 21.80%.
- Wednesday and Tuesday exhibit the highest click-to-open rates, standing at 19.82% and 19.49% respectively.
- The optimal days for sending emails are Tuesdays and Fridays.
- The most effective times to send emails are 8 am, 2 pm, and 5 pm.
- The ideal day for launching an email campaign is Thursday.
- Sunday experiences the lowest email open rate, which is 18%.
- Saturday and Sunday show the lowest email click-through rates at 1.4% and 1.7% respectively.
- Friday, Saturday, and Sunday have the lowest click-to-open rates, recorded at 10.1%.
- Weekends are considered the least favorable days for sending emails.
- The least effective time to send an email is between 5 and 6 pm.
- The least favourable day for an email campaign is Saturday.
Email Marketing Fun Facts
- The effectiveness of email marketing is unparalleled. Users have indicated returns on investment (ROIs) as high as 4,400%; even conservative calculations estimate that the channel achieves an average ROI of 3,600%.
- The inaugural marketing email was dispatched in 1978.
- Nearly 20 years later, in 1993, the term “spam” was first introduced.
- The growing volume of unsolicited content marketing and email newsletters eventually resulted in the CAN-SPAM Act of 2003, which also motivated other countries to enact their own anti-spam laws.
Recent Developments
- Recent advancements in email marketing are centred on the utilisation of artificial intelligence (AI) to enhance personalisation and efficiency. There is also an increased focus on data privacy and security, driven by more stringent regulations and transparent practices. Additionally, the incorporation of interactive and accessible content aims to boost user engagement, particularly on mobile devices.
- In 2024, the uptake of generative AI for email personalisation surged by 21%, as reported by our digital marketing specialists.
Email Marketing Future Predictions
- As reported by Statista, the total number of email users worldwide in 1997 was approximately 55 million, with projections indicating that this figure will rise to 4.5 billion by the end of 2025.
Conclusion
Email marketing is a vibrant and efficient method of online marketing that cultivates customer relationships and guides them through the sales funnel. To achieve success, campaigns must be carefully designed, customised to meet individual preferences, and focused on providing value to the target audience, while also adapting to trends like AI personalisation and mobile optimisation.