


Report Overview
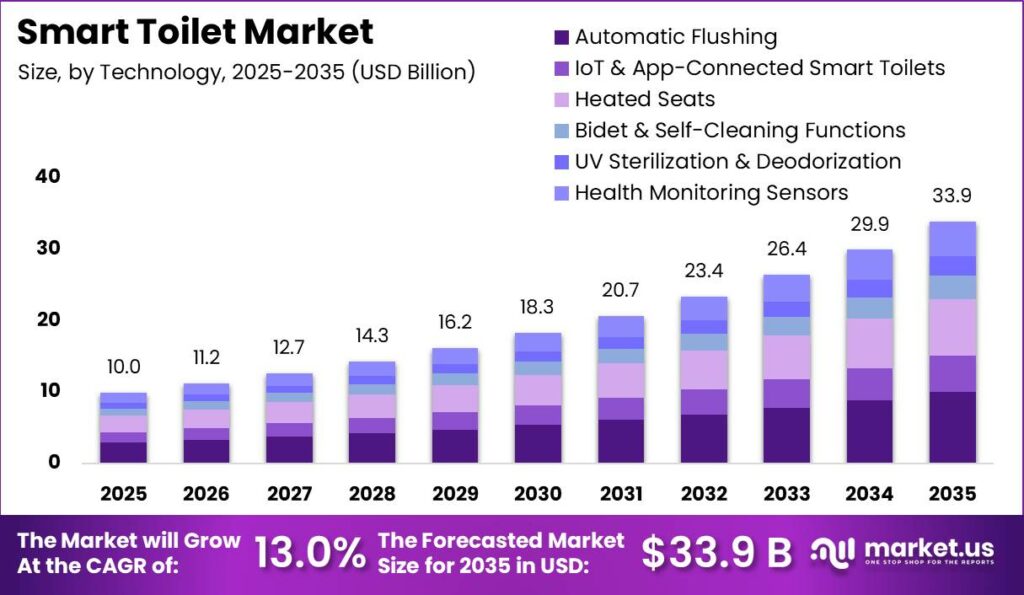
Global Smart Toilet Market size is expected to be worth around USD 33.9 Billion by 2035 from USD 10.0 Billion in 2025, growing at a CAGR of 13.0% during the forecast period 2026 to 2035. This growth path signals a market moving from luxury niche to mainstream bathroom infrastructure. Buyers should expect wider product tiers and faster feature turnover across residential and commercial channels.
The smart toilet market covers integrated intelligent units, add-on smart seats, and retrofit attachments that combine bidet washing, heated seating, auto-flush, and sensor-driven functions. Manufacturers structure the market across product type, technology, application, distribution channel, end user, installation type, and price range. This layered structure lets vendors target distinct buyers, from cost-sensitive homeowners to premium hospitality operators, with tailored feature sets.
Key Takeaways
- Global market size will reach USD 33.9 Billion by 2035, up from USD 10.0 Billion in 2025 at a CAGR of 13.0%.
- Smart Toilets (Integrated Units) lead product type with a 57.80% share.
- Automatic Flushing leads technology with a 29.60% share.
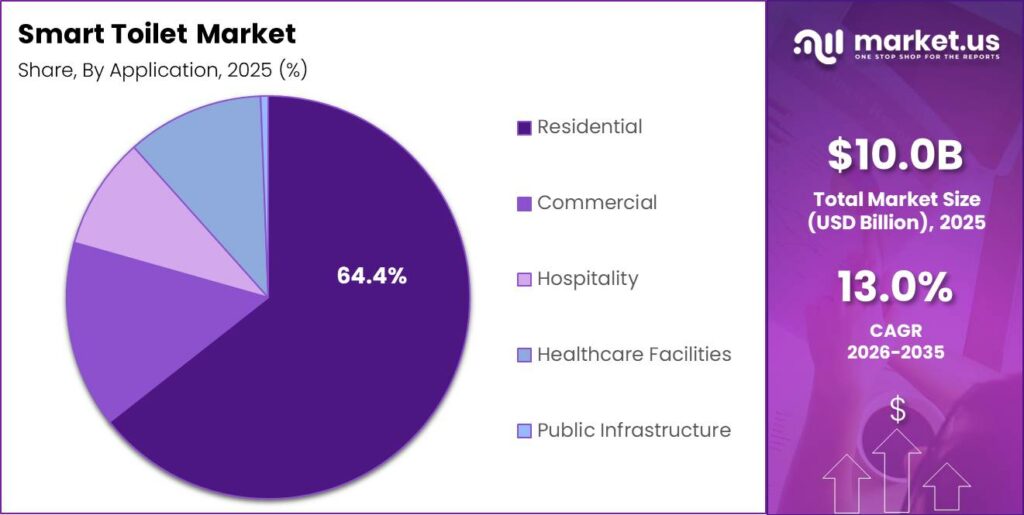
- Residential leads application with a 64.40% share.
- Offline Retail leads distribution with a 68.30% share.
- Household Consumers lead end user with a 60.70% share.
- Floor-Mounted Smart Toilets lead installation with a 55.10% share.
- Mid-Range Smart Toilets lead price range with a 46.50% share.
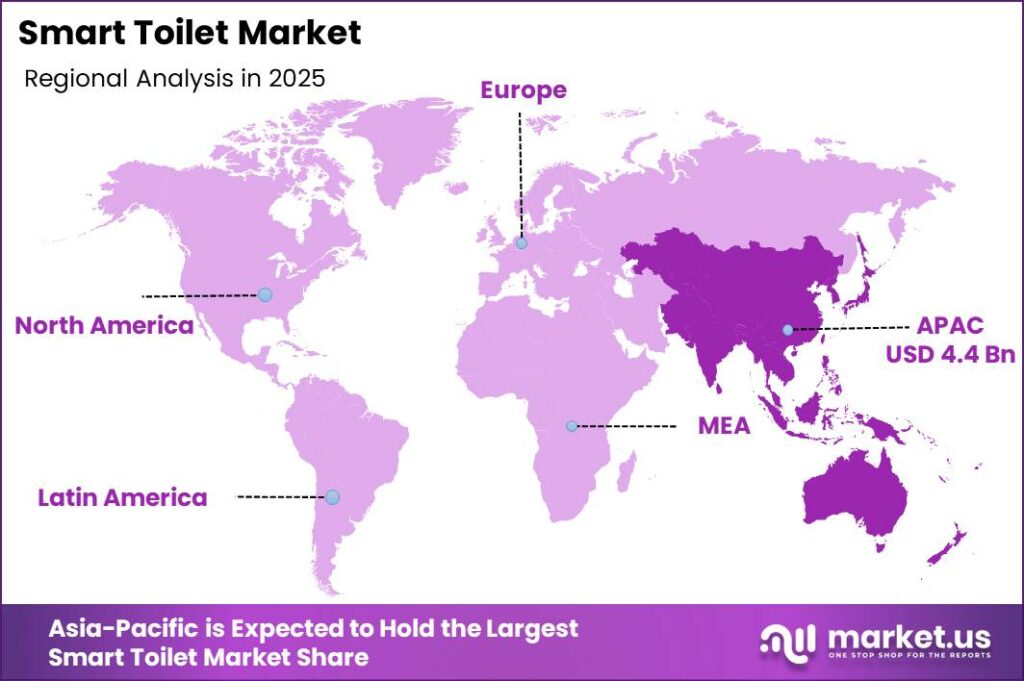
- Asia-Pacific dominates regionally with a 44.60% share, valued at USD 4.46 Billion.
Government water policy shapes buyer behavior across major markets. As per our research, toilets account for nearly 30% of average household indoor water consumption in U.S. homes, making them the largest indoor water-use fixture. This concentration pushes regulators to promote efficient models. Vendors that lead with certified water savings will win faster approval in code-driven procurement.
Water incentives translate savings into a direct purchase argument. As per our research, replacing old toilets with efficient certified models helps the average family save about 13,000 gallons of water annually. This means lower utility bills strengthen the payback case for buyers. Therefore sellers can convert cost-focused households by framing smart toilets as long-term savings, not just comfort upgrades.
Product Type Analysis
Smart Toilets (Integrated Units) dominate with 57.80% due to bundled ceramic and electronics convenience.
In 2025, Smart Toilets (Integrated Units) held a dominant market position in the By Product Type segment of Smart Toilet Market, with a 57.80% share. UN Comtrade classifies these fixtures under HS code 6910 for ceramic sanitary ware, the primary customs line for global toilet trade flows. This single-fixture design removes retrofit guesswork for buyers. Manufacturers that standardize integrated units capture higher per-unit revenue and simpler installation support.
Smart Toilet Seats serve buyers upgrading existing bowls without full replacement. UN Comtrade trade data under HS code 6910 shows China remains the leading exporter of ceramic and electronic sanitary components feeding this segment. This means seat makers can reach cost-sensitive households quickly through existing plumbing. Vendors targeting renovation channels gain a faster path to volume than integrated-unit specialists.
Smart Toilet Attachments offer the lowest entry point for first-time smart bathroom buyers. World Bank urbanization data records over 56% of the global population now living in cities, concentrating demand for compact bathroom upgrades. This creates a mass-market ramp for attachment products. Companies that price attachments aggressively can seed brand loyalty before selling higher-margin integrated units later.
Technology Analysis
Automatic Flushing dominates with 29.60% due to hygiene and water-control reliability.
In 2025, Automatic Flushing held a dominant market position in the By Technology segment of Smart Toilet Market, with a 29.60% share. EPA WaterSense-certified toilets use 1.28 gallons per flush or less, cutting water use by 20% versus the federal standard. This means sensor flushing pairs hygiene with measurable savings. Vendors that combine auto-flush and certification win both comfort-led and compliance-led buyers.
Health Monitoring Sensors turn the toilet into a passive wellness device. A TOTO consumer survey in Japan found 76% of users check their stool condition after use, while only 6% record it digitally. This gap signals strong latent demand for automated tracking. Companies that close this recording gap can open a recurring health-data revenue stream beyond hardware.
IoT and App-Connected toilets link fixtures to broader smart home platforms. ITU data shows global internet penetration reached about 67% of the world population, expanding the connected-home base. This means app control now fits mainstream household infrastructure. Vendors that certify for major platforms reduce buyer friction and defend premium pricing.
Bidet, self-cleaning, heated seat, and UV sterilization functions round out the technology mix. These features collectively hold the remaining share and target comfort and infection-control buyers. This creates room for feature-bundling strategies across price tiers.
Application Analysis
Residential dominates with 64.40% due to home hygiene and comfort upgrades.
In 2025, Residential held a dominant market position in the By Application segment of Smart Toilet Market, with a 64.40% share. World Bank data records global urban population above 4.6 billion people, concentrating home renovation demand in cities. This urban density fuels household fixture upgrades. Manufacturers that target metro housing stock capture the deepest and most stable demand pool.
Commercial buyers prioritize durability and low maintenance across high-traffic restrooms. UNIDO industrial statistics show sustained global manufacturing capacity expansion, supporting large commercial fit-out orders. This means bulk procurement drives commercial demand rhythms. Vendors offering service contracts and rugged units gain an edge in office and retail projects.
Hospitality and Healthcare Facilities demand premium hygiene and guest-comfort features. WHO reports rising global investment in advanced sanitation infrastructure across health systems. This creates specification-driven purchasing for touchless and self-cleaning models. Companies with clinical-grade certifications can command premium pricing in these channels. Public Infrastructure holds the remaining share and buys durability-focused units.
Distribution Channel Analysis
Offline Retail dominates with 68.30% due to hands-on fixture inspection preference.
In 2025, Offline Retail held a dominant market position in the By Distribution Channel segment of Smart Toilet Market, with a 68.30% share. National statistical offices in major markets record home improvement retail as the leading channel for sanitary ware sales. This means buyers still prefer physical inspection before purchase. Vendors that secure showroom shelf space protect their largest sales route.
Online Retail serves buyers comfortable purchasing lower-priced seats and attachments remotely. UNCTAD e-commerce data shows global online retail sales exceeding USD 5 trillion annually, expanding digital fixture purchases. This creates a scalable path for standardized products. Companies with strong logistics and clear installation guides can grow online share faster than showroom-only rivals.
Direct Sales to builders and contractors capture new-construction volume at the project stage. UNIDO construction-linked output data confirms rising global building completions in urban centers. This means specification wins lock in bulk orders early. Manufacturers that build contractor accounts secure predictable, high-volume revenue streams.
End User Analysis
Household Consumers dominate with 60.70% due to daily home hygiene priority.
In 2025, Household Consumers held a dominant market position in the By End User segment of Smart Toilet Market, with a 60.70% share. World Bank data shows global household formation rising alongside urban population above 56% of total population. This means home buyers set the market’s core demand. Vendors that simplify home installation capture this dominant end-user base.
Hotels and Hospitality buyers invest in guest-experience differentiation. IMF tourism-linked economic data shows international travel recovery lifting hospitality capital spending. This creates steady demand for premium restroom fixtures. Companies serving hotel chains gain repeat, multi-unit orders across properties.
Hospitals and Healthcare Institutions prioritize infection control and accessibility. WHO sanitation investment trends support rising healthcare fixture upgrades worldwide. This means clinical hygiene standards drive specification. Corporate Offices and Government and Public Buildings hold the remaining share, buying durable, high-traffic units.
Installation Type Analysis
Floor-Mounted Smart Toilets dominate with 55.10% due to simpler standard plumbing compatibility.
In 2025, Floor-Mounted Smart Toilets held a dominant market position in the By Installation Type segment of Smart Toilet Market, with a 55.10% share. UN Comtrade HS code 6910 trade flows show floor-standing ceramic units as the highest-volume traded sanitary fixture category. This means standard plumbing keeps floor-mounted units easiest to install. Vendors that optimize for existing drainage capture the widest retrofit demand.
Wall-Mounted Smart Toilets appeal to premium and space-saving projects. UNIDO manufacturing data confirms rising output of concealed cistern and frame systems supporting wall installs. This means design-led buyers accept higher installation complexity for aesthetics. Companies that supply matched carrier frames gain an advantage in luxury residential and hospitality fit-outs, holding the remaining share.
Price Range Analysis
Mid-Range Smart Toilets dominate with 46.50% due to balanced feature and affordability appeal.
In 2025, Mid-Range Smart Toilets held a dominant market position in the By Price Range segment of Smart Toilet Market, with a 46.50% share. World Bank income data shows a global middle class exceeding 3 billion people, concentrating spending power for value-tier upgrades. This means mid-range pricing matches the largest buyer wallet. Vendors that anchor here capture the deepest sustainable demand.
Premium Smart Toilets target buyers seeking advanced hygiene and connectivity. IMF consumer spending data confirms rising discretionary income in developed and Gulf markets. This means premium demand tracks wealth concentration. Companies with strong brand equity defend higher margins in this tier.
Economy and Luxury Smart Toilets bracket the market ends. Economy units target first-time buyers, while luxury units serve ultra-premium projects, and both hold the remaining share collectively. This creates space for tiered portfolios spanning entry to flagship.
Key Market Segments
By Product Type
- Smart Toilets (Integrated Units)
- Smart Toilet Seats
- Smart Toilet Attachments
By Technology
- Automatic Flushing
- IoT & App-Connected Smart Toilets
- Heated Seats
- Bidet & Self-Cleaning Functions
- UV Sterilization & Deodorization
- Health Monitoring Sensors
By Application
- Residential
- Commercial
- Hospitality
- Healthcare Facilities
- Public Infrastructure
By Distribution Channel
- Offline Retail (Home Improvement Stores, Specialty Stores, Dealers)
- Online Retail
- Direct Sales (Builders & Contractors)
By End User
- Household Consumers
- Hotels & Hospitality
- Hospitals & Healthcare Institutions
- Corporate Offices
- Government & Public Buildings
By Installation Type
- Floor-Mounted Smart Toilets
- Wall-Mounted Smart Toilets
By Price Range
- Mid-Range Smart Toilets
- Premium Smart Toilets
- Economy Smart Toilets
- Luxury Smart Toilets
Regional Analysis
Asia-Pacific Dominates the Smart Toilet Market with a Market Share of 44.60%, Valued at USD 4.46 Billion
Asia-Pacific leads the market with a 44.60% share, valued at USD 4.46 Billion in 2025. As per our research, WHO projects global access to safely managed sanitation services to rise from 53% in 2018 toward 80% by 2025, driven by heavy Asian infrastructure investment. This means the region pairs mass demand with policy support. Vendors that localize production here capture both volume and cost advantage.
North America stands as the fastest-growing region on premium home upgrades. As per our research, smart bathroom fixtures now feature in a rising share of higher-tier new homes across the region. This means adoption is shifting from remodel to new construction. Companies that build homebuilder accounts convert this shift into stable, high-volume revenue.
Europe, Latin America, and the Middle East and Africa hold the remaining regional share collectively. Europe leads on water regulation and design demand, while Latin America and MEA offer emerging urban entry points. This creates staged expansion routes for vendors seeking growth beyond mature markets.
Key Regions and Countries
North America
- US
- Canada
Europe
- Germany
- France
- The UK
- Spain
- Italy
- Rest of Europe
Asia Pacific
- China
- Japan
- South Korea
- India
- Australia
- Rest of APAC
Latin America
- Brazil
- Mexico
- Rest of Latin America
Middle East and Africa
- GCC
- South Africa
- Rest of MEA
Market Dynamics
Market Opportunity Analysis - Underserved price tiers, emerging regions, and retrofit demand open clear entry points for new players
The Economy and Luxury price tiers remain underexploited beside the dominant Mid-Range segment at 46.50%. Entry buyers lack affordable connected options, while ultra-premium projects want flagship differentiation. This means both ends sit open for focused challengers. New entrants that build dedicated tier platforms can capture demand that broad-line incumbents overlook.
Latin America and the Middle East and Africa stay underdeveloped behind Asia-Pacific’s 44.60% regional lead. Rising urban housing creates fresh first-time smart bathroom demand in these regions. This means early distribution gives lasting brand advantage. Investors backing local partners here can lock share before mature-market rivals arrive.
The Smart Toilet Attachments and Smart Toilet Seat segments trail the integrated units at 57.80%. Large conventional toilet installed bases across older housing need low-cost upgrades. This means retrofit products offer a fast volume route. Companies that price retrofit seats aggressively can seed loyalty before selling higher-margin integrated units later.
Technology and Innovation Landscape - Self-cleaning chemistry, health sensing, and connectivity redefine competitive edges
Self-cleaning water chemistry now separates premium products from basic units. As per our research, Kohler’s 2025 Innate Smart Toilet uses an electrolyzed-water pre-rinse before each flush to disinfect the bowl automatically. This means hygiene automation becomes a core buying trigger. Manufacturers that embed chemical-free disinfection can command premium pricing without adding consumable costs.
Health Monitoring Sensors turn toilets into passive wellness devices. This innovation captures daily biomarker data with zero user effort, aligning with rising preventive-care demand. This means sensor-equipped models open recurring service revenue. Companies that validate accuracy early can build defensible platform advantages before rivals catch up.
IoT and App-Connected functions link fixtures to major smart home ecosystems. Voice control, personalized profiles, and predictive maintenance now define the connected bathroom. This means interoperability drives buyer preference. Vendors that certify across leading platforms reduce friction and protect long-term customer retention.
Drivers
The smart toilet is shifting from a standalone luxury fixture into an integrated node within the smart home ecosystem. This transition expands both the buyer pool and the willingness-to-pay ceiling for connected fixtures. Chinese smart toilet unit sales rose from about 7.8 million units in 2022 to an estimated 11.4 million units in 2024, a 46% volume gain. This means platform integration lifts volume and pricing power together.
Homebuilder behavior reinforces this pull in developed markets. Smart bathroom fixtures appeared in about 34% of new single-family US homes above the $600,000 price tier, up from roughly 18% in 2021. This means adoption is moving from retrofit into higher-volume new construction. Therefore manufacturers must shift channel strategy toward national homebuilder account management as a primary growth vector.
| Driver | (~) % Impact on CAGR Forecast | Geographic Relevance | Impact Timeline |
|---|---|---|---|
| Smart Home & IoT Ecosystem Integration Accelerating Premium Bathroom Fixture Upgrades | +3.8% | China, Japan, South Korea, United States, Germany, UAE, Australia | Short term (≤ 2 years) |
| Aging Population & Accessibility-Driven Demand for Bidet-Integrated & Auto-Flush Hygienic Fixtures | +2.7% | Japan, South Korea, Germany, United States, Italy, Australia, China | Short term (≤ 2 years) |
| Luxury Residential & Five-Star Hospitality Construction Boom Mandating Premium Sanitary Ware | +2.1% | China, UAE, Saudi Arabia, India, United States, Southeast Asia | Short term (≤ 2 years) |
| Water Conservation Regulatory Mandates Incentivizing Smart Flush & Precision Water Management Toilets | +1.6% | United States (EPA WaterSense), Australia (WELS), European Union, Singapore, India | Medium term (2–4 years) |
| Post-COVID Hygiene Consciousness Elevation Driving Touchless & Self-Cleaning Feature Adoption | +1.2% | Global — United States, Europe, India, Southeast Asia, Middle East | Short term (≤ 2 years) |
Restraints
A wide price gap between smart and conventional toilets freezes mass-market conversion. Entry-level smart seats retail at $180 to $380, while integrated units range from $600 to $4,500, versus a conventional toilet at $80 to $220. This gap of 3 to 20 times blocks buyers below the luxury tier. This means value-segment demand stays capped until costs fall sharply.
Emerging markets show the sharpest bottleneck. India installs about 35 to 40 million toilet units yearly at an average price near $54 to $144 each. This means even entry seats cannot penetrate without a 60 to 75% cost cut. Therefore premium-focused makers keep deferring the value-tier platform investment, leaving mass-market entry structurally underdeveloped.
| Restraint | (~) % Impact on CAGR Forecast | Geographic Relevance | Impact Timeline |
|---|---|---|---|
| High Unit Price Premium vs. Conventional Toilets Freezing Mass-Market & Value-Segment Conversion | -3.1% | Global — most acute in India, Southeast Asia, Latin America, Eastern Europe, non-premium U.S. & EU segments | Short term (≤ 2 years) |
| Electrical Infrastructure Requirement in Bathrooms Limiting Retrofit Adoption in Legacy Residential Stock | -2.0% | United States, United Kingdom, France, India, Brazil — older residential building stock | Short term (≤ 2 years) |
| Building Code & Plumbing Regulation Gaps for Smart Sanitary Ware in Non-Asian Markets | -1.1% | United States, India, Middle East, Sub-Saharan Africa | Medium term (2–4 years) |
| Consumer Privacy Concerns Over Health Data Collection by Smart Toilet Sensors | -0.7% | European Union (GDPR), United States, Germany, France, Australia | Medium term (2–4 years) |
| Skilled Plumber & Electrician Co-Installation Requirement Inflating Total Installed Cost | -0.4% | United States, United Kingdom, Australia, India — markets with licensed trade labor requirements | Short term (≤ 2 years) |
Challenges
Next-generation toilets with urine, stool, and vital-sign sensors turn a fixture into a regulated health device. European rules may classify a urine-analysis toilet as a Class IIa diagnostic device, requiring a Notified Body review of 12 to 24 months at €80,000 to €250,000 per engagement. This means compliance cost and delay create real market friction.
US rules add further ambiguity for makers. FDA clearance as a Class II device costs $18,000 to $35,000 in fees with a 90 to 180 day review, versus a faster wellness-product route. This gap of roughly 10 times in time-to-market creates a new opportunity. Vendors that master dual regulatory tracks can unlock reimbursable health-monitoring revenue ahead of rivals.
| Challenge | (~) % CAGR Friction Drag | Geographic Relevance | Mitigation Horizon |
|---|---|---|---|
| Health Data Regulatory Compliance Complexity | -1.4% | European Union (GDPR + MDR), United States (HIPAA adjacency), South Korea, Australia | Long term (≥ 4 years) |
| After-Sales Service & Electronic Component Repairability Gap | -1.0% | Global — most acute in India, Southeast Asia, Middle East, Latin America | Long term (≥ 4 years) |
| Interoperability & Smart Platform Fragmentation | -0.7% | Global; divergence between Japanese, Chinese, Korean, and Western smart home ecosystems | Medium term (2–4 years) |
| Semiconductor & Sensor Component Lead-Time Volatility | -0.5% | Global; impacting Japan, China, South Korea — primary smart toilet production hubs | Medium term (2–4 years) |
| Consumer Education & Hygiene Behavior Change Barrier | -0.3% | United States, United Kingdom, India, Middle East, Sub-Saharan Africa | Medium term (2–4 years) |
Opportunities
The smart toilet can become a clinical-grade home diagnostics hub as sensor technology matures. About 96 million US adults have prediabetes, and 80% remain undiagnosed, so passive daily urine screening offers early detection at near $0 incremental cost. This means the fixture bridges consumer sanitary ware and remote patient monitoring. Early movers can define an entirely new product category.
Reimbursement transforms the unit economics for prepared vendors. US remote monitoring billing pays about $57 to $120 per patient monthly, or $684 to $1,440 per unit yearly. This shifts a one-time hardware sale toward a recurring platform model. Therefore companies that secure device clearance can lift gross margins from 35 to 50% toward 60 to 75%.
| Opportunity | (~) % Potential CAGR Upside | Geographic Relevance | Execution Window |
|---|---|---|---|
| Preventive Health Monitoring & Digital Biomarker Platform — Smart Toilet as a Clinical-Grade Home Diagnostics Hub | +2.8% | United States, Japan, South Korea, Germany, United Kingdom, Australia, UAE | Long term (≥ 4 years) |
| India Premium Residential & Hospitality Smart Bathroom Segment as a High-Growth First-Time Deployment Market | +1.4% | India — Metro & Tier-1 cities; five-star hospitality, luxury residential, corporate campuses | Medium term (2–4 years) |
| Smart Toilet Subscription & Predictive Maintenance Service Platform for Institutional & Hospitality Channels | +1.0% | United States, Europe, Japan, UAE, Singapore, Australia | Medium term (2–4 years) |
| Retrofit Smart Seat Upgrade Market for Conventional Toilet Base in Non-New-Build Residential Stock | +0.7% | United States, United Kingdom, France, India, Brazil — large conventional toilet installed base | Short term (≤ 2 years) |
| Accessible & Elder-Care Smart Toilet Segment Expansion via Healthcare Reimbursement & Government Subsidy Schemes | +0.4% | Japan, Germany, South Korea, United Kingdom (NHS aids), Australia (NDIS), United States (Medicaid assistive device) | Medium term (2–4 years) |
Key Company Insights
TOTO Ltd. holds a structural advantage through the largest documented premium installed base, with over 4 million NEOREST units placed globally by 2025. This scale builds brand trust and recurring parts revenue. As per our research, EPA WaterSense models cutting water use by 20% align with TOTO’s efficiency positioning. In January 2025, TOTO launched its next-generation NEOREST lineup at ISH, reinforcing premium leadership.
LIXIL Corporation competes through a broad multi-brand portfolio spanning premium and value tiers. This range lets the company address both luxury hospitality and cost-sensitive residential buyers at once. Its global manufacturing footprint supports flexible pricing across regions. However, its wide brand spread risks diluting focus against specialists that concentrate purely on high-margin premium smart toilet innovation.
Key Players
- TOTO Ltd.
- LIXIL Corporation
- Kohler Co.
- Roca Sanitario S.A.
- Geberit AG
- Duravit AG
- Villeroy & Boch AG
- American Standard Brands
- Panasonic Holdings Corporation
- JOMOO Group
- Arrow Home Group
- HEGII Sanitary Ware
- Dongpeng Sanitary Ware
- Toshiba Lifestyle Products & Services Corporation
- Bio Bidet by Bemis
Recent Developments
- June 2026: Kohler expanded its Leap smart toilet portfolio by launching new Leap Smart Toilet Plus and Leap Lite Smart Toilet models featuring dual-wand bidet technology, touchless flushing, heated seats, programmable presets, and EPA WaterSense certification.
- April 2025: JOMOO Group unveiled AI-powered smart bathroom solutions, including intelligent toilets with digital health monitoring and smart home connectivity, at the 137th Canton Fair.
Geopolitical Impact Analysis
Trade tensions reshape smart toilet supply chains that depend on Asian ceramics and electronics. According to the WTO, global merchandise trade growth stayed near 2.7% in recent years, while US tariffs on many Chinese goods reached 25% or higher. This means fixtures sourced from China face steep import cost pressure. Manufacturers that diversify toward Vietnam or India protect margins against tariff shocks.
Shipping disruptions add cost and delay to globally traded sanitary ware. As reported by UNCTAD, Red Sea rerouting lifted average container freight rates by more than 150% during peak disruption, adding transit delays of 10 to 14 days. This means delivery timelines for imported units stretch and inflate. Companies that build regional warehousing and nearshore assembly gain reliability advantages over import-only rivals.
Report Scope
| Report Features | Description |
|---|---|
| Market Value (2025) | USD 10.0 Billion |
| Forecast Revenue (2035) | USD 33.9 Billion |
| CAGR (2026-2035) | 13.0% |
| Base Year for Estimation | 2025 |
| Historic Period | 2020-2024 |
| Forecast Period | 2026-2035 |
| Report Coverage | Revenue Forecast, Market Dynamics, Market Opportunity Analysis, Technology and Innovation Landscape, Competitive Landscape, Recent Developments |
| Segments Covered | By Product Type (Smart Toilets (Integrated Units), Smart Toilet Seats, Smart Toilet Attachments), By Technology (Automatic Flushing, IoT & App-Connected Smart Toilets, Heated Seats, Bidet & Self-Cleaning Functions, UV Sterilization & Deodorization, Health Monitoring Sensors), By Application (Residential, Commercial, Hospitality, Healthcare Facilities, Public Infrastructure), By Distribution Channel (Offline Retail, Online Retail, Direct Sales), By End User (Household Consumers, Hotels & Hospitality, Hospitals & Healthcare Institutions, Corporate Offices, Government & Public Buildings), By Installation Type (Floor-Mounted Smart Toilets, Wall-Mounted Smart Toilets), By Price Range (Mid-Range, Premium, Economy, Luxury Smart Toilets) |
| Regional Analysis | North America (US and Canada), Europe (Germany, France, The UK, Spain, Italy, and Rest of Europe), Asia Pacific (China, Japan, South Korea, India, Australia, and Rest of APAC), Latin America (Brazil, Mexico, and Rest of Latin America), Middle East and Africa (GCC, South Africa, and Rest of MEA) |
| Competitive Landscape | TOTO Ltd., LIXIL Corporation, Kohler Co., Roca Sanitario S.A., Geberit AG, Duravit AG, Villeroy & Boch AG, American Standard Brands, Panasonic Holdings Corporation, JOMOO Group, Arrow Home Group, HEGII Sanitary Ware, Dongpeng Sanitary Ware, Toshiba Lifestyle Products & Services Corporation, Bio Bidet by Bemis |
| Customization Scope | Customization for segments, region / country-level will be provided. Additional customization can be done based on requirements. |
| Purchase Options | We have three licenses to opt for: Single User License | Multi-User License (Up to 5 Users) | Corporate Use License (Unlimited User and Printable PDF) |





































