


Report Overview
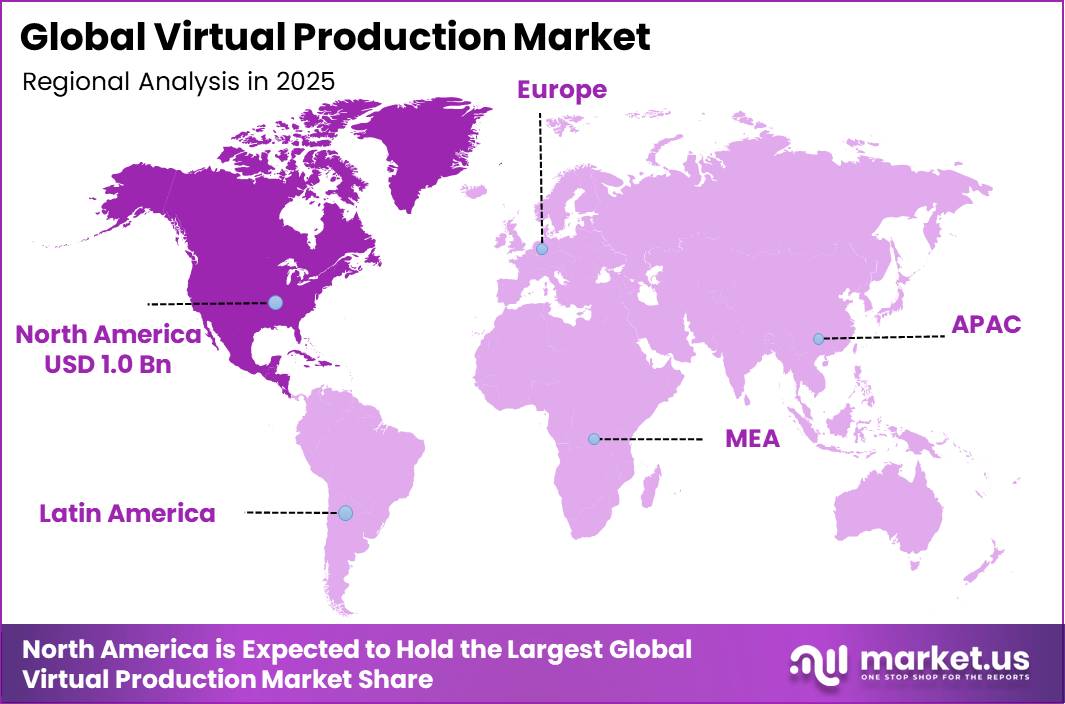
In 2025, the Global Virtual Production Market was valued at USD 2.6 billion. The market is projected to grow at a CAGR of 25.4% during 2026–2035, reaching approximately USD 24.7 billion by 2035. North America dominated the global market in 2025, accounting for more than 38.1% of the total market share and generating approximately USD 1.0 billion in revenue.
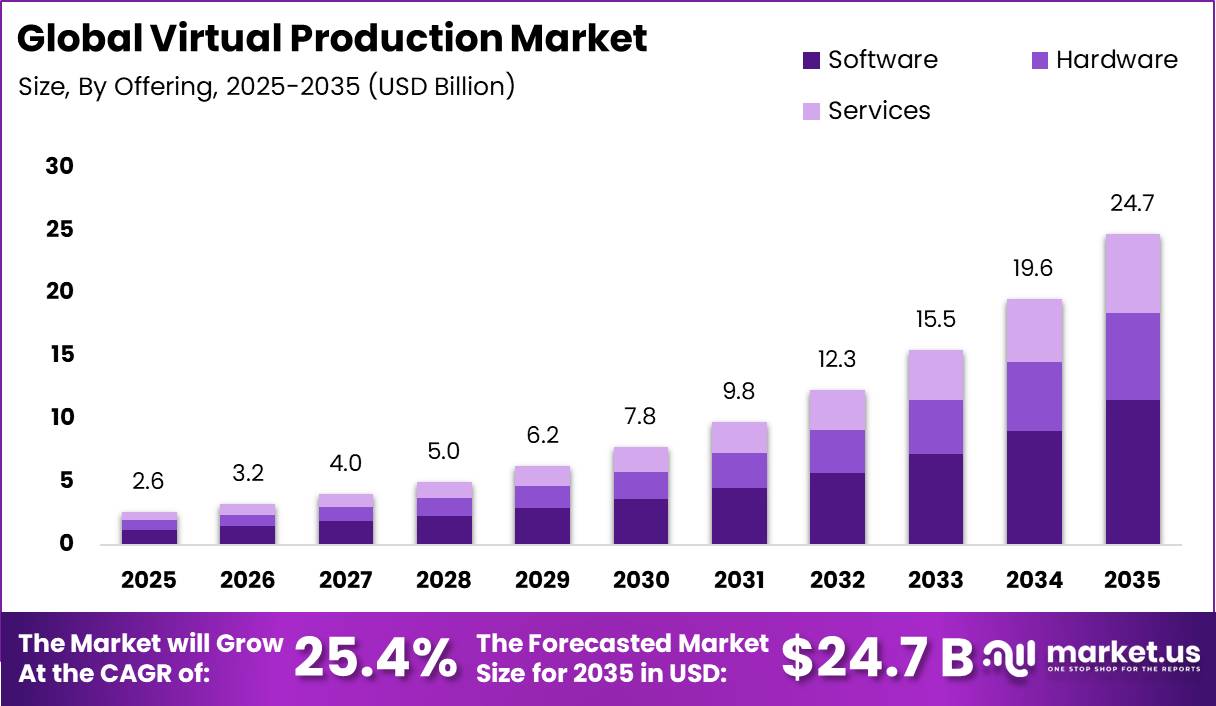
The growth of virtual production is mainly driven by rising global demand for high-quality digital content and the need for faster, more cost-efficient production methods. According to KPMG, the world’s 12 largest media and entertainment companies spent USD 210 billion on content in 2024, reflecting a 4% year-over-year increase and a 10% CAGR from 2020 to 2024.
Virtual production technologies, including LED volume stages and real-time rendering, help studios reduce location costs, shorten production timelines, and improve creative flexibility. WIPO reported that global film production reached 9,511 films in 2023, highlighting strong demand for advanced production solutions.
North America’s leading position is supported by its well-established entertainment industry. The Motion Picture Association (MPA) reported that the U.S. film and television sector supports 2.01 million jobs, generates USD 202 billion in wages, and includes more than 162,000 businesses. Meanwhile, Asia Pacific is emerging as the fastest-growing region due to expanding content production. India’s media and entertainment industry generated USD 13.1 billion in revenue in FY2024, creating significant opportunities for virtual production adoption across film, television, and digital platforms.
Key Takeaway
- The Global Virtual Production Market was valued at USD 2.6 billion and is projected to reach USD 24.7 billion, growing at a CAGR of 25.4%.
- Software dominated the market by offering, accounting for a 46.4% share, driven by increasing demand for real-time rendering, virtual environments, and content creation platforms.
- Production held the largest market share by type at 43.2%, supported by the rising adoption of LED volumes, virtual sets, and real-time visualization technologies.
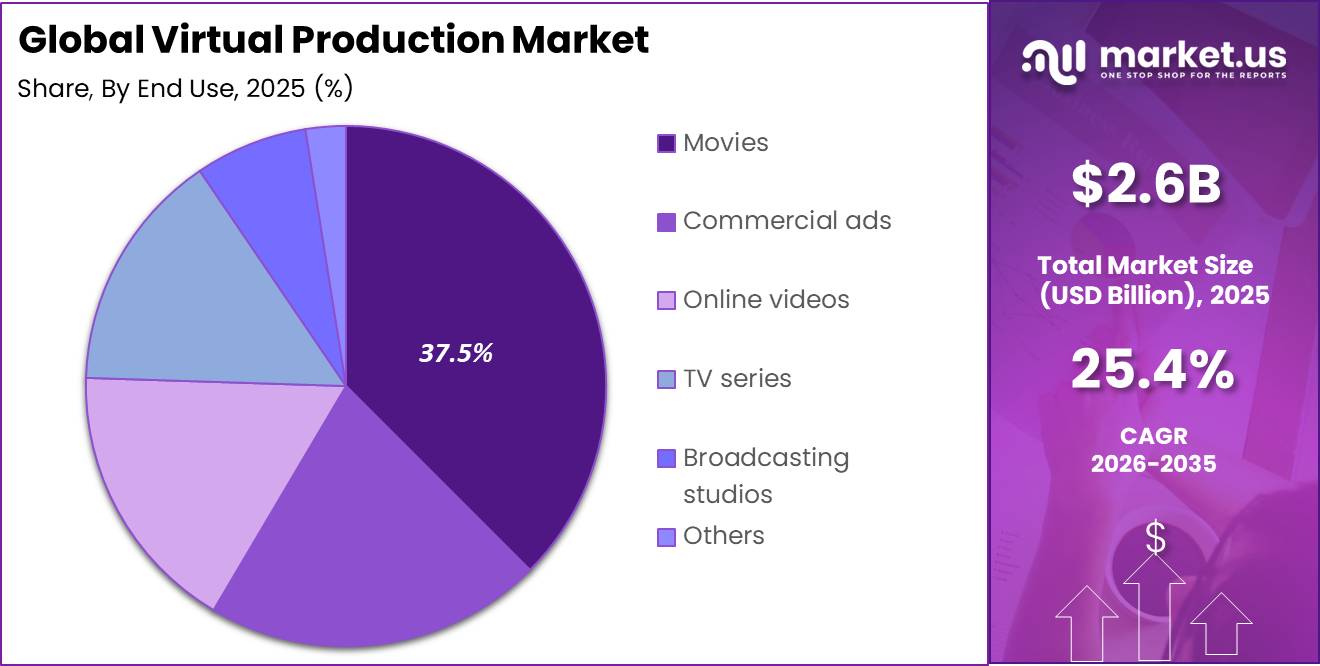
- Movies emerged as the leading end-use segment, capturing 37.5% share due to growing demand for advanced visual effects and immersive filmmaking experiences.
- North America dominated the global Virtual Production Market with a 38.1% share, valued at USD 1.0 billion, supported by major entertainment studios and early adoption of virtual production technologies.
By Offerings
The Software segment dominated the Virtual Production Market in 2025, capturing approximately 46.4% of the total market share. The segment maintains its leading position as software forms the core foundation of virtual production workflows, supporting real-time rendering, digital environment creation, virtual scouting, previsualization, and in-camera visual effects (ICVFX).
The growing scale of global content production is further strengthening software demand. According to WIPO, global feature film production reached more than 9,600 titles in 2024, exceeding the previous record of 9,511 films in 2023 and increasing by 68% from the pandemic low of 5,656 films in 2020.
Each production using virtual workflows requires continuous access to rendering engines, asset management tools, virtual camera systems, and production software, creating recurring demand for software solutions. Additionally, PwC projects the global Entertainment & Media industry will reach USD 4.2 trillion in revenues by 2030, supported by strong digital content growth.
With global OTT revenues reaching USD 226.6 billion in 2025, growing 13.9% year-over-year, studios and streaming platforms are increasingly adopting scalable software-based virtual production solutions to improve production speed and cost efficiency. UNCTAD further reported that digitally deliverable services accounted for 56% of global services exports in 2024, highlighting the expanding role of software-driven workflows across creative industries.
By Type
Post-Production segment dominated the Virtual Production Market in 2025, accounting for approximately 43.2% of the total market share. The segment maintains its leading position because post-production remains an essential stage in every content production workflow, even with the growing adoption of virtual production technologies.
UNCTAD reported that digitally deliverable services represented 56% of global services exports in 2024, valued at USD 1.2 trillion, supporting demand for digital content creation technologies. Furthermore, the IFC highlighted that creative industries support approximately 50 million jobs globally and could contribute 10% of global GDP before 2030, encouraging greater investment in production-stage virtual technologies.
By End Use
The movies segment dominated the Virtual Production Market with 37.5% in 2025, supported by the high production budgets, advanced visual requirements, and large-scale adoption of virtual production technologies in theatrical filmmaking.
The global film industry continues to generate strong demand for LED volumes, real-time rendering, and in-camera visual effects (ICVFX) solutions. According to WIPO and Omdia, global feature film production exceeded 9,600 films in 2024, marking the highest production level recorded. The global box office generated approximately USD 30 billion in revenue in 2024, while the Marché du Film reported 4.8 billion cinema tickets sold worldwide in 2024, generating nearly EUR 28 billion in estimated revenues.
Large-scale movie productions are among the primary users of virtual production due to their ability to justify high technology investments, with LED volume stages requiring around USD 8–16 million in hardware costs. The Motion Picture Association (MPA) reported that the U.S. film and television industry includes more than 162,000 businesses, creating a strong customer base for virtual production providers.
Key Market Segments
By Offering
- Hardware
- Software
- Services
By Type
- Pre-production
- Production
- Post-production
By End Use
- Commercial ads
- Movies
- Online videos
- TV series
- Broadcasting studios
- Education & public service channels
- Entertainment shows
- Live event broadcasting
- News broadcasting
- Political & financial commentary
- Sports broadcasting entertainment shows
- Weather & traffic studios
- Others
Market Dynamics
Drivers
| Driver | (~) % Impact on CAGR | Geographic Relevance | Impact Timeline |
|---|---|---|---|
| Acceleration of LED volume deployments | +4.0% | North America, Europe, East Asia | Short term (≤ 2 years) |
| Streaming platforms’ content volume expansion | +3.0% | Global | Short term (≤ 2 years) |
| Real-time game engines for film & TV | +2.5% | Global | Medium term (2–4 years) |
| Cost optimization vs location shoots | +2.0% | Global | Medium term (2–4 years) |
| Adoption in advertising & corporate media | +1.5% | Global, urban media hubs | Short term (≤ 2 years) |
| Integration with AR/VR/XR workflows | +1.2% | Global early adopters | Long term (≥ 4 years) |
Acceleration of LED volume deployments
Rapid commissioning of large LED volumes in major production hubs is the single strongest driver of virtual production market growth, turning what were experimental stages in 2023–2024 into commercially booked infrastructure by 2026 with installed capacity now supporting several hundred high-end episodic and feature projects annually worldwide.
Each new stage represents capital investment in the range of USD 5–20 million per facility (LED walls, tracking, real-time rendering, and ancillary gear), and with global virtual production revenues around USD 3.9 billion in 2026, these installations underpin a baseline CAGR near the high-teens by converting one-off CapEx into recurring stage rental, content services, and engine licensing revenues.
As studios shift 15–25% of exterior shoots and complex VFX shots into LED volumes, they typically cut per-day location costs by 20–40% while compressing shooting schedules by 10–20%, freeing budgets that are reallocated into virtual production-heavy pipelines and reinforcing a multi-year upgrade cycle for display, GPU, and tracking vendors.
This driver also alters business models toward bundled “virtual stage-as-a-service” offerings, with top facilities reporting utilization rates above 60–70% of available stage days and multi-year contracts from streamers, effectively locking in demand visibility and supporting sustained double-digit growth for the ecosystem.
Restraints
| Restraint | (~) % Impact on CAGR | Geographic Relevance | Impact Timeline |
|---|---|---|---|
| High upfront CapEx & financing constraints | -3.5% | Global, stronger in emerging markets | Short term (≤ 2 years) |
| Limited availability of skilled VP crews | -2.5% | Global | Medium term (2–4 years) |
| Studio risk aversion to workflow overhaul | -2.0% | Global, legacy studio clusters | Short term (≤ 2 years) |
| Power & infrastructure costs for large volumes | -1.8% | Regions with high energy tariffs | Medium term (2–4 years) |
| Uncertain ROI for mid-size content houses | -1.5% | Global independent production sector | Short term (≤ 2 years) |
| Regulatory & permitting hurdles for new stages | -1.2% | Urban centers with strict zoning | Medium term (2–4 years) |
High upfront CapEx & financing constraints
The requirement for multi-million-dollar upfront investment in LED volumes, motion tracking, and real-time compute infrastructure is a primary restraint that directly suppresses the number of new virtual production facilities commissioned each year and drags the otherwise high-teens baseline CAGR down by an estimated 3.5 percentage points.
Typical greenfield stages demand CapEx of USD 5–20 million, meaning a relatively small pool of operators must carry high leverage ratios or secure subsidies, and rising interest rates over 2024–2025 materially increased annual debt service costs by 150–250 basis points for media infrastructure loans.
As a result, many regional studios defer builds or opt for partial retrofits, reducing available LED square meterage growth from a potential 25–30% per year to closer to 10–15%, compressing revenue for hardware vendors, systems integrators, and stage operators that depend on incremental capacity additions.
Challenges
| Challenge | (~) % CAGR | Geographic Relevance | Mitigation Horizon |
|---|---|---|---|
| Complex multi-vendor technology integration | -3.0% | Global | Medium term (2–4 years) |
| Standardization of real-time workflows | -2.5% | Global | Medium term (2–4 years) |
| Latency & color calibration issues | -2.2% | Global | Short term (≤ 2 years) |
| Content pipeline redesign complexity | -2.0% | Global | Medium term (2–4 years) |
| Limited interoperability of toolchains | -1.8% | Global | Long term (≥ 4 years) |
| Data & asset management at scale | -1.5% | Global major studios | Long term (≥ 4 years) |
Complex multi-vendor technology integration
Virtual production deployments rely on tight integration of LED panels, camera tracking, real-time 3D engines, GPU clusters, and color pipelines from multiple vendors, creating a structural challenge that shaves an estimated 3.0 percentage points off the market’s maximum achievable growth by inflating project risk, engineering overhead, and downtime relative to fully standardized stacks.
Typical large stages incorporate thousands of LED tiles, dozens of high-end cameras, multi-node render clusters, and intricate network and synchronization layers, with integration and calibration work often consuming 10–20% of total project budgets and adding 2–4 weeks to commissioning timelines, which reduces annual throughput of new installations and constrains revenue realization.
Operationally, even minor mismatches in color reproduction or latency between engines and display hardware can force reshoots or post fixes costing USD 50,000–250,000 per production, eroding the cost-savings thesis and making some studios reluctant to scale usage beyond flagship projects.
Opportunities
| Opportunity | (~) % Potential CAGR | Geographic Relevance | Execution Window |
|---|---|---|---|
| Expansion into real-time immersive experiences | +3.8% | Global, urban entertainment hubs | Long term (≥ 4 years) |
| SaaS-based virtual production tools | +3.0% | Global | Medium term (2–4 years) |
| Localized stages in emerging markets | +2.5% | Asia-Pacific, Latin America, Middle East | Long term (≥ 4 years) |
| Cross-monetization of reusable 3D assets | +2.2% | Global | Medium term (2–4 years) |
| Integration with live sports & events | +2.0% | Global | Medium term (2–4 years) |
| AI-assisted virtual production workflows | +1.8% | Global | Long term (≥ 4 years) |
Expansion into real-time immersive experiences
Beyond its current role in film and television, virtual production infrastructure can be repurposed for ticketed immersive experiences, interactive installations, and themed attractions, representing largely untapped future TAM that could add roughly 3.8 percentage points of CAGR upside above the baseline if scaled, with potential global revenues in the high-single to low-double-digit billions by the early 2030s.
Large LED volumes in urban centers can host rotating experiential content, concert visualizations, branded worlds, and narrative environments where per-visitor pricing of USD 20–50 and annual footfall of 200,000–500,000 visitors per site yields incremental venue revenue of USD 4–25 million that is distinct from traditional production bookings.
Because the same real-time engines, GPU infrastructure, and 3D environments can be reused across screen content and location-based experiences, operators can drive asset utilization up by 20–30% and expand operating margins by an estimated 5–10 percentage points through multi-use scheduling and IP licensing.
Strategically, this opportunity remains future-oriented rather than a current driver, as most stages still allocate more than 80% of available days to film and episodic work in 2025–2026, leaving substantial white space for new business models that treat virtual production facilities as hybrid media and entertainment venues.
Geopolitical Impact Analysis
Geopolitical tensions, trade restrictions, and supply chain disruptions are emerging as key challenges for the Virtual Production Market, particularly due to the industry’s dependence on high-value hardware components such as LED volume walls, real-time rendering systems, and motion-capture equipment. The increasing U.S.-China trade conflict is raising equipment costs and creating uncertainty for virtual production infrastructure providers.
According to the Peterson Institute for International Economics (PIIE), average U.S. tariffs on Chinese imports reached 47.5% in 2025, covering 100% of Chinese goods and increasing by 26.8 percentage points since January 2025. Since China manufactures approximately 70% of global LED display panels, higher tariffs directly impact the cost of LED arrays, driver ICs, and display components used in virtual production stages.
In addition, export restrictions introduced by China in 2025 on seven rare earth elements, including dysprosium, terbium, and samarium, have increased supply risks for components used in LED modules and motion-capture systems. China’s rare earth magnet exports declined 74% year-over-year in May 2025 to 1.2 million kilograms, adding further pressure on global supply chains.
Logistics disruptions are also increasing project costs and delaying virtual production infrastructure deployment. According to UNCTAD’s Review of Maritime Transport 2025, Red Sea shipping disruptions added 10–14 transit days, while the Shanghai Containerized Freight Index averaged 2,496 points in 2024, representing a 149% year-on-year increase.
Regional Analysis
North America dominated the global Virtual Production Market in 2025, accounting for approximately 38.1% of the market share and generating around USD 1.0 billion in revenue. The region’s leadership is supported by its strong entertainment ecosystem, advanced technology infrastructure, and presence of major film and media companies.
The United States remains the key contributor, with leading studios such as Netflix, Amazon Studios, Walt Disney Studios, Warner Media, and Viacom CBS adopting virtual production technologies, including LED volume stages, real-time rendering, and AI-enabled previsualization tools.
The adoption of real-time rendering platforms, including Unreal Engine and Unity, across more than 1,200 North American productions in 2025 highlights the region’s strong technology adoption. With an expected CAGR of 20.4% through 2035, North America is projected to maintain its leading position in virtual production innovation and adoption.
Asia Pacific is expected to be the fastest-growing region in the Virtual Production Market, driven by increasing streaming demand, expanding entertainment industries, and rising investments in digital production infrastructure across China, India, Japan, and South Korea.
Key Regions and Countries
North America
- US
- Canada
Europe
- Germany
- France
- The UK
- Spain
- Italy
- Rest of Europe
Asia Pacific
- China
- Japan
- South Korea
- India
- Australia
- Rest of APAC
Latin America
- Brazil
- Mexico
- Rest of Latin America
Middle East & Africa
- GCC
- South Africa
- Rest of MEA
Key Players Analysis
The Virtual Production Market competitive landscape is led by a group of Tier-1 technology providers that define core platforms, hardware capabilities, and workflow standards, while Tier-2 companies compete through specialized solutions such as motion capture, camera tracking, virtual environments, and production services. Major players including NVIDIA, Epic Games, Adobe, Autodesk, and Disney/Pixar hold strong influence due to their advanced technology ecosystems and large-scale investments.
NVIDIA provides the high-performance computing foundation for virtual production through RTX platforms and Omniverse, supported by USD 130.5 billion in FY25 revenue and approximately USD 12.9 billion in R&D investment, strengthening its role in real-time rendering and LED volume applications.
Epic Games continues to drive adoption of Unreal Engine for in-camera VFX and virtual sets, supported by a USD 1,850 per-seat annual subscription for non-gaming users, a USD 1.5 billion investment from Disney, and an ecosystem of 898 million accounts.
Adobe strengthens the post-production segment with USD 21.51 billion FY24 revenue and USD 3.94 billion in R&D spending, integrating tools such as Premiere, After Effects, and Frame.io into professional workflows. Autodesk supports content creation through Maya, Flame, Arnold, and Autodesk Flow, backed by USD 6.13 billion FY25 revenue.
Top Key Players in the Market
- Adobe
- Arashi Vision Inc. (Insta 360)
- Autodesk Inc.
- BORIS FX, INC
- Epic Games, Inc.
- HTC Corporation (VivePort)
- HumanEyes Technologies
- Mo-Sys Engineering Ltd.
- NVIDIA Corporation.
- Panocam3d.com
- Pixar (The Walt Disney Company)
- Side Effects Software Inc (SideFX)
- Technicolor
- Vicon Motion Systems Ltd
- Other Key Players
Recent Developments
- In June 2026, TransPerfect consolidated MPC and The Mill into a single global virtual production and VFX studio under The Mill brand, combining Technicolor’s former film and episodic VFX arm with The Mill’s commercial and experiential operations.
- In July 2025, Absen and Versatile Media launched the world’s largest monolithic LED virtual production volume in Deqing, China. The facility features a 270° curved LED wall measuring 50 meters in diameter and 12 meters high, with a 5,000 m² facility footprint and approximately 1,700 m² of LED display surface, expanding high-end virtual production capabilities across Asia.
Report Scope
| Report Features | Description |
|---|---|
| Market Value (2025) | USD 2.6 Billion |
| Forecast Revenue (2035) | USD 24.7 Billion |
| CAGR (2026-2035) | 25.4% |
| Base Year for Estimation | 2025 |
| Historic Period | 2020-2024 |
| Forecast Period | 2026-2035 |
| Report Coverage | Revenue Forecast, Market Dynamics, Competitive Landscape, Recent Developments |
| Segments Covered | By Offering (Hardware, Software, Services), By Type (Pre-production, Production, Post-production), By End Use (Commercial Ads, Movies, Online Videos, TV Series, Broadcasting Studios, Others) |
| Regional Analysis | North America – US, Canada; Europe – Germany, France, The UK, Spain, Italy, Rest of Europe; Asia Pacific – China, Japan, South Korea, India, Australia, Singapore, Rest of APAC; Latin America – Brazil, Mexico, Rest of Latin America; Middle East & Africa – GCC, South Africa, Rest of MEA |
| Competitive Landscape | Adobe, Arashi Vision Inc. (Insta360), Autodesk Inc., BORIS FX, INC, Epic Games, Inc., HTC Corporation (VivePort), HumanEyes Technologies, Mo-Sys Engineering Ltd., NVIDIA Corporation, Panocam3d.com, Pixar (The Walt Disney Company), Side Effects Software Inc. (SideFX), Technicolor, Vicon Motion Systems Ltd, Other Key Players. |
| Customization Scope | Customization for segments and region/country-level will be provided. Moreover, additional customization can be done based on the requirements. |
| Purchase Options | We have three licenses to opt for: Single User License, Multi-User License (Up to 5 Users), Corporate Use License (Unlimited Users and Printable PDF) |





























