
Quick Navigation
Report Overview
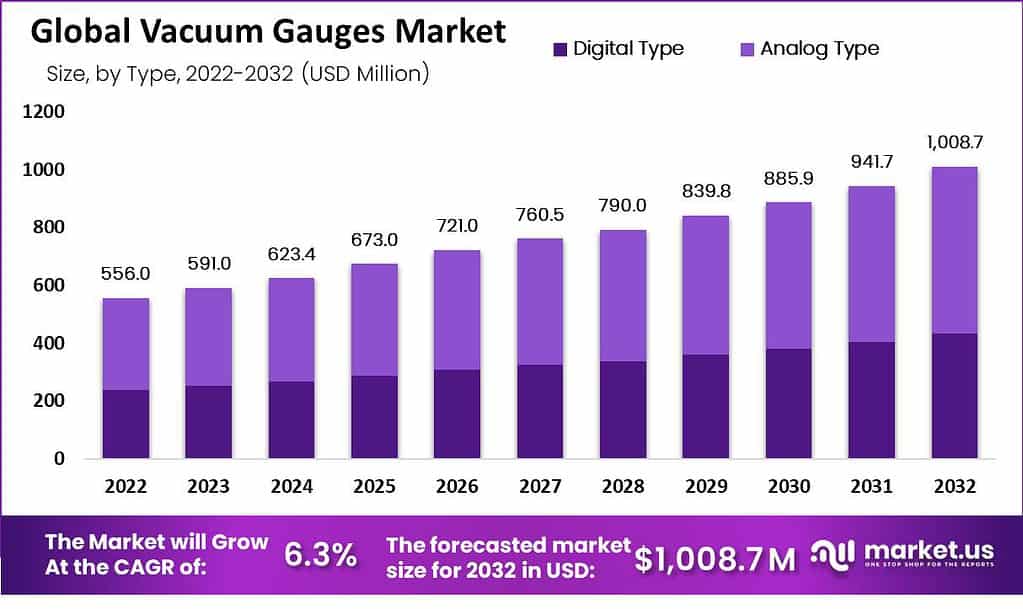
The Global Vacuum Gauges Market is projected to grow at a CAGR of 6.3%, with its worth expected to increase from USD 556 Mn in 2023 to approximately USD 1,008.7 Mn by 2033.
Vacuum gauges are devices used to accurately gauge the pressure of gasses relative to atmospheric pressure. The Vacuum Gauges Market is currently experiencing notable growth, primarily attributed to the expanding applications of vacuum technology across various industries. This growth can be attributed to several key factors, and the outlook for the market remains cautiously optimistic.
They have applications in many industries including power, petrochemical, metallurgical and transportation sectors. They can be divided into digital or analog types and classified according to application (power industry, petrochemical industry, metallurgical industry measurement military machinery/equipment laboratory transportation).
Note: Actual Numbers Might Vary In The Final Report
Key Takeaways
- Market Growth: The Global Vacuum Gauges Market is expected to grow at a CAGR of 6.3%, reaching approximately USD 1,008.7 million by 2033 from USD 556 million in 2023.
- Types of Vacuum Gauges: The market is segmented into Digital Type and Analog Type Vacuum Gauges. Digital Type holds a dominant market share of over 57.2%, driven by technological advancements and data-driven benefits.
- Advantages of Digital Type: Digital vacuum gauges offer real-time, easy-to-interpret digital readouts, simplifying measurement processes. They also provide data storage and retrieval, contributing to process control and automation.
- Analog Type Vacuum Gauges: While representing a smaller portion of the market, analog gauges are valued for their reliability and simplicity, making them suitable for specific applications.
- Applications: The Power Industry is a dominant force in the Vacuum Gauges market, ensuring efficient and reliable operation in power generation, including renewable energy sources.
- Petrochemical Industry: Vacuum gauges play a crucial role in maintaining quality and safety standards in various petrochemical applications.
- Metallurgical Industry: Vacuum gauges are essential for precise pressure control in metallurgical processes.
- Measurement and Other Segments: Vacuum gauges are indispensable in laboratories, military machinery, transportation, and specialized settings.
- Drivers: The market is driven by the increasing demand for vacuum technology in semiconductor manufacturing, the healthcare industry, and the shift towards sustainable technologies.
- Challenges: High initial investment costs for vacuum systems and the complexity of maintenance are some challenges faced by the market.
- Opportunities: Emerging markets in India and China, as well as the rising demand for natural and organic products, present growth opportunities for the vacuum gauge market.
- Regional Analysis: North America, Europe, Asia-Pacific, and the Middle East & Africa contribute to the market’s growth, with diverse regional dynamics.
- Key Market Players: Major companies in the vacuum gauge market include Ametek, OMEGA Engineering, Nuova Fima, SKF, Festo, Baumer, WIKA, Atlas Copco, and others.
Type Analysis
In 2023, the Vacuum Gauges market saw a notable segmentation between two distinct types: Digital Type and Analog Type. These segments provide valuable insights into the market dynamics, catering to the diverse preferences of industry professionals and stakeholders.
Digital Type Vacuum Gauges emerged as the frontrunner, holding a dominant market position by capturing more than a 57.2% share. This substantial market share can be attributed to the ever-evolving technological landscape and the increasing demand for precision and accuracy in vacuum measurements.
The Digital Type Vacuum Gauges offer several advantages that have resonated with consumers. Firstly, they provide real-time, digital readouts that are easy to interpret, eliminating the need for manual calculations. This feature simplifies the measurement process, making it more accessible to a broader user base.
Furthermore, the convenience of data storage and retrieval in digital gauges has been a significant selling point. Users can easily access historical data, track trends, and analyze vacuum performance over time. This functionality enhances process control and contributes to the overall efficiency of industrial operations.
Additionally, the adoption of digital technology aligns with the growing trend towards automation and Industry 4.0 in various sectors. Manufacturers and research institutions are increasingly relying on integrated systems, where digital vacuum gauges seamlessly interface with other equipment, contributing to streamlined processes and data-driven decision-making.
On the other hand, Analog Type Vacuum Gauges, while representing a smaller portion of the market, continue to hold their ground. These gauges are preferred in specific applications where simplicity and cost-effectiveness are paramount. Analog gauges provide a visual representation of vacuum levels through traditional dial displays. They are valued for their reliability and ease of use, particularly in environments where digital infrastructure may not be readily available.
By Application
In 2023, the Vacuum Gauges market exhibited a diversified landscape with various applications driving demand and shaping the industry’s dynamics. Among these segments, the Power Industry emerged as a dominant force, capturing a significant share of the market.
The Power Industry, in particular, held a commanding market position in 2023, securing a substantial share. This prominence can be attributed to the industry’s pivotal role in power generation, transmission, and distribution. Vacuum gauges play a critical role in ensuring the efficient and reliable operation of power plants and related infrastructure.
One of the key factors contributing to the Power Industry’s dominance is the need for precise vacuum measurements in various power generation methods. Whether in thermal power plants, hydroelectric facilities, or nuclear reactors, maintaining optimal vacuum levels is paramount to enhance equipment performance and safety.
Furthermore, the transition towards cleaner and more sustainable energy sources has bolstered the demand for vacuum gauges in the Power Industry. Renewable energy installations, such as wind turbines and solar power systems, rely on vacuum technology for optimal operation. Accurate vacuum measurements are vital in maintaining the integrity of vacuum-insulated panels and ensuring the efficiency of energy storage systems.
The Petrochemical Industry also played a substantial role in the Vacuum Gauges market. This industry is known for its stringent quality and safety standards, and vacuum gauges are essential tools for monitoring and controlling vacuum processes in various petrochemical applications. From distillation columns to vacuum distillation units, these gauges ensure precise pressure management, contributing to product quality and operational safety.
Metallurgical Industry, while representing a smaller portion of the market share, remained a significant segment. Vacuum gauges find extensive use in metallurgical processes, such as vacuum induction melting and vacuum heat treatment, where precise pressure control is essential for achieving desired material properties.
The Measurement segment, encompassing various precision instruments and scientific equipment, also contributed to the market. In laboratories and research facilities, vacuum gauges are indispensable for experiments, material testing, and vacuum chambers used in various scientific disciplines.
The Military Machinery, Laboratory, Transportation, and Other segments each carved out their niche in the Vacuum Gauges market. These segments cater to specific applications where vacuum measurements are crucial, whether in military equipment, analytical instruments, transportation systems, or other specialized settings.
Drivers
- Increasing Demand for Semiconductor Manufacturing: The vacuum gauge market is witnessing significant growth due to the rising demand for vacuum technology in semiconductor manufacturing processes.
- Expanding Healthcare Industry: The healthcare sector’s reliance on vacuum technology for various applications, such as medical devices and research, is boosting the demand for vacuum gauges.
- Environmental Concerns: The shift towards green and sustainable technologies has led to increased adoption of vacuum technology in processes like solar cell manufacturing.
Restraints
- High Initial Investment: One of the key challenges in the vacuum gauge market is the high initial capital required for setting up vacuum systems. This can deter potential market entrants. The initial setup costs can range from $50,000 to $1 million or more, depending on the application.
- Complex Maintenance: Vacuum systems can be complex to maintain, requiring skilled technicians and regular servicing. This adds to the overall cost of ownership for businesses.
Opportunities
- Emerging Markets: The vacuum gauge market has promising opportunities in emerging economies like India and China. These countries are witnessing rapid industrialization and increased investment in technology.
- Rising Demand for Natural Products: The trend towards natural and organic products has created opportunities for vacuum technology in food processing and packaging.
Challenges
- Technological Advancements: Vacuum technology is constantly evolving, and staying updated with the latest innovations can be a challenge for businesses. Keeping up with advancements is crucial to remain competitive.
- Regulatory Compliance: Meeting stringent regulatory standards, particularly in industries like pharmaceuticals and aerospace, can be a challenge. Non-compliance can result in costly setbacks.
Key Market Segments
By Type
- Digital Type
- Analog Type
By Application
- Power Industry
- Petrochemical Industry
- Metallurgical Industry
- Measurement
- Military Machinery
- Laboratory
- Transportation
- Other
Regional Analysis
The growth of this market can be attributed to a multitude of factors. North America has emerged as a prominent hub for vacuum gauge adoption, with a substantial market share. This can be attributed to the robust presence of industries requiring vacuum measurement solutions, such as semiconductor manufacturing and aerospace. Meanwhile, the European market exhibits a steady trajectory, driven by the automotive and pharmaceutical sectors.
Asia-Pacific, with its burgeoning industrial landscape, is poised for substantial growth, projected to register a CAGR over the next 10 years. Furthermore, the Middle East and Africa, though currently holding a smaller market share, are anticipated to witness notable expansion due to increasing industrialization. In conclusion, the vacuum gauges market shows promising prospects, with diverse regional dynamics contributing to its overall growth.
Furthermore, the Middle East and Africa, though currently holding a smaller market share, are anticipated to witness notable expansion due to increasing industrialization. In conclusion, the vacuum gauges market shows promising prospects, with diverse regional dynamics contributing to its overall growth.
Key Regions and Countries Covered in this Report
- North America
- The US
- Canada
- Europe
- Germany
- France
- The UK
- Spain
- Italy
- Russia
- Netherland
- Rest of Europe
- APAC
- China
- Japan
- South Korea
- India
- Australia
- New Zealand
- Singapore
- Thailand
- Vietnam
- Rest of APAC
- Latin America
- Brazil
- Mexico
- Rest of Latin America
- Middle East & Africa
- South Africa
- Saudi Arabia
- UAE
- Rest of MEA
Key Market Players
- Ametek
- OMEGA Engineering
- Nuova Fima
- SKF
- Festo
- Baumer
- WIKA
- Atlas Copco
- Shcroft
- GRAINGER
- Goetze KG
- Stewarts-USA
- Stewarts
- Fluke
- Weiyida
- Tecsis
- MicroWatt
- Adarsh Industries
- Lutron Electronic Enterprise
- Beijing Constable Instrument Technology
- Shaanxi Creat Wit Technology
- Shanghai Ying Yu Industrial
Report Scope
| Report Features | Description |
|---|---|
| Market Value (2023) | US$ 556 Mn |
| Forecast Revenue (2033) | US$ 1,008.7 Mn |
| CAGR (2023-2032) | 6.3% |
| Base Year for Estimation | 2023 |
| Historic Period | 2017-2022 |
| Forecast Period | 2024-2033 |
| Report Coverage | Revenue Forecast, Market Dynamics, COVID-19 Impact, Competitive Landscape, Recent Developments |
| Segments Covered | By Type (Digital Type, Analog Type), By Application (Power Industry, Petrochemical Industry) |
| Regional Analysis | North America – The U.S. & Canada; Europe – Germany, France, The UK, Spain, Italy, Russia, Netherlands & Rest of Europe; APAC- China, Japan, South Korea, India, Australia, New Zealand, Singapore, Thailand, Vietnam & Rest of APAC; Latin America- Brazil, Mexico & Rest of Latin America; Middle East & Africa- South Africa, Saudi Arabia, UAE & Rest of MEA |
| Competitive Landscape | Ametek, OMEGA Engineering, Nuova Fima, SKF, Festo, Baumer, WIKA, Atlas Copco, Shcroft, GRAINGER, Goetze KG, Stewarts-USA, Stewarts, Fluke, Weiyida, Tecsis, MicroWatt, Adarsh Industries, Lutron Electronic Enterprise, Beijing Constable Instrument Technology, Shaanxi Creat Wit Technology, Shanghai Ying Yu Industrial |
| Customization Scope | Customization for segments, region/country-level will be provided. Moreover, additional customization can be done based on the requirements. |
| Purchase Options | We have three licenses to opt for Single User License, Multi-User License (Up to 5 Users), Corporate Use License (Unlimited User and Printable PDF) |
Frequently Asked Questions (FAQ)
Vacuum gauges are instruments used to measure and monitor the level of vacuum or pressure in various industrial processes. They are essential for ensuring the proper functioning of equipment and maintaining optimal conditions.
The growth of the Vacuum Gauges Market can be attributed to factors such as the expansion of the manufacturing sector, increasing demand for semiconductor manufacturing, and the need for precise vacuum measurements in research and development.
The Global Vacuum Gauges Market is projected to grow at a CAGR of 6.3%, with its worth expected to increase from USD 556 Mn in 2023 to approximately USD 1,008.7 Mn by 2033.
Industries such as semiconductor manufacturing, aerospace, pharmaceuticals, and automotive heavily rely on vacuum gauges to maintain quality control, optimize processes, and ensure product reliability.


