


Report Overview
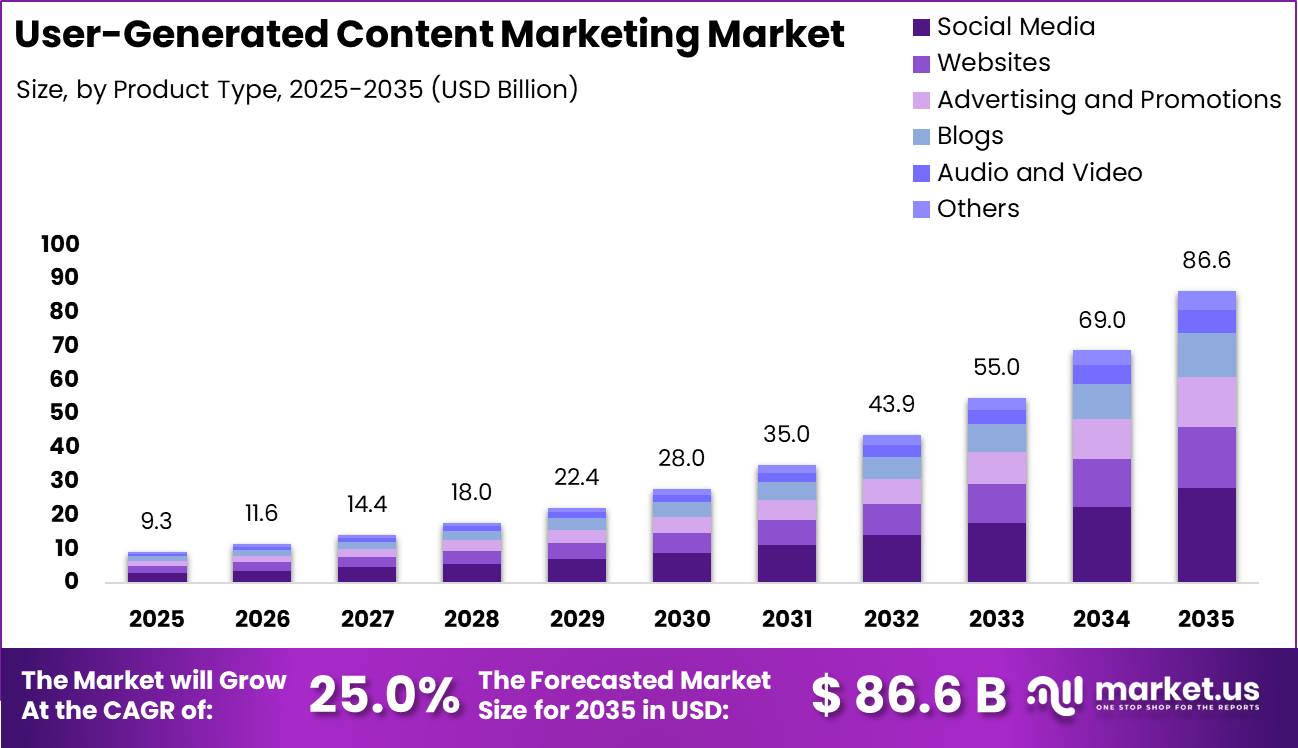
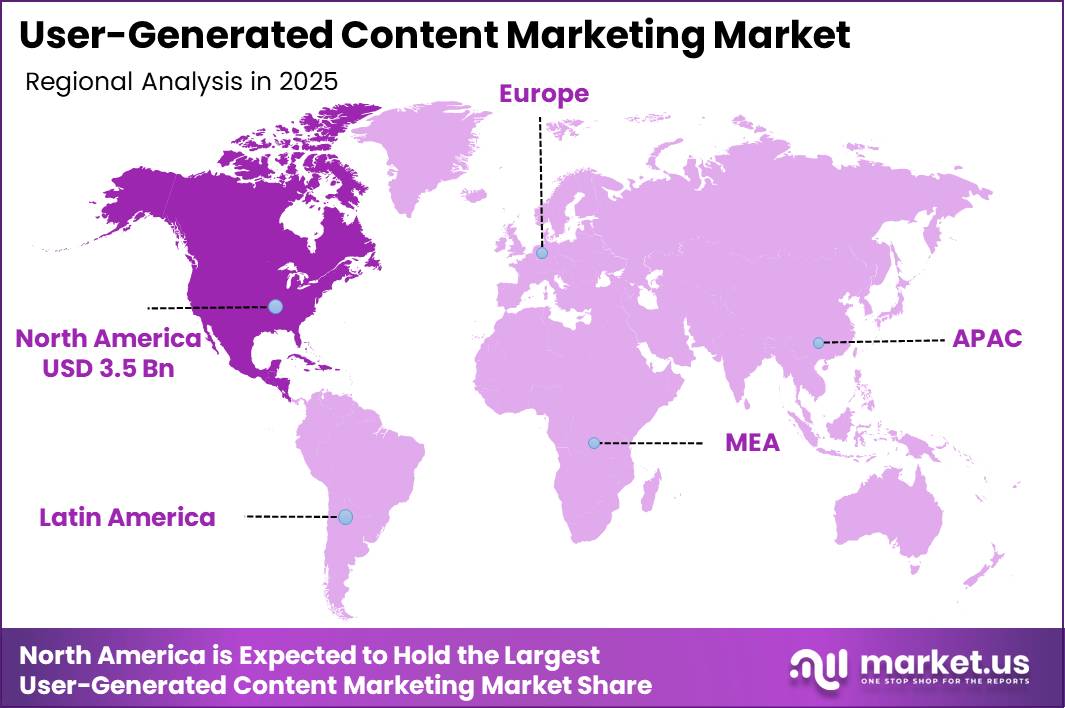
In 2025, the User-Generated Content (UGC) Marketing Market was valued at USD 9.3 billion. The market is projected to grow at a CAGR of 25.0% during 2026–2035, reaching approximately USD 86.6 billion by 2035. North America dominated the global market in 2025, accounting for more than 37.7% of the total market share and generating approximately USD 3.5 billion in revenue.
According to the International Telecommunication Union (ITU), around 6 billion people, representing 74% of the world’s population, were using the internet in 2025, compared with 60% in 2020, adding nearly 1.3 billion new users within five years. This rapid growth has expanded the global base of social media users, creators, and online communities that generate user-driven content.
Global digital advertising spending reached approximately USD 650 billion in 2025, with North America accounting for nearly 37% of total spending, highlighting the region’s strong investment in digital customer engagement channels where UGC plays a major role. As social platforms continue to serve more than 5 billion users globally, brands are increasingly adopting UGC strategies to improve customer trust, engagement, and campaign performance.
The growing connection between internet adoption, digital advertising expansion, and demand for authentic brand interactions is expected to accelerate investment in UGC marketing platforms, creator partnerships, and content management solutions. This trend supports the market’s growth from USD 9.3 billion in 2025 to approximately USD 86.6 billion by 2035, while North America is expected to maintain its leading position due to its strong digital advertising ecosystem.
Key Takeaway
- The Global User-Generated Content Marketing Market was valued at USD 9.3 billion in 2025 and is projected to reach USD 86.6 billion by 2035, expanding at a CAGR of 25.0%.
- Social Media dominated the market by product type, accounting for 32.6% share, driven by the growing adoption of social platforms for brand engagement, customer interactions, and content-driven marketing campaigns.
- Social Media & Community Campaigns emerged as the leading marketing use case, capturing 28.4% share, supported by increasing brand investments in community building and user-driven content strategies.
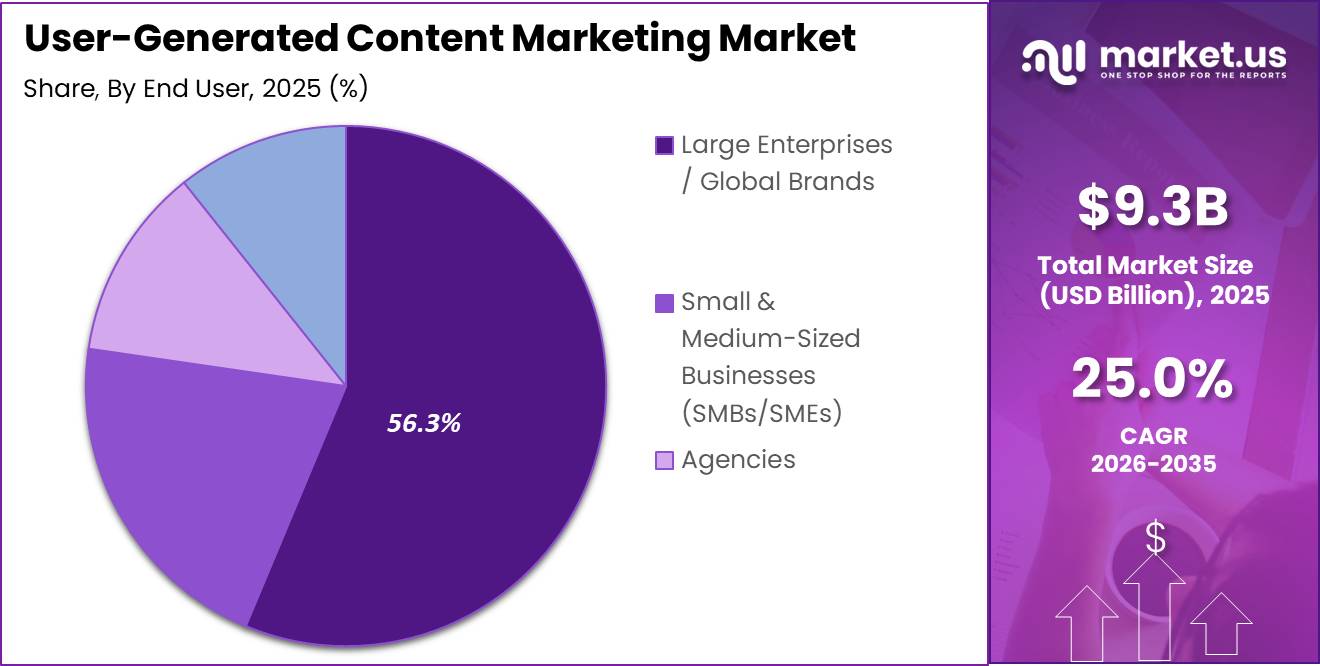
- Large Enterprises / Global Brands held the largest share by end user at 56.3%, as major brands increasingly leverage UGC to improve customer trust, engagement, and brand visibility.
- Retail & E-Commerce was the leading vertical segment, accounting for 23.1% share, driven by the rising influence of customer reviews, product ratings, and social commerce initiatives.
- North America dominated the global User-Generated Content Marketing Market with a 37.7% share, valued at approximately USD 3.5 billion, supported by advanced digital marketing adoption and the presence of major technology platforms.
Product Type
The Social Media segment dominated the User-Generated Content (UGC) Marketing Market in 2025, accounting for approximately 32.6% of the total market share. The segment leads due to the massive scale of social platforms, which provide brands with continuous access to user-created photos, videos, reviews, and short-form content.
The strong growth of digital advertising is further supporting social media-based UGC adoption. Global online advertising spending is projected to reach around USD 678.7 billion in 2025, with social media formats gaining a larger share due to high user engagement, advanced targeting capabilities, and measurable campaign performance.
Marketing Use Case
The Social Media & Community Campaigns segment dominated the User-Generated Content (UGC) Marketing Market in 2025, accounting for 28.4% of the total market share. The segment’s leading position is supported by the large-scale reach and high engagement levels offered by social platforms. In 2025, around 6 billion people, representing 74% of the global population, were online, creating a strong base for UGC creation, sharing, and audience interaction.
Social media platforms capture a significant share of digital activity, with users spending approximately 2 hours 20–25 minutes per day on social networks, accounting for more than one-third of total online time. This high level of engagement increases opportunities for brands to leverage customer reviews, creator content, comments, and community discussions for marketing campaigns.
End User
Large Enterprises / Global Brands dominate the end-user segment of the User-Generated Content (UGC) Marketing Market, accounting for approximately 56.3% of segment revenues due to their strong control over global advertising budgets, digital commerce activities, and large-scale customer engagement programs. In 2024, global advertisers spent around USD 1.1 trillion on advertising, with digital channels accounting for 72.7% and more than USD 790 billion of total spending.
As digital purchasing and product discovery continue expanding, brands increasingly depend on customer reviews, ratings, creator content, and community interactions to influence buying decisions. Large enterprises are better positioned to implement UGC platforms, content approval systems, rights management processes, and multi-channel campaigns due to their operational scale and resources.
By Vertical
Retail & E-Commerce dominates the vertical segment of the User-Generated Content (UGC) Marketing Market, accounting for 23.1% of the market share. The segment leads because UGC has a direct impact on consumer purchasing decisions, particularly as shopping activities continue shifting toward digital platforms.
The continued growth of e-commerce and digital shopping has increased competition among retailers, creating greater demand for authentic customer experiences and peer recommendations. As brands and marketplaces focus on improving customer acquisition and retention, they are increasingly investing in UGC platforms, social commerce solutions, and creator partnerships.
Key Market Segments
By Product Type
- Social Media
- Websites
- Advertising and Promotions
- Blogs
- Audio and Video
- Others
By Marketing Use Case
- Influencer & Creator Collaborations
- Social Media & Community Campaigns
- Product Reviews & Rating Campaigns
- Hashtag & Contest‑Driven Campaigns
- Others
By End User
- Large Enterprises / Global Brands
- Small & Medium‑Sized Businesses (SMBs/SMEs)
- Agencies
- Individual Creators & Influencers
By Vertical
- Beauty & Cosmetics
- Fashion & Apparel
- Fitness & Wellness
- Food & Beverages
- Retail & E-Commerce
- Travel & Hospitality
- Others
Drivers
| Driver | (~) % Impact on CAGR | Geographic Relevance | Impact Timeline |
|---|---|---|---|
| Consumer Trust Deficit in Traditional Advertising | +4.8% | Global — North America, Western Europe, Southeast Asia | Short term (≤ 2 years) |
| Social Commerce & Shoppable UGC Integration | +3.9% | Global — Asia-Pacific leads at ~72% market share; North America accelerating | Short term (≤ 2 years) |
| AI-Powered UGC Curation & Personalization Tooling | +3.2% | Global — North America, Western Europe, East Asia | Medium term (2–4 years) |
| Rising Customer Acquisition Cost (CAC) Pressure on Brands | +2.6% | Global — particularly high in North America & UK direct-to-consumer verticals | Short term (≤ 2 years) |
| Mobile-First Internet Penetration in Emerging Markets | +2.1% | South Asia, Southeast Asia, Sub-Saharan Africa, Latin America | Medium term (2–4 years) |
| Platform Algorithm Prioritization of Authentic User Content | +1.7% | Global — TikTok, Instagram, YouTube ecosystems | Short term (≤ 2 years) |
The structural collapse of confidence in brand-produced advertising is the single most powerful demand engine in the UGC Marketing Market today. Independent consumer behavior research consistently places organic trust in peer-created content at 92% versus conventional advertising, and products with UGC on their pages demonstrate a 29% higher conversion rate than equivalent pages without it figures grounded in platform-level A/B data from major e-commerce operators reviewed through 2024–2025.
UGC videos retain viewer attention for 10× longer on average than brand-produced equivalents, directly compressing the cost-per-engaged-view metric that CMOs use to justify content spend. From a business model standpoint, this trust differential is already forcing a reallocation of brand media budgets.
Global paid social CPMs climbed by over 30% between 2022 and 2025 on Meta and TikTok platforms, making studio-produced ad creative increasingly prohibitive versus UGC-style creator content costing as little as $50–$200 per video from new-to-mid-tier creators, per marketplace rate data.
The commercial impact is tangible: brands deploying structured UGC programs across product detail pages and social feeds are documenting engagement lifts of 28% above brand-created content baselines, with conversion uplifts of 53% after accumulating as few as 10 verified reviews on new SKUs compressing time-to-revenue for product launches and directly improving return on ad spend (ROAS) in an environment where paid inventory costs continue to escalate.
Restraints
| Restraint | (~) % Impact on CAGR | Geographic Relevance | Impact Timeline |
|---|---|---|---|
| Multi-Jurisdictional Data Privacy & Consent Regulation | -3.4% | European Union, United Kingdom, Indonesia (PDP Law), Brazil (LGPD), India (DPDP Act) | Short term (≤ 2 years) |
| Intellectual Property & Copyright Ambiguity on UGC Reuse | -2.1% | Global — acute in the US, EU, and common-law jurisdictions | Medium term (2–4 years) |
| AI-Generated Content Diluting Perceived UGC Authenticity | -1.8% | Global — highest consumer skepticism in North America & Western Europe | Short term (≤ 2 years) |
| Platform Policy Fragmentation Limiting Cross-Channel Rights Portability | -1.3% | Global — US, EU, Asia-Pacific | Short term (≤ 2 years) |
| Budget Concentration Risk in Macro-Sensitive SMB Segment | -0.9% | North America, Western Europe | Medium term (2–4 years) |
The simultaneous tightening of data privacy regimes across the five largest UGC consumption jurisdictions is the most structurally consequential restraint suppressing market velocity today. The EU’s GDPR, now in its seventh enforcement year, has been materially tightened through 2024–2025 via stricter cookie consent standards requiring prior explicit permission before any non-essential cookie fires, eliminating implied and scroll-based consent mechanisms that UGC personalization engines routinely relied upon.
Indonesia’s Personal Data Protection Law completed its two-year grace period in October 2024, activating enforcement across the fourth-most-populous UGC market globally. India’s Digital Personal Data Protection Act passed in 2023 and moved toward rulemaking through 2025, creating legal uncertainty for UGC platforms processing the data of over 800 million internet users.
The operational cost is direct: deploying compliant Consent Management Platforms (CMPs) across a multi-market stack runs $40,000–$250,000 annually for mid-market brands, and mandatory Data Protection Impact Assessments (DPIAs) for AI-driven UGC curation pipelines add legal review cycles of 4–12 weeks per major product iteration.
For UGC marketing vendors, the consequence is a bifurcated product architecture EU-compliant and non-EU that raises development costs by an estimated 15–25% of SaaS platform engineering budgets, delays international feature parity, and constrains the behavioral data pools that AI curation models require to deliver the personalization uplift brands are paying for, directly suppressing platform expansion economics and new logo acquisition rates in the highest-ARPU geographies.
Challenges
| Challenge | (~) % CAGR Friction Drag | Geographic Relevance | Mitigation Horizon |
|---|---|---|---|
| UGC Content Quality & Brand Safety Moderation | -2.7% | Global — most acute in high-volume markets: US, India, Brazil, Indonesia | Long term (≥ 4 years) |
| Creator Supply Concentration & Fatigue | -1.9% | North America, Western Europe, developed Asia-Pacific | Medium term (2–4 years) |
| UGC Attribution & ROI Measurement Gap | -1.6% | Global — most friction in enterprise and mid-market segments | Medium term (2–4 years) |
| Talent Scarcity in UGC Strategy Roles | -1.2% | Global — concentrated in North America, UK, Germany, Australia | Long term (≥ 4 years) |
| Platform Algorithm Volatility & Dependency Risk | -1.0% | Global | Long term (≥ 4 years) |
The structural challenge of programmatically ensuring that brand-amplified UGC does not carry hate speech, misinformation, competitor brand references, unauthorized third-party IP, or product liability exposure is the deepest operational friction dampening the market’s maximum growth ceiling.
At scale, platforms processing millions of pieces of daily UGC face a compounding moderation throughput problem: human review costs approximately $0.05–$0.15 per content item in low-cost offshore labor markets, scaling to $0.50–$2.00 in onshore quality review tiers at 10 million pieces per day; this produces a moderation cost floor of $500,000–$1.5 million daily before any AI augmentation.
Automated AI moderation reduces per-unit cost by 60–80% but introduces false-positive suppression rates of 3–8%, which at volume means thousands of brand-safe, high-performing pieces of content are incorrectly quarantined per day, degrading campaign yield and creator satisfaction simultaneously.
From a systemic risk standpoint, brand safety incidents a single viral misuse event, a harassment incident linked to a brand’s UGC campaign, or an inadvertent promotion of a regulated product can trigger advertiser pullbacks of 20–40% of quarterly spend, as documented repeatedly across social platform earnings disclosures between 2022 and 2025.
Opportunities
| Opportunity | (~) % Potential CAGR | Geographic Relevance | Execution Window |
|---|---|---|---|
| UGC-Native Social Commerce Monetization Layer | +5.2% | Global — Asia-Pacific first-mover; North America & India high-velocity | Short term (≤ 2 years) |
| B2B Enterprise UGC Adoption (Peer Reviews, Case Studies, Testimonial Automation) | +3.1% | North America, Western Europe, ANZ | Medium term (2–4 years) |
| Emerging Market Vernacular UGC Infrastructure | +2.8% | India, Indonesia, Nigeria, Brazil, Vietnam | Medium term (2–4 years) |
| UGC Licensing & IP Marketplace Development | +1.9% | Global — US, UK, EU regulatory clarity zones | Medium term (2–4 years) |
| AI-Assisted UGC for LLM Training & Search Visibility | +1.6% | Global — North America, East Asia | Long term (≥ 4 years) |
| Immersive & Voice UGC Formats (AR, Spatial, Podcast Reviews) | +1.2% | North America, East Asia, Western Europe | Long term (≥ 4 years) |
This opportunity is explicitly untapped at scale because the UGC Marketing Market has historically operated as a trust and awareness layer generating engagement and conversion lift on third-party e-commerce destinations rather than as a direct transactional infrastructure.
The addressable white space is significant: the global social commerce market is valued at approximately $1.9 trillion in 2026, growing at a CAGR of 37.4%, with Asia-Pacific accounting for 72% of current volume yet the specialized UGC marketing software layer sitting above this commerce infrastructure represents a market of under $12 billion, implying a monetization capture ratio of under 1% of the transactional value it enables.
India’s social commerce market alone is projected to reach $114 billion in 2026, and UGC-first platforms such as Meesho and regional short-video commerce operators are demonstrating that vernacular, peer-created content can reduce customer acquisition cost by 35–55% versus paid inventory in price-sensitive tier-2 and tier-3 city cohorts.
Geopolitical Impact Analysis
Geopolitical tensions are creating cost pressures for User-Generated Content (UGC) Marketing platforms by increasing infrastructure, technology, and logistics expenses across the digital marketing ecosystem. UGC platforms rely on cloud infrastructure, GPUs, data centers, and global technology supply chains to support content processing, recommendations, analytics, and creator management tools.
According to WTO tariff data, average applied MFN tariffs on electrical machinery and equipment (HS 85), which includes servers, storage, and networking equipment, are around 3–4% globally, while additional U.S.–China tariffs of 10–25% on various Chinese electronics have increased costs for technology infrastructure. The IMF estimates that severe trade fragmentation and friend-shoring could reduce global GDP by up to 4.6%, highlighting the broader impact of rising cross-border service costs.
Supply chain disruptions are also impacting the physical components used in advanced UGC campaigns, including edge servers, networking equipment, creator hardware, and event-based content systems. UNCTAD reported that Red Sea and Suez Canal disruptions added approximately 12 additional sailing days on Shanghai–Rotterdam routes, while Suez trade volumes declined by around 50% year-over-year in the first two months of 2024 due to shipping diversions.
Container demand recovered by 7.1% in 2024, but freight volatility remained elevated. Energy price fluctuations further contribute to higher transportation and operational costs, with Brent crude prices moving from around USD 94 per barrel in September 2023 to USD 78 per barrel in December 2023. These combined pressures may increase infrastructure costs, service pricing, and operational expenses for UGC marketing providers and their enterprise customers.
Regional Analysis
North America dominated the User-Generated Content (UGC) Marketing Market in 2025, accounting for approximately 37.7% of the global market share and generating around USD 3.5 billion in revenue. The region’s leading position is supported by its advanced digital infrastructure, high social media adoption, and well-established ecosystem of content creators, influencers, brands, and technology providers.
Companies across the United States and Canada are increasingly using UGC strategies to improve brand engagement, strengthen customer trust, and enhance marketing performance. The adoption of AI-powered content analysis, moderation tools, and marketing analytics platforms is further enabling brands to manage and scale personalized UGC campaigns effectively.
Asia Pacific is expected to be the fastest-growing region in the UGC Marketing Market, driven by rapid digital transformation, increasing smartphone adoption, expanding e-commerce activities, and growing social media engagement.
Key Regions and Countries
North America
- US
- Canada
Europe
- Germany
- France
- The UK
- Spain
- Italy
- Rest of Europe
Asia Pacific
- China
- Japan
- South Korea
- India
- Australia
- Rest of APAC
Latin America
- Brazil
- Mexico
- Rest of Latin America
Middle East & Africa
- GCC
- South Africa
- Rest of MEA
Key Players Analysis
The User-Generated Content (UGC) Marketing Market is characterized by competition between large social and video platforms that monetize creator content at global scale and specialized SaaS providers that help brands manage, collect, and activate UGC across marketing channels.
Leading platforms such as Meta, Alphabet’s YouTube, and ByteDance benefit from massive user bases, advertising ecosystems, and AI-driven content recommendation systems, while companies such as Bazaarvoice and Yotpo focus on enterprise UGC management solutions.
Meta remains one of the largest players in UGC-driven marketing, generating approximately USD 131.9 billion in advertising revenue in 2023, representing 97.8% of total revenue and growing 16.1% year over year.
The company reported 28% growth in ad impressions, while average ad prices declined 9%, reflecting its strategy of expanding advertising scale through high-volume user-generated content platforms. Enterprise-focused platforms are strengthening their position by providing tools for reviews, ratings, customer photos, and social commerce integration. Bazaarvoice supports more than 6,200 brand and retailer websites, where over one billion consumers interact monthly with UGC content.
Top Key Players in the Market
- Bazaarvoice
- CrowdRiff
- Curalate, Inc.
- Monotype Imaging Inc.
- Olapic Inc.
- Pancake Laboratories, Inc.
- Pixlee TurnTo
- Stackla Pty Ltd.
- TINT
- Yotpo Ltd
- Others
Recent Developments
- In May 2026, Emplifi, an Audax Group portfolio company, announced the full integration of Pixlee TurnTo, a UGC, ratings and reviews, and influencer marketing platform, into its unified customer experience stack. The acquisition expanded Emplifi’s UGC capabilities by adding more than 1,000 brands and over 10 million SKU-linked UGC assets across global commerce channels.
- In March 2026, Bazaarvoice highlighted its acquisition-led platform expansion strategy, integrating solutions such as Influenster, Curalate, affable.ai, and Granify to strengthen community-driven content, visual commerce, creator marketing, and AI-powered e-commerce personalization capabilities.
Report Scope
| Report Features | Description |
|---|---|
| Market Value (2025) | USD 9.3 Billion |
| Forecast Revenue (2035) | USD 86.6 Billion |
| 25.0 (2026-2035) | 25.0% |
| Base Year for Estimation | 2025 |
| Historic Period | 2020-2024 |
| Forecast Period | 2026-2035 |
| Report Coverage | Revenue Forecast, Market Dynamics, Competitive Landscape, Recent Developments |
| Segments Covered | By Product Type (Social Media, Websites, Advertising and Promotions, Blogs, Audio and Video, Others), By Marketing Use Case (Influencer & Creator Collaborations, Social Media & Community Campaigns, Product Reviews & Rating Campaigns, Hashtag & Contest-Driven Campaigns, Others), By End User (Large Enterprises / Global Brands, Small & Medium-Sized Businesses (SMBs/SMEs), Agencies, Individual Creators & Influencers), By Vertical (Beauty & Cosmetics, Fashion & Apparel, Fitness & Wellness, Food & Beverages, Retail & E-Commerce, Travel & Hospitality, Others) |
| Regional Analysis | North America – US, Canada; Europe – Germany, France, The UK, Spain, Italy, Rest of Europe; Asia Pacific – China, Japan, South Korea, India, Australia, Singapore, Rest of APAC; Latin America – Brazil, Mexico, Rest of Latin America; Middle East & Africa – GCC, South Africa, Rest of MEA |
| Competitive Landscape | Bazaarvoice, CrowdRiff, Curalate, Inc., Monotype Imaging Inc., Olapic Inc., Pancake Laboratories, Inc., Pixlee TurnTo, Stackla Pty Ltd., TINT, Yotpo Ltd, Others. |
| Customization Scope | Customization for segments and region/country-level will be provided. Moreover, additional customization can be done based on the requirements. |
| Purchase Options | We have three licenses to opt for: Single User License, Multi-User License (Up to 5 Users), Corporate Use License (Unlimited Users and Printable PDF) |





























