


Report Overview
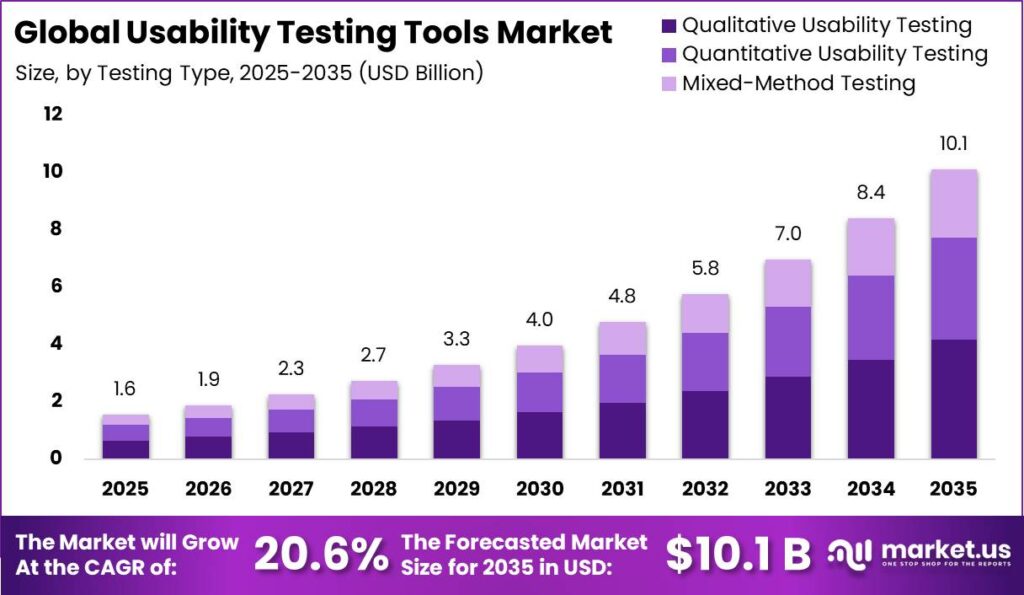
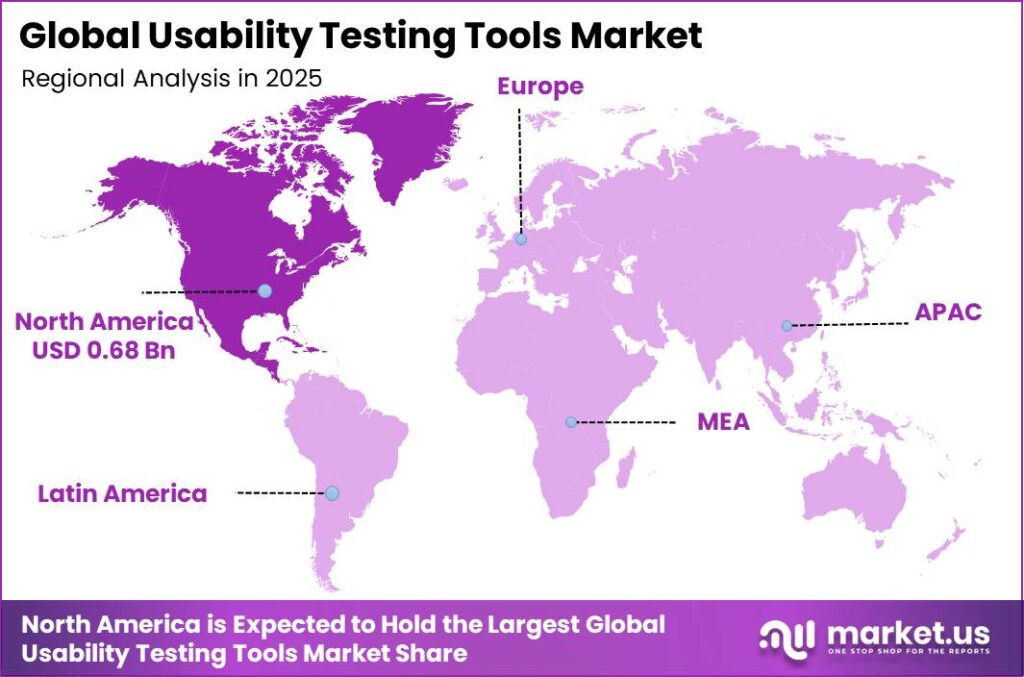
In 2025, the Global Usability Testing Tools Market was valued at USD 1.6 billion. The market is projected to grow at a CAGR of 20.6% during 2026–2035, reaching approximately USD 10.1 billion by 2035. North America dominated the global market in 2025, accounting for more than 43.5% of the total market share and generating approximately USD 0.68 billion in revenue.
According to the International Telecommunication Union (ITU), global internet users reached about 5.5 billion in 2024, covering roughly 68% of the world’s population, which sharply increases the number of people interacting with websites, apps, and digital services that must be tested for ease of use before launch and during updates.
The World Bank notes that digital technologies and AI are now core to productivity and public service delivery, pushing both governments and enterprises to roll out more digital platforms that must meet clear usability standards to avoid user drop‑off, complaints, and compliance risks.
Data based on the U.S. Census Bureau and industry compilations show that the U.S. software publishing industry alone generates on the order of USD 500–650 billion in annual revenue, illustrating the huge base of software and digital products that require continuous usability testing across web, mobile, SaaS, and enterprise systems.
International sources summarizing IDC estimates indicate that worldwide digital transformation spending is in the trillions of dollars and that North America accounts for around 40–45% of that spend, reflecting very high investment in user‑centric digital experiences and experimentation.
Key Takeaway
- The Global Usability Testing Tools Market was valued at USD 1.6 billion in 2025 and is projected to reach USD 10.1 billion by 2035, growing at a 20.6% CAGR during 2026–2035.
- Moderated Usability Testing Tools led the tool type segment with a 36.4% market share in 2025.
- Qualitative Usability Testing held the largest testing type share at 41.2% in 2025.
- Cloud-Based Platforms dominated the deployment mode segment, capturing 72.1% of the market in 2025.
- Website Usability Testing accounted for the highest application share at 38.6% in 2025.
- IT & Software Companies emerged as the largest end-user segment with a 45.3% market share in 2025.
- Large Enterprises led by organization size, accounting for 60.4% of the market in 2025.
- Remote Testing was the leading testing method, representing 54.8% of the market in 2025.
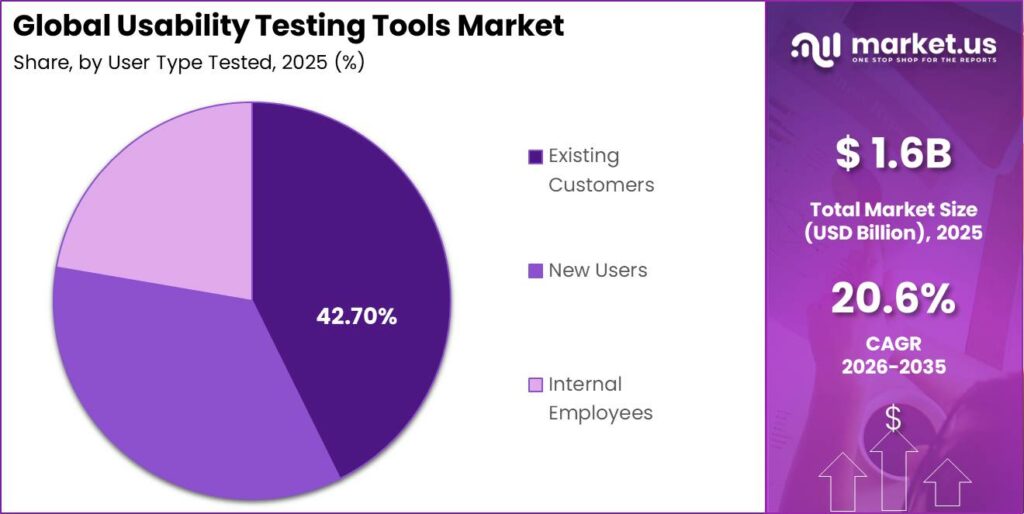
- Existing Customers constituted the largest user type tested, contributing 42.7% of the market in 2025.
- North America dominated the global market in 2025, accounting for more than 43.5% of the total market share and generating approximately USD 0.68 billion in revenue.
By Tool Type
Moderated Usability Testing Tools held a dominant market position, capturing more than a 36.40% share. Teams keep using moderated sessions because watching and talking with users often reveals issues that analytics alone miss; one compilation of UX findings notes that fixing usability problems found through direct research can remove up to 80% of user‑reported issues before launch.
In 2025 and 2026, many UX teams scheduled moderated interviews in months like April and October to review major redesigns, and this practice aligned with the broader trend that 43% of teams tracked UX impact through KPIs in 2025, rising to 56% in 2026, reinforcing structured moderated testing as a primary tool type.
This supports broader UX trends where about 71% of teams in 2025 were exploring AI and machine learning in design contexts, using automation to process feedback and prioritize changes. Automated tools also help simulate user journeys, which is valuable when teams want to test dozens of alternative flows without recruiting new participants each time.
By Testing Type
Qualitative Usability Testing held a significant share of the market in 2025 because product teams rely on detailed user stories to understand why tasks feel easy or difficult. UX research summaries note that 70% of digital projects still fail to meet user expectations, and qualitative work is often what reveals emotional reactions and trust issues behind these failures.
Analysts highlight that observing and talking with a small number of participants can uncover about 80% of serious usability problems, making qualitative approaches highly efficient for early‑stage design decisions. In 2025 and 2026, many organizations tied qualitative testing to key roadmap checkpoints in months such as January and July, using sessions to refine concepts before quantitative experiments.
Quantitative Usability Testing is emerging as a fast-growing segment in 2025 as teams push for statistically grounded decisions that they can share with stakeholders. UX statistic reports show that every 1 unit invested in user experience can generate roughly 100 units in return, and organizations are eager to back that claim with measurable improvements in task completion and conversion rates.
In 2025, around 43% of teams reported tracking KPIs and OKRs to measure the impact of UX research, and this share climbed to 56% in 2026, illustrating how data‑linked usability work is becoming mainstream. Teams now monitor metrics such as average time on key tasks, percentage of successful completions and post‑task satisfaction ratings, often reviewing these numbers monthly.
By Deployment Mode
Cloud-based platforms held a dominant market position, capturing more than a 72.1% share as usability testing shifted decisively into browser-based tools. Cloud services make it easier to run studies with users in different regions, and UX statistics show that 75% of all website traffic flows through a single major search engine, so teams need platforms that can test experiences for broad audiences at scale.
Cloud deployment also supports multi-device testing, which matters in a world where average desktop page load times cluster around 2.5 seconds and mobile pages can take 8.6 seconds; usability teams use these tools to validate how real users respond to varying speed and layout conditions.
Hybrid Deployment is emerging as a fast-growing segment in 2025 because organizations want flexibility while still following strict data rules. Many companies operate in sectors where user information is sensitive, and UX trend reports highlight that accessibility and privacy considerations are now central topics, with accessibility alone cited as a priority by about 55% of teams in 2025.
By End User
IT and Software Companies held a dominant market position, capturing more than a 45.3% share because they build and maintain many digital products. UX labor and job outlook data show that roles related to web development and UX design are projected to grow at double-digit rates, which reflects sustained demand for better interfaces in software.
E-commerce and retail are emerging as a fast-growing segment in 2025 as more shopping shifts online, and users compare experiences across multiple brands. Website load time statistics show that average pages load in around 1.9 seconds on mobile for main content, yet users often expect faster responses, and slow performance can quickly reduce willingness to buy.
By Organization Size
Large Enterprises held a dominant market position, capturing more than a 60.4% share because they manage broad portfolios of digital channels. UX statistics show that organizations with well-structured user experience practices can see conversion improvements of up to 400% compared with basic designs, which makes usability testing integral to large-scale digital strategies.
They therefore track UX metrics such as task success rates and satisfaction scores to monitor how experiences evolve. In 2025, 43% of teams reported tracking UX impact through KPIs and OKRs, and by 2026 this rose to 56%, with much of that growth driven by larger organizations that formalized research programs.
By Application
Website Usability Testing held a dominant market position, capturing more than a 38.6% share. This segment stayed central because website speed and clarity directly shape user behavior: nearly 47% of users expect a page to load in two seconds or less, and many will abandon a site that feels slow or confusing.
Research on load time shows that improving key speed metrics, such as Largest Contentful Paint, by around 31% can lift sales by roughly 8%, which is a strong practical reason for continuous usability checks on navigation and page structure.
UX statistics also indicate that a well-designed interface can increase conversion rate by up to 200%, while good overall user experience can push conversion improvements toward 400%, so teams apply usability testing to menus, forms, and checkout flows to reach those gains.
Studies of mobile application success show that less than 5% of all mobile apps become genuinely successful, which pushes teams to use usability testing to find and fix friction in onboarding and key journeys early. Usage data suggests that the average person interacts with about 26 apps per month, so every confusing flow or cluttered screen increases the risk that users will switch to a rival service.
By Testing Method
Remote Testing held a dominant market position, capturing more than a 54.8% share as research moved beyond physical labs. Remote methods allow teams to observe users in natural environments, and UX statistics highlight that real-world conditions such as variable bandwidth and device differences strongly influence satisfaction.
UX trend summaries also note that 71% of teams in 2025 were exploring AI and machine learning in design work, with part of that interest focused on using automation to sort and interpret research data.
By User Type Tested
Existing Customers held a dominant market position, capturing more than a 42.7% share in user type testing because they provide insights from regular, long-term use. UX statistics emphasize that retaining existing users is generally more efficient than acquiring new ones, and satisfied customers are more likely to recommend products and services, so understanding their experience is vital.
As UX trend reports continue to show that better experiences drive loyalty and long-term value, testing with existing customers stays central to usability programs and helps organizations maintain strong relationships with their most engaged user base.
Key Market Segments
By Tool Type
- Moderated Usability Testing Tools
- AI-Powered Automated Usability Testing
- Unmoderated Testing Platforms
- Heatmap & Session Replay Tools
- A/B Testing & Experimentation Tools
By Testing Type
- Qualitative Usability Testing
- Quantitative Usability Testing
- Mixed-Method Testing
By Deployment Mode
- Cloud-Based Platforms
- On-Premises Tools
- Hybrid Deployment
By Application
- Website Usability Testing
- Mobile App Usability Testing
- Enterprise Software Testing
- E-commerce UX Optimization
- Game & Digital Product Testing
By End User
- IT & Software Companies
- E-commerce & Retail
- BFSI
- Media & Entertainment
- Healthcare
By Organization Size
- Large Enterprises
- SMEs
By Testing Method
- Remote Testing
- In-Person Testing
- Automated AI Testing
By User Type Tested
- Existing Customers
- New Users
- Internal Employees
Geopolitical Impact Analysis
Escalating geopolitical tensions are exerting direct cost and timing pressure on the usability testing tools market by inflating the price and elongating the lead times of the underlying cloud infrastructure, high‑end electronics, and data‑center hardware these SaaS platforms depend on.
Following successive tariff rounds, average effectively applied tariffs globally have risen from about 7.5% in 2017 to roughly 9% by 2024, with WTO economists estimating that 20 to 30% of global goods trade is now affected by some form of new restriction, particularly in electronics and ICT‑related categories, which form the backbone of remote usability testing setups, device farms, and lab equipment.
Higher duties on semiconductors, networking equipment, and servers are flowing through into 3 to 6% increases in landed costs for cloud data‑center infrastructure and edge devices used to run cross‑device testing environments, forcing vendors to either compress margins or pass on mid‑single‑digit subscription price hikes to enterprise customers.
UNCTAD and the World Shipping Council have highlighted that re‑routing around high‑risk areas has added 10 to 20 days to some Asia–Europe and Asia–US East Coast container routes, translating into 15 to 25% higher spot freight rates on affected lanes and driving up the cost base of servers, monitors, and test devices shipped to data centers and usability labs.
Regional Analysis
North America currently dominates the Usability Testing Tools Market, accounting for approximately 43.5% of global revenues, equivalent to about USD 0.68 billion, supported by a mature digital ecosystem and a high concentration of technology enterprises, SaaS vendors, and digital-first brands.
The region benefits from early adoption of advanced UX practices, significant investment in product analytics, and strong presence of leading usability testing tool providers, which collectively reinforce its position as the primary revenue-generating market.
Asia Pacific is positioned as the fastest-growing region in the Usability Testing Tools Market, driven by rapid digitalization, expansion of mobile-first economies, and a surge in online retail, fintech, and super-app ecosystems. Rising internet and smartphone penetration, coupled with a growing base of digital-native consumers, is compelling enterprises across markets such as India, China, Southeast Asia, and Australia to invest in structured UX research and usability testing platforms.
Key Regions and Countries
North America
- US
- Canada
Europe
- Germany
- France
- The UK
- Spain
- Italy
- Rest of Europe
Asia Pacific
- China
- Japan
- South Korea
- India
- Australia
- Rest of APAC
Latin America
- Brazil
- Mexico
- Rest of Latin America
Middle East & Africa
- GCC
- South Africa
- Rest of MEA
Market Dynamics
Drivers
| Driver | (~) % CAGR | Geographic Relevance | Impact Timeline |
|---|---|---|---|
| Enterprise shift to continuous UX research | +3.0% | North America, Europe, Asia-Pacific | Short term (≤ 2 years) |
| Remote and unmoderated testing adoption | +2.5% | Europe, North America | Short term (≤ 2 years) |
| Design system and product analytics integration | +2.0% | Global | Medium term (2–4 years) |
| Growth of product-led and SaaS-native companies | +1.8% | North America, Asia-Pacific | Medium term (2–4 years) |
| Increased coverage of digital privacy laws | +1.5% | Europe, North America, select APAC | Short term (≤ 2 years) |
| Expansion of specialized UX roles | +1.2% | Global tier‑one tech hubs | Long term (≥ 4 years) |
Enterprise shift to continuous UX research
Across large product organizations, the move from episodic lab-based usability testing toward continuous, sprint-aligned UX research is driving an incremental uplift of roughly 3.0 percentage points on top of the baseline CAGR as teams institutionalize always-on feedback loops and embed usability tools directly into their design and delivery workflows.
Over the 2024–2026 window, many digital-first enterprises have expanded UX research budgets by between 15% and 30% annually, with leading product organizations running upwards of 50–100 usability sessions per quarter per flagship product, compared with fewer than 10 per quarter in traditional, campaign-driven models two years prior.
As these teams standardize remote testing on live sites, prototypes, and mobile flows, they push adoption of subscription-based usability platforms that can support multi-team seat counts in the high hundreds, converting previously project-based spending into recurring SaaS contracts with average per-seat annual spend often in the low four-digit range and multi-product bundles lifting contract values by 20%–40% versus standalone tools.
Restraints
| Restraint | (~) % CAGR | Geographic Relevance | Impact Timeline |
|---|---|---|---|
| High cost sensitivity among SMEs | -2.5% | Global, pronounced in emerging markets | Short term (≤ 2 years) |
| Complex procurement and security reviews | -1.8% | North America, Europe | Short term (≤ 2 years) |
| Stringent cross-border data transfer rules | -1.6% | Europe, cross-Atlantic flows | Medium term (2–4 years) |
| Limited UX maturity outside digital-native sectors | -1.5% | Latin America, Middle East, parts of Asia | Medium term (2–4 years) |
| Budget compression from macro uncertainty | -1.3% | Global | Short term (≤ 2 years) |
| Fragmentation across teams and tools | -1.2% | Global enterprises | Long term (≥ 4 years) |
High cost sensitivity among SMEs
Among small and mid-sized organizations, the upfront and subscription costs of advanced usability testing platforms act as a structural brake that subtracts an estimated 2.5 percentage points from the otherwise achievable CAGR, with industry assessments indicating that cost concerns limit adoption for roughly 30% of potential smaller users who continue to rely on manual testing or free tools.
When typical per-seat licenses for professional usability platforms run into high three- to low four-digit annual amounts and full-team bundles can consume 5%–10% of an SME’s entire digital product budget, many organizations either cap their user counts to a handful of researchers or postpone purchases altogether, especially in markets facing higher borrowing costs and tighter working capital.
This price elasticity forces vendors to discount aggressively in the SME segment, compressing gross margins by an estimated 3–5 percentage points compared with enterprise contracts and extending payback periods on sales and onboarding costs from under 12 months for large accounts to closer to 18–24 months for smaller ones.
Challenges
| Challenge | (~) % CAGR | Geographic Relevance | Mitigation Horizon |
|---|---|---|---|
| Data privacy-compliant workflows | -2.8% | Europe, North America | Medium term (2–4 years) |
| AI result explainability in testing | -2.4% | Global | Long term (≥ 4 years) |
| Participant recruitment quality at scale | -2.0% | Global | Medium term (2–4 years) |
| Integration complexity with analytics stacks | -1.9% | Global enterprises | Medium term (2–4 years) |
| Shortage of senior UX research talent | -1.7% | North America, Europe | Long term (≥ 4 years) |
| Vendor lock-in and change-management risk | -1.5% | Global | Long term (≥ 4 years) |
Data privacy-compliant workflows
The proliferation of modern data privacy frameworks, with regulatory analyses indicating that by 2024 roughly 75% of the world’s population is covered by contemporary privacy laws, creates a structural vulnerability for usability testing workflows that depresses the market’s maximum attainable growth by an estimated 2.8 percentage points as vendors and clients struggle to operationalize compliant practices for session recordings, behavioral telemetry, and cross-border data flows.
These requirements add non-trivial unit costs such as incremental per-user storage and encryption expenses, privacy operations staff overhead that can add the equivalent of several full-time compliance roles per large enterprise, and engineering efforts that divert 10%–15% of development capacity toward governance features rather than pure product innovation.
Opportunities
| Opportunity | (~) % CAGR | Geographic Relevance | Execution Window |
|---|---|---|---|
| AI-augmented unmoderated testing suites | +3.2% | Europe, North America | Medium term (2–4 years) |
| Verticalized solutions for regulated industries | +2.7% | Global | Long term (≥ 4 years) |
| Integrated participant panels and incentives | +2.3% | Global | Medium term (2–4 years) |
| Partner ecosystems with design and analytics tools | +2.0% | Global enterprises | Medium term (2–4 years) |
| Expansion into emerging digital economies | +1.9% | Asia-Pacific, Latin America, Middle East | Long term (≥ 4 years) |
| Outcome-based pricing and value metrics | +1.6% | North America, Europe | Medium term (2–4 years) |
AI-augmented unmoderated testing suites
The emerging wave of AI-augmented unmoderated usability platforms represents a distinct, forward-looking opportunity rather than a current baseline driver, with focused investment and productization able to unlock an estimated additional 3.2 percentage points of CAGR upside by automating insight extraction, expanding test volumes, and materially improving unit economics compared with today’s largely manual analysis workflows.
If vendors can reduce per-study analyst time by 40%–60%, lower participant recruitment and incentive costs per completed test by 15%–25% through better targeting and automated quality screening, and maintain high-quality, explainable outputs compliant with evolving AI oversight rules.
Key Players Analysis
The usability testing tools market is characterized by a small cluster of Tier‑1 leaders with scaled SaaS revenues above USD 150 million, surrounded by Tier‑2 challengers and niche UX analytics specialists with sub‑USD 100 million run‑rates but aggressive funding‑backed expansion.
UserTesting, now combined with UserZoom under Thoma Bravo ownership, anchors the Tier‑1 cohort: before going private, UserTesting reported quarterly revenues of USD 45.9–47.6 million in 1Q–2Q 2022 (USD ~180–190 million annualized), with subscription revenue accounting for over USD 43 million per quarter and growing more than 40% year‑on‑year, positioning it as one of the few pure‑play experience‑research platforms at close to 10–12% of the global usability testing tools market, depending on whether the segment is sized at USD 1.5–2.2 billion.
The 2022 take‑private transaction by Thoma Bravo and Sunstone Partners valued UserTesting at approximately USD 1.3 billion, implying a revenue multiple in the 7–8x range and establishing it as the consolidation platform for UX research; this was followed by the announced merger with UserZoom in early 2026, which strategically combines moderated testing, panel access, and in‑product UX analytics in an end‑to‑end suite, materially reinforcing its Tier‑1 status and likely expanding combined market share into the mid‑teens.
Contentsquare/Clicktale, Hotjar, and other behavior‑analytics vendors form a second Tier‑1 cluster focused on quantitative UX telemetry rather than panel‑based testing, but with strong overlap in digital experience optimization budgets. Contentsquare, which acquired Clicktale in 2019, has raised around USD 1.4–1.8 billion in equity and debt rounds, including a USD 600 million growth investment in a 2022 Series F (USD 400 million equity plus USD 200 million debt), supporting global expansion to roughly 1.3k enterprise customers and a workforce of approximately 1.8k employees.
Although recent estimates indicate revenue volatility (around USD 300 million in 2023 versus much lower levels in 2024 in one dataset), this still places Contentsquare in a similar revenue band to UserTesting, with its digital experience analytics segment plausibly capturing high‑single‑digit share of the broader usability and UX optimization spend, particularly in North America, which accounts for about 32% of usability testing tools revenues (USD ~0.48 billion on a USD 1.51 billion global base in 2024).
Top Key Players in the Market
- UserTesting
- Hotjar
- Crazy Egg
- Lookback
- Maze
- Optimal Workshop
- Trymata
- UsabilityHub
- PlaybookUX
- FullStory
- Adobe
- Microsoft
- Smartlook
- Contentsquare
Recent Developments
- In January 2026, UserTesting announced the acquisition of User Interviews, a leading participant recruitment platform for user and market research, adding a panel of over 2 million opted-in participants and automating incentives and screening workflows for thousands of research teams globally.
- In January 2026, Thoma Bravo and Sunstone Partners completed their all‑cash acquisition of UserTesting, Inc., valuing the company at approximately 1.3 billion USD and taking it private to accelerate product innovation and go‑to‑market for its video‑based human insight and usability testing platform across web and mobile customer journeys.
- In July 2026, Microsoft announced Topic Insights as a new AI visibility capability within Microsoft Clarity, enabling teams to quantify how often their domains are cited in AI‑generated answers, track share of authority across topics, and surface prioritized optimization opportunities.
Report Scope
| Report Features | Description |
|---|---|
| Market Value (2025) | USD 1.6 Billion |
| Forecast Revenue (2035) | USD 10.1 Billion |
| CAGR (2026-2035) | 20.6% |
| Base Year for Estimation | 2025 |
| Historic Period | 2020-2024 |
| Forecast Period | 2026-2035 |
| Report Coverage | Revenue Forecast, Market Dynamics, Competitive Landscape, Recent Developments |
| Segments Covered | By Tool Type (Moderated Usability Testing Tools, AI-Powered Automated Usability Testing, Unmoderated Testing Platforms, Heatmap & Session Replay Tools, A/B Testing & Experimentation Tools), By Testing Type (Qualitative Usability Testing, Quantitative Usability Testing, Mixed-Method Testing), By Deployment Mode (Cloud-Based Platforms, On-Premises Tools, Hybrid Deployment), By Application (Website Usability Testing, Mobile App Usability Testing, Enterprise Software Testing, E-commerce UX Optimization, Game & Digital Product Testing), By End User (IT & Software Companies, E-commerce & Retail, BFSI, Media & Entertainment, Healthcare), By Organization Size (Large Enterprises, SMEs), By Testing Method (Remote Testing, In-Person Testing, Automated AI Testing), By User Type Tested (Existing Customers, New Users, Internal Employees) |
| Regional Analysis | North America – US, Canada; Europe – Germany, France, The UK, Spain, Italy, Rest of Europe; Asia Pacific – China, Japan, South Korea, India, Australia, Singapore, Rest of APAC; Latin America – Brazil, Mexico, Rest of Latin America; Middle East & Africa – GCC, South Africa, Rest of MEA |
| Competitive Landscape | UserTesting, Hotjar, Crazy Egg, Lookback, Maze, Optimal Workshop, Trymata, UsabilityHub, PlaybookUX, FullStory, Adobe, Google, Microsoft, Smartlook, Contentsquare |
| Customization Scope | Customization for segments, region/country-level will be provided. Moreover, additional customization can be done based on the requirements. |
| Purchase Options | We have three licenses to opt for: Single User License, Multi-User License (Up to 5 Users), Corporate Use License (Unlimited Users and Printable PDF) |





























