
US Billiards Equipment Market By Product Type (Tables, Cues, Balls, Others), By End-Use (Commercial, Residential, and Professional), By Distribution Channel (Online and Offline), By Region and Companies - Industry Segment Outlook, Market Assessment, Competition Scenario, Trends and Forecast 2024-2034
- Published date: April 2025
- Report ID: 145626
- Number of Pages: 340
- Format:
-
keyboard_arrow_up
Quick Navigation
Report Overview
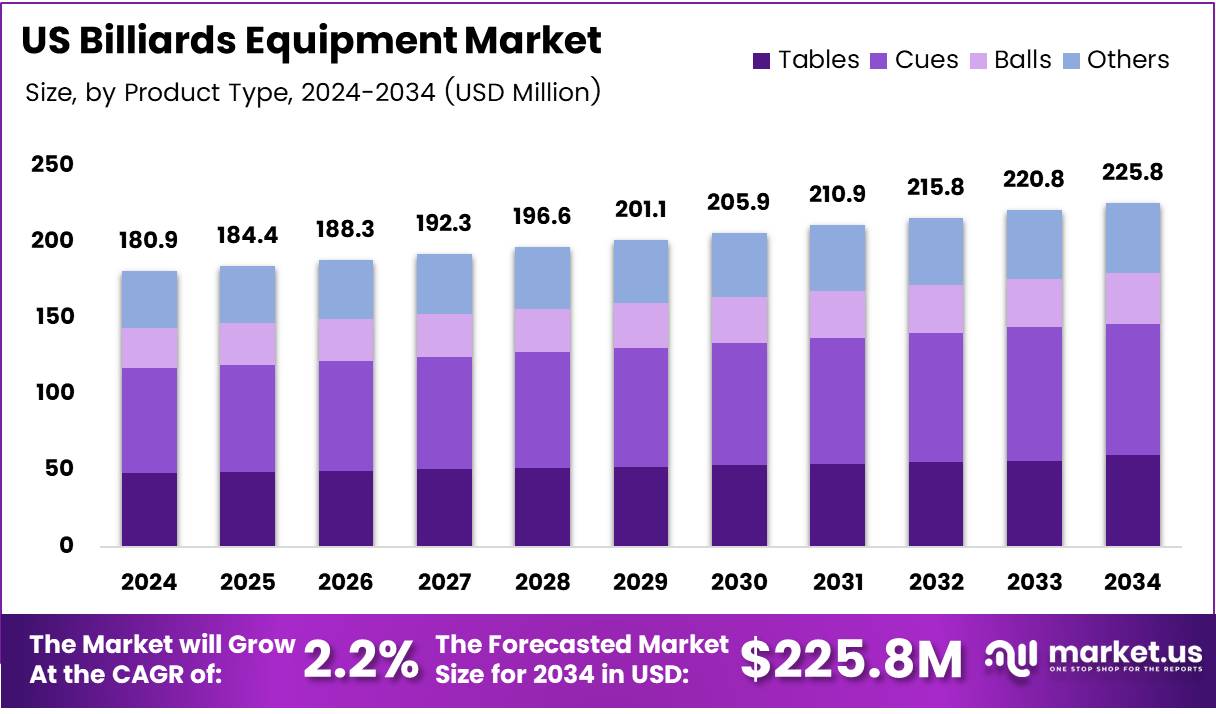
The US Billiards Equipment Market size is expected to be worth around USD 225.8 Million by 2034, from USD 180.9 Million in 2024, growing at a CAGR of 2.2% during the forecast period from 2025 to 2034.
The market for American billiards tables spans multiple sectors, including gaming and entertainment hubs, sports training centers, luxury resorts, and private game rooms. In the United States, the demand for high-end billiards tables continues to grow, supported by the expanding indoor gaming culture, the rise of upscale hospitality venues, and the increasing popularity of professional pool tournaments.
The U.S. billiards equipment market has seen steady growth, driven by both recreational players and professional enthusiasts. The market includes a wide range of products, such as pool tables, cues, balls, racks, and accessories, catering to homes, clubs, and commercial establishments. Increased interest in home entertainment and sports, alongside the rise of competitive billiards, has positively impacted demand.
Additionally, technological innovations in design and materials have enhanced the performance and durability of equipment. The market is competitive, with several well-established brands and a growing presence of specialized retailers and online platforms offering a broad selection to consumers.
Key Takeaways:
- The US billiards equipment market is valued at US$ 180.9 million in 2024 and is estimated to register a CAGR of 2.2%.
- The US billiards equipment market is projected to reach US$ 225.8 million by 2034.
- In the US billiards equipment market, cues held the majority of revenue share in 2024 of 9%.
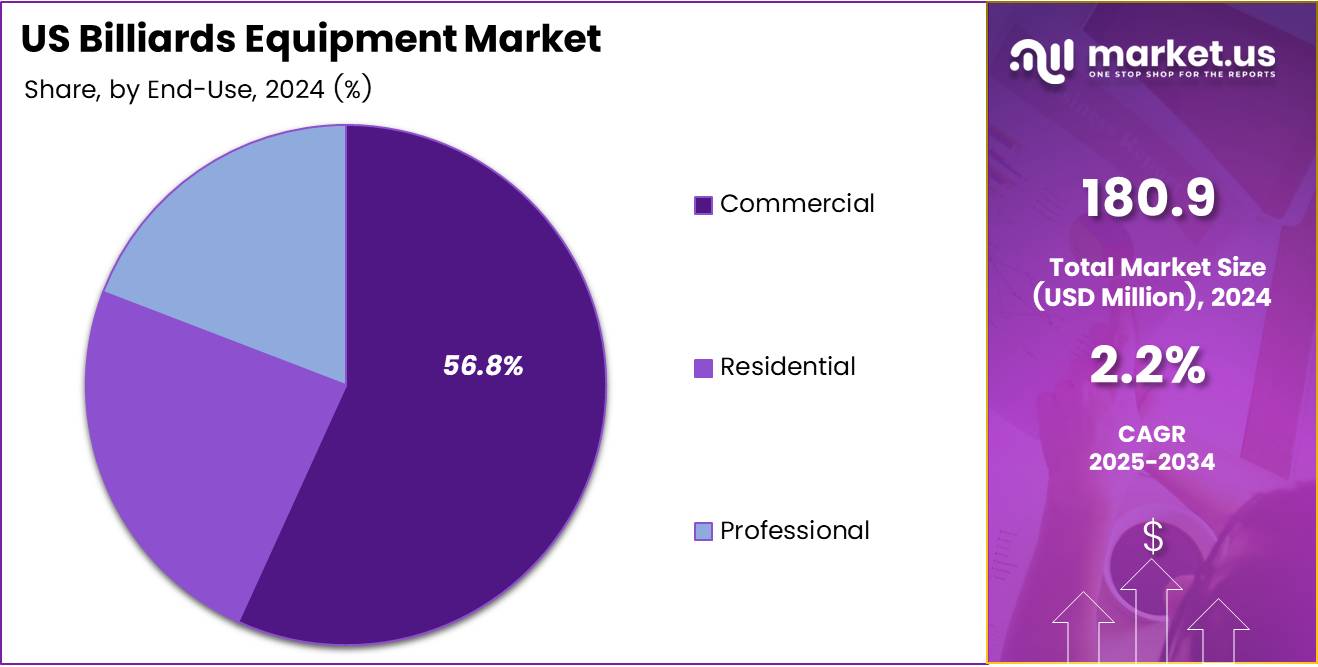
- Among end-use, commercial sectors accounted for the majority of the market share, with 8%.
- Among distribution channels of billiards equipment, offline accounted for the largest market share in 2024, with 8%.
- The South US region was the major consumer of billiards equipment and hence it held the largest market share of 3%.
US Billiards Equipment Market Scope
Product Type Analysis
Cues Accounted For The Largest Market Share
The US billiards equipment market is segmented based on product type into tables, cues, balls, and others. Among these, cues held the majority of revenue share in 2024 of 37.9%, due to several key factors that make cues essential for both casual and competitive players. Cues are at the heart of the game, and no game of pool or billiards can be played without them.
The demand for cues is not only driven by their central role in gameplay but also by the wide variety of options available to meet different player preferences. High-quality cues made from premium materials, such as maple wood, carbon fiber, or fiberglass, are in demand, especially among professional players and enthusiasts who seek superior performance, comfort, and durability.
Additionally, cues come in a range of styles, weights, and designs, allowing players to personalize their equipment based on their skill level, play style, and aesthetic preferences, which further drives sales. The rise in professional billiards tournaments and increasing interest in cue sports as a hobby has led to more frequent purchases of specialized and customized cues.
Furthermore, cues generally have a higher price point compared to accessories like balls and racks, contributing to their larger revenue share. These factors, coupled with the strong brand loyalty and recognition of top cue manufacturers, significantly boost the market’s overall revenue.
The US Billiards Equipment Market, By Product Type, 2020-2024 (USD Mn)
Product Type 2020 2021 2022 2023 2024 Tables 46.2 46.7 47.2 47.7 48.4 Cues 62.8 63.9 65.4 67.0 68.6 Balls 25.2 25.4 25.8 26.3 26.6 Others 35.5 35.8 36.1 36.6 37.2 End-Use Analysis
The Commercial Sector Has Accounted for the Majority of the U.S. Billiards Equipment Market
Based on an end-user, the market is divided into commercial, residential, and professional. Among these, commercial sectors accounted for the majority of the market share, with 56.8%. Due to several key factors. The demand for billiards equipment in commercial spaces such as bars, clubs, recreational centers, and entertainment venues is consistently high.
The US Billiards Equipment Market, By End-Use, 2020-2024 (USD Mn)
End-Use 2020 2021 2022 2023 2024 Commercial 95.1 96.6 98.4 100.6 102.7 Clubs 37.7 38.3 39.0 39.7 40.6 Sports Bars & Hotels 32.5 33.1 33.8 34.5 35.3 Entertainment Centers 16.7 16.9 17.2 17.4 17.8 Other Commercials 8.2 8.3 8.4 8.9 9.0 Residential 41.2 41.7 42.3 42.9 43.5 Professional 33.4 33.5 33.9 34.1 34.7 These businesses often rely on high-quality, durable, and aesthetically appealing equipment to attract customers and generate revenue. Billiards tables and accessories are central to the recreational offerings of these venues, driving significant investment in this segment. Additionally, commercial spaces typically require larger quantities of equipment compared to residential users, increasing their share of the market.
Moreover, the growing trend of sports bars and arcades that offer billiards as a social and entertainment activity has further boosted demand for commercial-grade equipment. These venues often need robust, high-performance tables and accessories capable of withstanding frequent use.
Furthermore, the rise in corporate events and recreational activities in hotels, resorts, and community centers has led to an increased investment in billiards equipment. These factors, combined with the relatively higher budgets for commercial establishments compared to individual consumers, have propelled the commercial sector to dominate the market share, making it the largest end-use category in the billiards industry.
Distribution Channel Analysis
Due To Their Accessibility, Convenience, Product Variety, and Competitive Pricing, Offline Channels Dominate The Market.
Based on distribution channels, the market is further divided into online and offline. Offline channels continue to dominate the U.S. billiards equipment market, accounting for the largest market share in 2024 at 78.8%, primarily due to consumer preferences for hands-on experiences and expert guidance.
Many buyers of billiards equipment prefer to visit physical stores, such as specialty retailers, sports equipment stores, and showrooms, to examine products firsthand. This allows customers to inspect the quality, design, and feel of items such as pool tables, cues, and accessories before making a purchase. Additionally, physical stores often provide personalized services, such as installation, professional advice, and post-purchase support, which are highly valued in this product category.
The opportunity to interact with knowledgeable sales staff and test products in a real-life setting enhances the overall buying experience. Moreover, for high-value items like billiard tables, customers often prefer the reassurance of an in-person transaction rather than purchasing online, where shipping, setup, and quality concerns may arise.
Another factor contributing to the dominance of offline channels is the strong presence of local distributors and dealers who have established long-term relationships with consumers. These outlets offer convenience, especially for customers who require immediate purchases or on-the-spot customization. As a result, offline channels remain the preferred method of purchase in the billiards equipment market.
The US Billiards Equipment Market, By Distribution Channel, 2020-2024 (USD Mn)
Distribution Channel 2020 2021 2022 2023 2024 Online 36.3 36.7 37.2 37.6 38.4 Offline 133.4 135.1 137.4 140.0 142.5 Key Market Segments:
By Product Type
- Tables
- Cues
- Balls
- Others
By End-Use
- Commercial
- Clubs
- Sports Bars & Hotels
- Entertainment Centers
- Other Commercials
- Residential
- Professional
By Distribution Channel
- Online
- Offline
Market Dynamics:
Drivers
Expansion of Hospitality Sectors In The US Is the Major Driving Factor for the Market
The expansion of the U.S. hospitality sector is playing a pivotal role in driving the growth of the billiards equipment market. Hotels, resorts, casinos, sports bars, and upscale entertainment venues are increasingly integrating billiards tables and related equipment to enhance guest experiences and distinguish their offerings in an increasingly competitive landscape.
As hospitality establishments focus on creating immersive and experience-driven environments, the demand for premium and customized billiards tables, cues, and accessories continues to rise.
Furthermore, the expansion of sports bars and hybrid entertainment venues is further fueling demand for billiards equipment. Establishments such as Dave & Buster’s, Lucky Strike, and Topgolf have positioned billiards as a key entertainment feature, attracting customers seeking social and recreational experiences.
The integration of billiards into multi-faceted entertainment spaces that combine dining, gaming, and nightlife has led to greater adoption of technologically advanced tables equipped with smart cue sensors and automated scoring systems.
- According to the National Travel and Tourism Office, expenditures by international visitors in the United States totaled $213.1 billion in 2023, with the country receiving over 66 million international visitors. This surge in tourism is contributing to increased foot traffic in hospitality venues, prompting businesses to enhance their recreational offerings, including billiards, to attract and retain guests.
- The U.S. hotel occupancy is projected to reach 63.38% in 2025, marking a recovery from the historic low of 43.89% recorded in 2020. Although this figure remains slightly below the pre-pandemic occupancy rate of 65.80% in 2019, it reflects a notable resurgence in the hospitality industry. Furthermore, guest spending across lodging, transportation, retail, restaurants, and other expenditures at U.S. hotels is expected to reach a record high of $777.25 billion in 2025, surpassing the previous peak of $747.17 billion in 2024.
Restraints
Increasing Shift Towards Alternate Sports Activities May Hinder the Market’s Growth
The rising shift toward alternate sports, particularly racquet sports such as pickle ball, padel, and tennis, is emerging as a key restraint for the U.S. billiards equipment market. With evolving consumer preferences, an increasing emphasis on physical fitness, and greater accessibility to high-energy sports, the billiards industry is facing intensified competition as a recreational activity.
The appeal of dynamic, fast-paced sports that offer both social engagement and cardiovascular benefits is diverting consumer interest away from traditional indoor games such as billiards.
- According to the United States Tennis Association, U.S. tennis participation has increased by more than six million players (34%) since 2019, while pickleball has witnessed even greater growth, now boasting 10 million more players than it had in 2019 (+289%). The growth trajectory of pickleball remains unmatched, yet tennis continues to hold the highest participation rates among racquet sports in the United States. This rapid expansion of racquet sports has led to heightened investments in related infrastructure, equipment, and training programs, further strengthening their market presence.
The social nature of racquet sports is another critical factor contributing to their rising popularity. Tennis, pickleball, and padel provide interactive gameplay experiences that foster community engagement and social interactions. Numerous fitness centers, country clubs, and public parks actively promote these sports by hosting tournaments, group coaching sessions, and networking events.
Opportunity
Rising Focus On Sustainable Material Sourcing Billiards Equipment Is Anticipated to Create More Opportunities
The rising focus on sustainable material sourcing is emerging as a significant opportunity for the U.S. billiards equipment market. As consumers and businesses increasingly prioritize environmental responsibility, manufacturers of billiards tables, cues, and accessories are shifting towards eco-friendly materials and sustainable production practices.
This shift aligns with broader market trends emphasizing sustainability, particularly within the sports and leisure equipment industry, where demand for ethically sourced and low-impact materials is gaining momentum.
One of the key factors driving this transition is the growing consumer awareness regarding the environmental impact of traditional billiards equipment manufacturing. Conventional billiards tables are often constructed using hardwoods such as mahogany, maple, and oak, many of which are sourced from regions facing deforestation concerns.
Additionally, synthetic felt coverings and petroleum-based adhesives contribute to the industry’s carbon footprint. To address these challenges, several manufacturers are adopting responsibly harvested wood, bamboo, and recycled materials in the production of tables and cue sticks. Companies that can effectively integrate sustainable sourcing into their production lines stand to gain a competitive advantage by appealing to environmentally conscious consumers and businesses.
Trends
Integration Of Smart Technology In Billiards Equipment
The growing adoption of smart home technology is driving innovation in the billiards equipment market, with manufacturers integrating advanced digital features to enhance gameplay. Modern billiard tables are increasingly equipped with embedded touch screens for electronic scoring, motion sensors for advanced game analytics, and interactive surfaces that provide real-time feedback to players.
Some high-end models feature touchscreen displays that allow users to input player names and select game modes, offering a seamless and tech-enhanced experience. Additionally, digital scoring systems are modernizing traditional billiards by incorporating automation and precision.
Another notable advancement is the integration of built-in LED lighting, which not only enhances visibility for better gameplay but also adds a futuristic aesthetic to gaming spaces. These technological advancements are reshaping the billiards experience, making it more engaging for tech-savvy consumers.
Geopolitical Impact Analysis
The Current Geopolitical Impact On the Global Billiards Equipment Market Is Multifaceted, Influenced by Various International and Regional Factors.
The U.S. billiards equipment market is experiencing significant disruptions due to recent geopolitical developments, particularly the imposition of substantial tariffs on imports from key manufacturing regions. On April 3, 2025, the U.S. government implemented broad tariff measures, including a 54% duty on Chinese imports, a 20% tariff on goods from the European Union, and a 46% tariff on products originating from Vietnam.
Given that a significant share of billiards equipment, including tables, cues, accessories, and raw materials, is sourced from these regions, these tariffs are expected to disrupt supply chains and drive up production costs for U.S. importers and retailers.
Further compounding these trade tensions, the Government of Canada has introduced countermeasures in response to U.S. tariffs on Canadian steel and aluminum. Effective March 13, 2025, Canada has imposed a 25% tariff on $29.8 billion worth of U.S. imports.
These measures apply to goods designated as U.S.-origin under the Determination of Country of Origin for Marking Goods (CUSMA Countries) Regulations and will remain in effect until U.S. restrictions on Canadian steel and aluminum are lifted. However, U.S. goods already in transit to Canada before the enforcement date are exempt from these tariffs.
Key Regions Covered in this Report
The US
- Northeast
- Midwest
- South
- West
The US Billiards Equipment Market, By Region, 2020-2024 (USD Mn)
Region 2020 2021 2022 2023 2024 Northeast 36.3 36.7 37.2 37.6 38.4 Midwest 133.4 135.1 137.4 140.0 142.5 South 133.4 135.1 137.4 140.0 142.5 West 133.4 135.1 137.4 140.0 142.5 In The U.S. Billiards Equipment Market, Companies Are Increasingly Focusing On Product Portfolio Expansion Through Various Strategies To Maintain Their Leadership And Competitive Edge.
Leading brands are broadening their offerings by expanding their range of billiards equipment, including introducing new pool table designs, cues, and accessories. They are focusing on catering to a wider audience, from casual home users to professional players, with varying price points and customization options. For example, companies are introducing modern, high-tech billiard tables with integrated electronics or innovative designs that appeal to younger generations.
Some U.S.-based billiards companies are expanding their operations internationally. By entering emerging markets in Asia, Europe, and Latin America, these companies are looking to tap into the growing popularity of billiards and pool sports outside the U.S. This international growth provides an additional revenue stream and helps these companies increase their global footprint.
Market Key Players
The following are some of the major players in the industry
- Diamond Billiard Products INC.
- BernerBilliards
- GLD Products
- Iwan Simonis
- OlhausenBilliard Mfg. Inc.
- Viking Cues LLC
- Schmelke Cues
- BilijardaiJSC
- Golden West Billiards
- E. Schmidt Billiard Company
- Escalade Sports
- Valley-Dynamo L.P.
- RASSON BILLIARDS MFG
- Legacy Billiards
- EPCO Manufacturing
- Other Key Players
Recent Development
- In March 2024, Helen of Troy Limited brand and Hydro Flask products to help reduce waste and promote a circular economy. Hydro Flask’s Trade-In program is the first of its kind in the insulated water bottle industry.
- In June 2022, Tupperware partnered with Vera Bradley to launch a limited-edition collection of Billiards Equipment and other items featuring stylish, fashion-forward designs.
Report Scope
Report Features Description Market Value (2024) USD 180.9 Mn Forecast Revenue (2034) USD 225.8 Mn CAGR (2025-2034) 2.2% Base Year for Estimation 2024 Historic Period 2020-2023 Forecast Period 2025-2034 Report Coverage Revenue Forecast, Market Dynamics, Competitive Landscape, Recent Developments Segments Covered By Product Type (Tables, Cues, Balls, Others), By End-Use (Commercial, Residential, and Professional), By Distribution Channel (Online and Offline) Competitive Landscape Diamond Billiard Products Inc., BernerBilliards, GLD Products, Iwan Simonis, OlhausenBilliard Mfg. Inc., Viking Cues LLC, Schmelke Cues, BilijardaiJSC, Golden West Billiards, A.E. Schmidt Billiard Company, Escalade Sports, Valley-Dynamo L.P., RASSON BILLIARDS MFG, Legacy Billiards, EPCO Manufacturing, and Other Key Players Customization Scope Customization for segments, region/country-level will be provided. Moreover, additional customization can be done based on the requirements. Purchase Options We have three licenses to opt for: Single User License, Multi-User License (Up to 5 Users), Corporate Use License (Unlimited User and Printable PDF)  US Billiards Equipment MarketPublished date: April 2025add_shopping_cartBuy Now get_appDownload Sample
 -
-
- Diamond Billiard Products INC.
- BernerBilliards
- GLD Products
- Iwan Simonis
- OlhausenBilliard Mfg. Inc.
- Viking Cues LLC
- Schmelke Cues
- BilijardaiJSC
- Golden West Billiards
- E. Schmidt Billiard Company
- Escalade Sports
- Valley-Dynamo L.P.
- RASSON BILLIARDS MFG
- Legacy Billiards
- EPCO Manufacturing
- Other Key Players
Our Clients
- 145626
- April 2025


