Report Overview
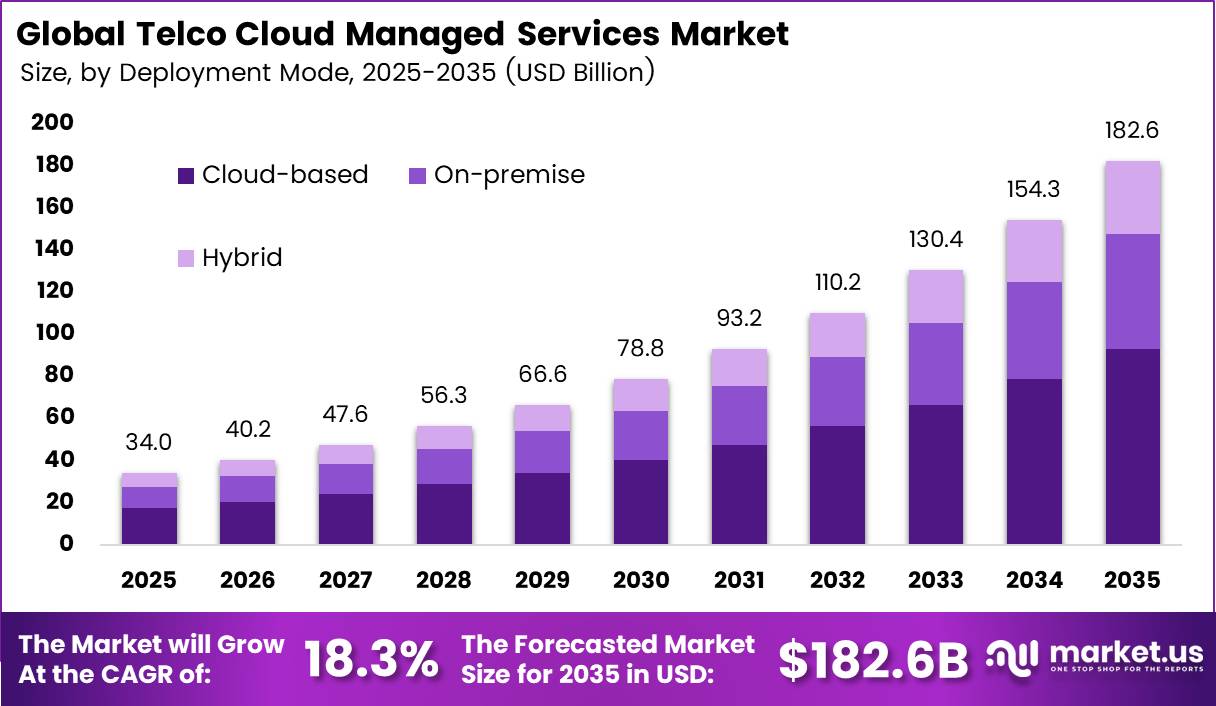
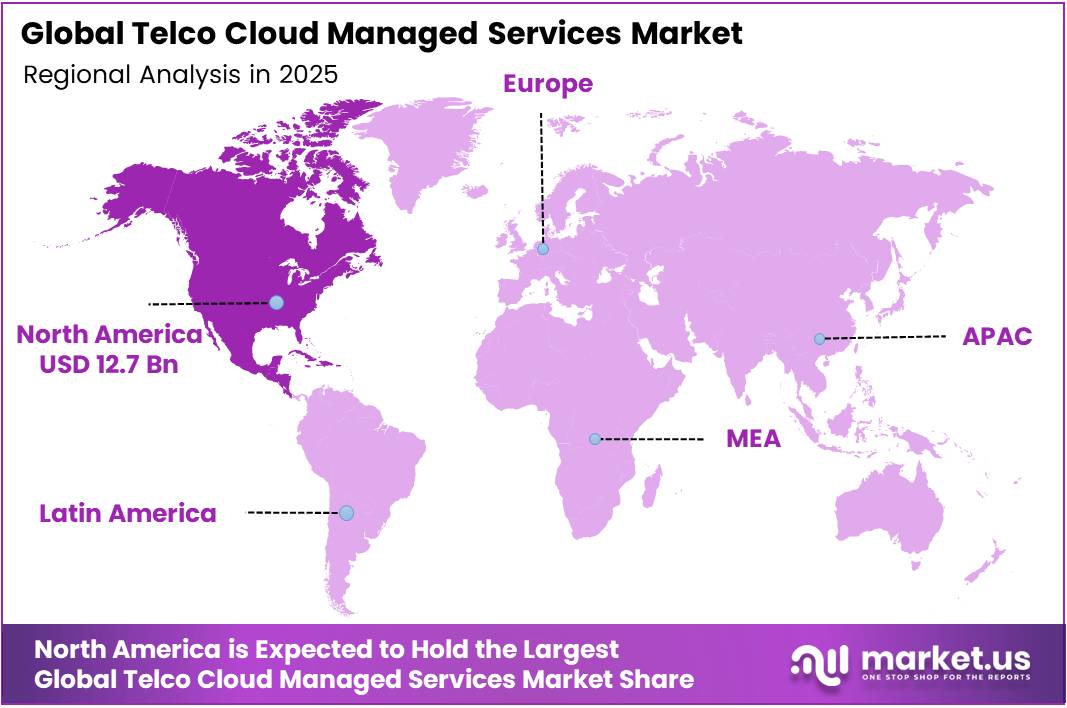
In 2025, the Global Telco Cloud Managed Services Market was valued at USD 34.0 billion. The market is projected to grow at a CAGR of 18.3% during 2026–2035, reaching approximately USD 182.6 billion by 2035. North America dominated the global market in 2025, accounting for more than 37.2% of the total market share and generating approximately USD 12.7 billion in revenue.
Growing network traffic drives this rise. According to the ITU, about 6 billion people used the internet in 2025, and the online population grew by more than 240 million in one year. The ITU also counted about 3 billion 5G subscriptions, and 5G networks now cover 55% of the world’s population.
Operators run these 5G cores, data platforms, and edge sites on cloud systems, so they hire managed service partners to run them. The WTO reported that trade in AI goods such as servers, semiconductors, and telecom equipment rose 20% year on year in the first half of 2025.
The North America region has high incomes and mature networks. The ITU reports that 5G reaches 84% of people in high-income countries, compared with only 4% in low-income countries. Users in wealthier countries also use nearly 8 times more mobile data than users in poorer regions. More data per user means more cloud capacity, more traffic tools, and more paid managed service contracts.
Key Takeaways
- The Telco Cloud Managed Services Market reached USD 34.0 billion in 2025 and will hit USD 182.6 billion by 2035. at a CAGR of 18.3% from 2026 to 2035.
- By managed service type, Network Services lead with a 24.8% share.
- By deployment mode, Cloud leads with a 71.2% share.
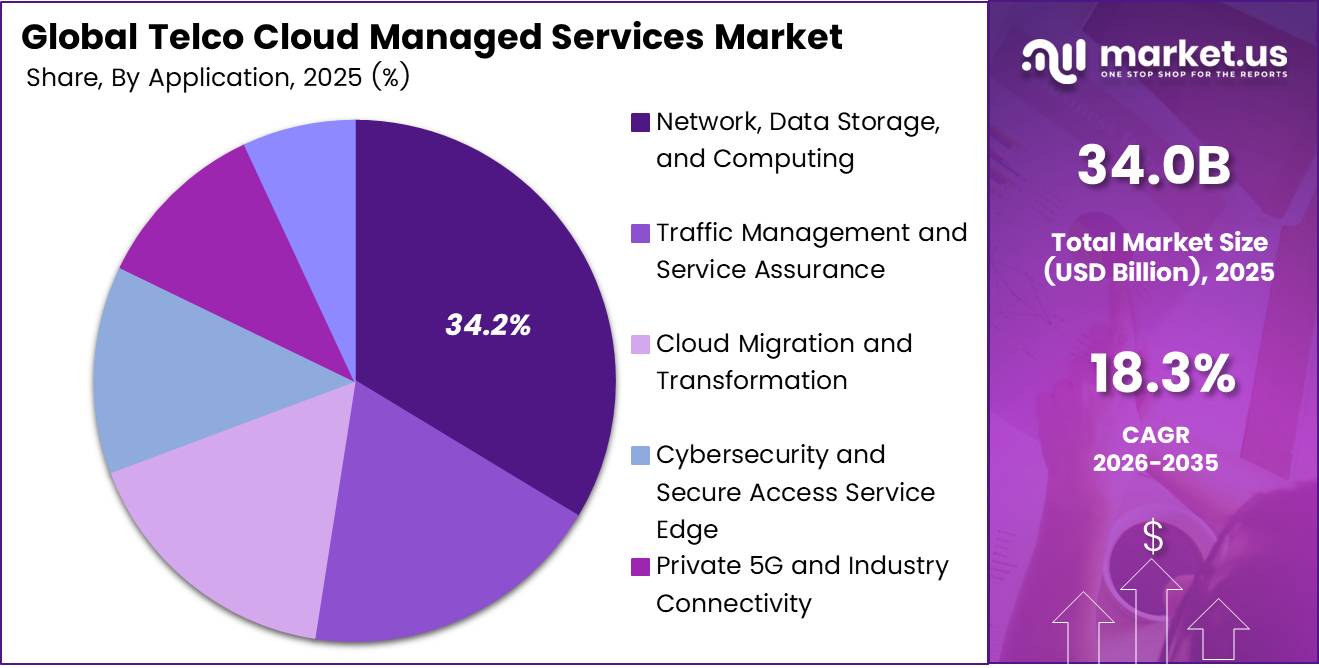
- By application, Network, Data Storage, and Computing lead with a 34.2% share.
- By application, Cloud Migration and Transformation grows at the fastest rate.
- By end user, Large Enterprises lead with an 81.2% share.
- North America leads with a 37.2% share and USD 12.7 billion in revenue.
By Managed Service Type
Network Services dominates with 24.8% due to rising 5G traffic and capacity needs.
Network Services holds the top spot because operators need their networks to run fast and stay stable all day. Ericsson reports close to 3.3 billion 5G subscriptions worldwide, and every new user puts more load on core and radio systems.
Mobile data traffic also rose 23% between Q2 2025 and Q2 2026, so telcos hand network work to managed partners who can add capacity on demand. Cloud Infrastructure Services is growing fastest as operators move network functions off fixed hardware and onto shared cloud platforms.
Ericsson expects 5G Standalone subscriptions to reach about 3.9 billion by 2031, or roughly 60% of all 5G users. Standalone 5G runs on a cloud-native core, which pushes telcos to buy managed compute, storage, and container platforms.
By Deployment Mode
Cloud dominates with 71.2% due to lower costs and faster service rollout.
Cloud deployment leads because operators want to launch services quickly without building new hardware sites. The GSMA says mobile technologies and services generated $7.6 trillion for the global economy in 2025, equal to 6.4% of world GDP. That much value pushes telcos to pick flexible, pay-as-you-go cloud models that scale with demand.
Hybrid deployment is growing fastest as telcos try to balance speed with control. The GSMA expects the mobile industry’s economic impact to reach $11.3 trillion by 2030 as 5G and AI adoption speeds up. Operators keep sensitive subscriber data and critical core functions on their own sites, and they send flexible workloads to the public cloud.
By Application
Network, Data Storage, and Computing dominates with 34.2% due to core telco workloads needing constant capacity.
Network, Data Storage, and Computing leads because every telco service depends on reliable compute and storage underneath it. Ericsson data shows global mobile traffic hit 172 exabytes per month by the end of Q1 2025. Operators must store, process, and route this data every second, which makes these tasks the base layer of every managed services contract.
Cloud Migration and Transformation is growing fastest as telcos retire old systems and rebuild on cloud-native platforms. Ericsson expects total mobile traffic, including Fixed Wireless Access, to reach around 430 exabytes per month by 2030. Legacy hardware can’t handle that scale at a sensible cost, so operators hire partners to plan and run large migration programs.
The move to 5G adds even more urgency. Ericsson projects 5G will carry about 80% of mobile traffic by 2030, up from 35% at the end of 2024. It also forecasts 350 million Fixed Wireless Access connections by 2030. Each shift calls for fresh cloud design work, which keeps migration demand strong.
By End User
Large Enterprises dominate with 81.2% due to big budgets for complex multi-site networks.
Large Enterprises lead because they run complex networks across many sites, countries, and business units. They have the budgets for long, full-scope managed contracts covering cloud, security, and private connectivity. OECD data shows a clear adoption gap: large firms’ lead over small firms in cloud purchasing widened from 31 to 33 percentage points between 2020 and 2021.
Small Enterprises are the fastest-growing group, and they are now starting to close that gap. In the OECD area, the share of small businesses buying cloud computing services rose from 38% to 41% over the same period. Smaller firms often don’t have IT teams, so they pick managed telco cloud bundles that come with setup, support, and security in one monthly plan.
Key Market Segments
By Managed Service Type
- Network Services
- Cloud Infrastructure Services
- Security Services
- Data Center and Backup Services
- Orchestration and Service Assurance
- Professional and Support Services
By Deployment Mode
- Cloud
- On-premise
- Hybrid
By Application
- Network, Data Storage, and Computing
- Traffic Management and Service Assurance
- Cloud Migration and Transformation
- Cybersecurity and Secure Access Service Edge
- Private 5G and Industry Connectivity
- Edge Computing and IoT Operations
By End User
- Large Enterprises
- Small Enterprises
Geopolitical Impact Analysis
Geopolitical stress now shapes the cost of the hardware behind telco clouds. Servers, switches, optical modules, and radio units travel by sea from Asian factories to carrier data centers. UNCTAD reported that tonnage through the Suez Canal was still 70% below 2023 levels by May 2025. Ships that once crossed the Red Sea in days now sail for weeks around the Cape of Good Hope.
Longer routes raise freight costs and stretch delivery times for equipment. UNCTAD found that rerouting pushed ton-miles up by a record 6% in 2024, nearly three times faster than trade volume growth. UNCTAD expects maritime trade to slow to just 0.5% growth in 2025, down from 2.2% in 2024. Late hardware delays new data center builds, so carriers lean harder on managed partners to stretch existing capacity.
Tariffs add a second layer of cost. The WTO said that higher tariffs took effect in August 2025 and that rising input prices could push inflation up in exposed sectors. North American buyers stocked up on imports ahead of these tariff hikes, and world trade volume grew 4.9% year on year in the first half of 2025. The WTO expects that growth to fall to 0.5% in 2026 as tariffs bite.
Energy routes matter as well. The Strait of Hormuz carries 11% of global maritime trade and over one-third of seaborne oil exports. Any disruption there would lift power and cooling costs for data centers. Providers would then pass these costs into managed service prices.
Regional Analysis
North America dominates the Telco Cloud Managed Services Market, holding a 37.2% share and generating USD 12.7 billion in revenue. The US drives most of this demand. US carriers run some of the world’s most advanced 5G networks and are moving their core functions to public and private clouds.
North America recorded the highest regional 5G subscription penetration at 79% at the end of 2025, ahead of Northeast Asia at 60% and Western Europe at 54%. High adoption means carriers must manage huge data flows every day. They hire managed service partners to run orchestration, assurance, and security across these clouds.
Asia Pacific is the fastest-growing region in the market. The ITU reports that 5G covers 70% of the population in Asia Pacific. The region has 46 5G subscriptions per 100 people. Internet use differs a lot by country. China reaches 91.6% internet use and Japan 85.5%, while India sits at 70%. South Korea and Australia push early 5G standalone networks.
Europe holds a strong second position. The ITU reports that 5G reaches 74% of Europe’s population, the highest regional figure. Carrier mergers also fuel spending. Vodafone and Three plan to invest 11 billion pounds (USD 14.8 billion) over 10 years to build a 5G network in the UK. Germany, France, Spain, and Italy push data rules that favor local cloud setups.
Key Regions and Countries
North America
- US
- Canada
Europe
- Germany
- France
- The UK
- Spain
- Italy
- Rest of Europe
Asia Pacific
- China
- Japan
- South Korea
- India
- Australia
- Rest of APAC
Latin America
- Brazil
- Mexico
- Rest of Latin America
Middle East and Africa
- GCC
- South Africa
- Rest of MEA
Market Dynamics
Drivers
| Driver | (~) % Impact on CAGR Forecast | Geographic Relevance | Impact Timeline |
|---|---|---|---|
| 5G Standalone Core Cloudification | +3.1% | Global, led by Asia Pacific and North America | Short term (2 years or less) |
| Operator OpEx Optimization Mandates | +2.4% | Europe, North America | Short term (2 years or less) |
| Hyperscaler-Telco Partnership Expansion | +2.0% | Global | Medium term (2 to 4 years) |
| Open RAN and vRAN Deployments | +1.5% | North America, Europe, Japan, India | Medium term (2 to 4 years) |
| AIOps-Driven Network Automation | +1.3% | Global | Short term (2 years or less) |
5G Standalone Core Cloudification
Operators moving from non-standalone to standalone 5G have to run cloud-native core functions on containerized platforms. Per GSMA Intelligence tracking, more than 60 operators had launched or soft-launched 5G SA networks by 2025, and 5G connections were heading past 2 billion worldwide according to GSMA Mobile Economy data.
The change to the business model is a shift from one-time capital spending on hardware to recurring operating fees. Telco annual reports, such as Deutsche Telekom and Bharti Airtel disclosures, show core-network capex being moved into platform-as-a-service and outcome-based managed contracts.
Managed service providers now earn recurring revenue tied to multi-year contracts, often running 5 to 7 years. Operators, in turn, report a 20% to 30% reduction in core-network total cost of ownership, in line with the cloud-native efficiency ranges cited in TM Forum benchmarking. Together, these effects add about +3.1% above the 18.3% baseline.
Restraints
| Restraint | (~) % Impact on CAGR Forecast | Geographic Relevance | Impact Timeline |
|---|---|---|---|
| Telecom Capex Contraction Cycle | -2.2% | Global, acute in Europe and North America | Short term (2 years or less) |
| Data Sovereignty and Localization Laws | -1.6% | EU, India, China, Middle East | Medium term (2 to 4 years) |
| High-Risk Vendor Exclusion Rules | -1.1% | EU, US, UK, Australia | Medium term (2 to 4 years) |
| Elevated Operator Debt Servicing Costs | -0.9% | Europe, Latin America, Africa | Short term (2 years or less) |
| Legacy Contract Lock-ins | -0.6% | Global | Short term (2 years or less) |
Telecom Capex Contraction Cycle
The root cause is a mismatch between spending and revenue. Operators that front-loaded 5G spectrum and RAN investment are now seeing flat returns. Per GSMA Intelligence, global operator revenue growth has stayed in low single digits, near 2% to 3% a year. Over the same period, the ITU and national regulators recorded spectrum auction outlays in the tens of billions in major markets.
The bottleneck shows up in vendor results. Ericsson and Nokia reported mobile networks sales declines of roughly 10% to 20% during 2023 and 2024, according to their quarterly earnings releases. Operator capital-intensity guidance in investor presentations has moved toward 12% to 15% of revenue.
The commercial effect is delayed decisions. Cloud core migration and new managed-service RFPs are being postponed or cut back into phased pilots, which stretches contract award cycles by 6 to 12 months. Providers are also being pushed toward discounted pricing that compresses gross margins by 2 to 4 percentage points. Net, this removes roughly -2.2% from the baseline.
Challenges
| Challenge | (~) % CAGR Friction Drag | Geographic Relevance | Mitigation Horizon |
|---|---|---|---|
| Cloud-Native Telecom Skills Gap | -1.8% | Global | Medium term (2 to 4 years) |
| Multi-Vendor Integration Complexity | -1.2% | Global | Medium term (2 to 4 years) |
| Expanding Cyberattack Surface | -1.0% | Global | Long term (4 years or more) |
| Carrier-Grade Reliability Assurance | -0.7% | North America, Europe, Asia Pacific | Medium term (2 to 4 years) |
| Data Center Energy Constraints | -0.5% | Europe, North America | Long term (4 years or more) |
Cloud-Native Telecom Skills Gap
The structural weakness is a workforce built for the wrong technology. Telecom engineering staff were trained on proprietary appliance-based networks, not on Kubernetes, CI/CD pipelines, and GitOps operations. ISC2 workforce studies estimate the global cybersecurity talent shortfall alone at about 4 million professionals, and Linux Foundation cloud-native surveys report that over 50% of organizations cite skills scarcity as their main deployment barrier.
The friction is visible in delivery. Managed service providers report onboarding timelines 3 to 6 months longer than planned. Specialist wage inflation is running near 8% to 12% a year in key engineering hubs, according to national labor statistics from India and the US Bureau of Labor Statistics.
The long-term response is structural. Companies are building in-house cloud academies, shifting work to automation-heavy delivery centers, and pursuing certification partnerships such as TM Forum and CNCF programs. These steps are needed to keep this drag from widening beyond roughly -1.8%.
Opportunities
| Opportunity | (~) % Potential CAGR Upside | Geographic Relevance | Execution Window |
|---|---|---|---|
| Network Slicing Monetization Services | +2.2% | Asia Pacific, Europe, North America | Medium term (2 to 4 years) |
| Multi-Access Edge Computing for Enterprises | +1.7% | Global | Medium term (2 to 4 years) |
| Sovereign Telco Cloud Platforms | +1.3% | EU, Middle East, India | Medium term (2 to 4 years) |
| Network API Exposure Marketplaces | +1.0% | Global | Long term (4 years or more) |
| Tier-2 and Tier-3 Operator Roll-ups | +0.8% | Africa, Latin America, Southeast Asia | Short term (2 years or less) |
Network Slicing Monetization Services
Network slicing is still white space rather than a current driver. 3GPP Release 17 and Release 18 specifications enable guaranteed-SLA slices, but GSMA Intelligence tracking shows commercial slicing offers concentrated in fewer than 30 operators, mostly in pilot or niche uses such as broadcast and public safety. That means most of the potential enterprise demand has not yet been captured.
The new revenue model is managed slice orchestration, assurance, and SLA billing sold per slice, on an outcome basis. Operator investor disclosures from Singtel and Telstra point to enterprise slice pricing premiums of 20% to 40% over best-effort connectivity.
The unit economics improve as orchestration is automated. Per TM Forum autonomous network benchmarks, automated slice lifecycle management can cut per-slice provisioning cost by 50% to 70% and expand managed-service gross margins by 5 to 8 percentage points. Executed deliberately, this could add about +2.2% above the 18.3% baseline.
Key Players Analysis
Tier 1 leaders include Amazon Web Services, Microsoft, and Google. These firms own the largest cloud platforms that carriers rent and run. Amazon’s 10-K shows AWS net sales of USD 128.7 billion in 2025, up from USD 107.6 billion in 2024. Microsoft grew its Intelligent Cloud revenue by USD 18.8 billion, or 21%, in FY2025, and Azure and other cloud services revenue grew 34%.
Google uses deals to grow its cloud security reach. Google closed its USD 32 billion cash purchase of Wiz in March 2026, the largest deal in the company’s history. The move gives Google Cloud a strong security layer for multi-cloud carrier networks. IBM, Oracle, and Broadcom compete through hybrid cloud software and support contracts.
Tier 2 challengers include Ericsson, Nokia, Huawei, Cisco, and Hewlett Packard Enterprise. These firms lead in network gear and telecom software. Ericsson won a contract worth SEK 12.5 billion (USD 1.3 billion) as the main vendor in Vodafone’s USD 2.7 billion UK 5G deal. Nokia took a USD 1 billion investment from NVIDIA at USD 6.01 per share to build AI-RAN products.
Hewlett Packard Enterprise closed its USD 14 billion purchase of Juniper Networks in July 2025, which doubled the size of its networking business. HPE now targets at least USD 600 million in yearly cost savings over three years. Cisco and Huawei compete on routing, security, and carrier cloud platforms.
Top Key Players in the Market
- Amazon Web Services, Inc.
- Microsoft Corporation
- Google LLC
- International Business Machines Corporation
- Telefonaktiebolaget LM Ericsson
- Nokia Corporation
- Huawei Technologies Co., Ltd.
- Cisco Systems, Inc.
- Oracle Corporation
- Broadcom Inc.
- Hewlett Packard Enterprise Company
Recent Developments
- In July 2025, Hewlett Packard Enterprise Company completed its USD 14 billion purchase of Juniper Networks, which doubled its networking business.
- In September 2025, Telefonaktiebolaget LM Ericsson won a SEK 12.5 billion (USD 1.3 billion) contract from Vodafone to supply 5G equipment in the UK.
- In October 2025, Nokia Corporation secured a USD 1 billion investment from NVIDIA at USD 6.01 per share to speed up AI-RAN and 6G development.
- In March 2026, Google LLC closed its USD 32 billion purchase of Wiz and added the platform to Google Cloud.
Report Scope
| Report Features | Description |
|---|---|
| Market Value (2025) | USD 34.0 Billion |
| Forecast Revenue (2035) | USD 182.6 Billion |
| CAGR (2026-2035) | 18.3% |
| Base Year for Estimation | 2025 |
| Historic Period | 2020-2024 |
| Forecast Period | 2026-2035 |
| Report Coverage | Revenue Forecast, Market Dynamics, Competitive Landscape, Recent Developments |
| Segments Covered | By Managed Service Type (Network Services, Cloud Infrastructure Services, Security Services, Data Center and Backup Services, Orchestration and Service Assurance, Professional and Support Services); By Deployment Mode (Cloud, On-premises, Hybrid); By Application (Network, Data Storage, and Computing, Traffic Management and Service Assurance, Cloud Migration and Transformation, Cybersecurity and Secure Access Service Edge, Private 5G and Industry Connectivity, Edge Computing and IoT Operations); By End User (Large Enterprises, Small Enterprises) |
| Regional Analysis | North America – US, Canada; Europe – Germany, France, The UK, Spain, Italy, Rest of Europe; Asia Pacific – China, Japan, South Korea, India, Australia, Singapore, Rest of APAC; Latin America – Brazil, Mexico, Rest of Latin America; Middle East & Africa – GCC, South Africa, Rest of MEA |
| Competitive Landscape | Amazon Web Services, Inc., Microsoft Corporation, Google LLC, International Business Machines Corporation, Telefonaktiebolaget LM Ericsson, Nokia Corporation, Huawei Technologies Co., Ltd., Cisco Systems, Inc., Oracle Corporation, Broadcom Inc., Hewlett Packard Enterprise Company |
| Customization Scope | Customization for segments and region/country-level will be provided. Moreover, additional customization can be done based on the requirements. |
| Purchase Options | We have three licenses to opt for: Single User License, Multi-User License (Up to 5 Users), Corporate Use License (Unlimited Users and Printable PDF) |