


Report Overview
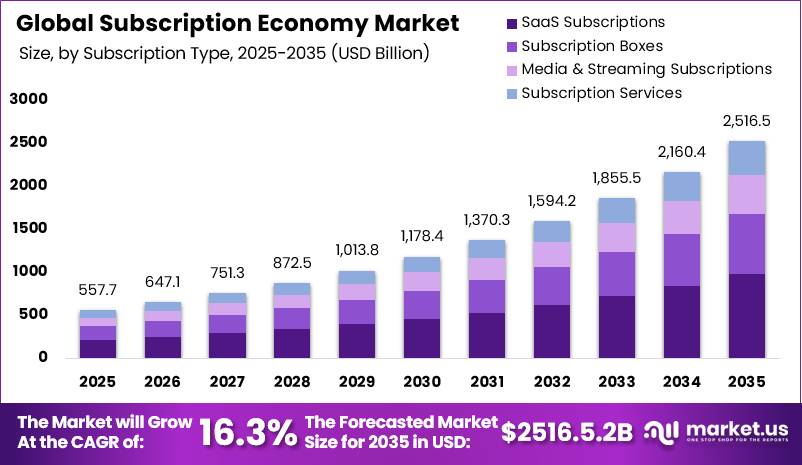
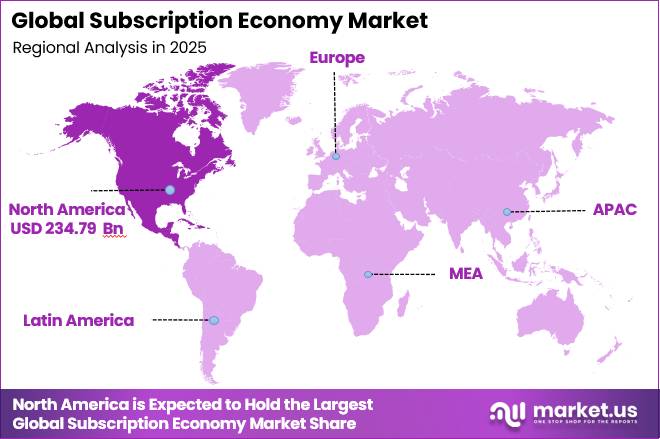
In 2025, the Subscription Economy Market was valued at USD 557.7 billion. The market is projected to grow at a CAGR of 16.3% during 2026–2035, reaching approximately USD 2516.5 billion by 2035. North America dominated the global market in 2025, accounting for more than 42.10% of the total market share and generating approximately USD 234.79 billion in revenue. This growth is supported by the increasing number of digitally connected consumers and businesses that are adopting subscription-based services across industries, driving steady demand and recurring revenue models.
The growth of the subscription economy is supported by the rapid expansion of digital connectivity and enterprise digital transformation. According to the International Telecommunication Union Facts and Figures 2025, the global internet population reached nearly 6 billion people in 2025, representing 74% of the world’s population, with more than 240 million new users added in one year. This expanding online user base continues to increase demand for subscription-based software, streaming, e-commerce, healthcare, and cloud services.
The GSMA Mobile Economy 2025 report states that mobile technologies generated USD 6.5 trillion, accounting for 5.8% of global GDP, while 5.8 billion people were unique mobile subscribers, equal to 71% global penetration. At the enterprise level, the Organisation for Economic Co-operation and Development reported that 20.2% of businesses adopted AI tools in 2025, up from 8.7% in 2023, an increase of more than 130% in two years. AI adoption was highest among ICT companies at 57.3%, supporting strong demand for AI-powered SaaS and cloud subscriptions with recurring revenue models.
Meanwhile, India’s Ministry of Electronics and Information Technology reported that the country’s digital economy contributed USD 402 billion, or 11.74% of GDP, during 2022–23, and is expected to account for 20% of GVA by 2029–30. These trends, supported by expanding internet access, mobile connectivity, AI adoption, and digital economy growth, continue to strengthen the long-term outlook for the subscription economy.
Key Takeaways
- In 2025, the global Subscription Economy Market was valued at USD 557.7 billion.
- The market is projected to reach USD 2,516.5 billion by 2035, expanding at a CAGR of 16.3% during 2026–2035.
- North America led the global market in 2025, accounting for more than 42.10% of total revenue, equivalent to USD 234.79 billion.
- By Subscription Type, SaaS Subscriptions held the largest share at 38.60%, while Media & Streaming Subscriptions is expected to register the fastest growth.
- By Business Model, Business-to-Business (B2B) dominated with 54.20% of the market, while Business-to-Consumer (B2C) is projected to grow at the fastest rate.
- By Payment Model, Recurring Fixed Subscription accounted for the largest share of 49.30%, whereas Usage-Based (Pay-as-you-go) is anticipated to be the fastest-growing segment.
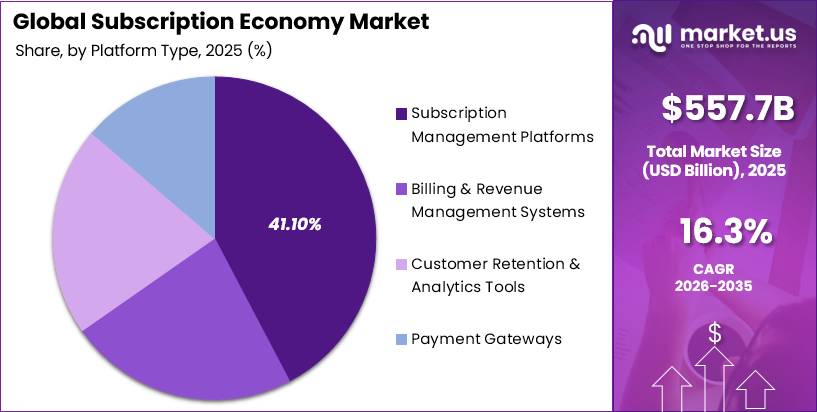
- By Platform Type, Subscription Management Platforms captured 41.10% of the market, while Customer Retention & Analytics Tools are expected to witness the highest growth.
- By End User Industry, IT & Software (SaaS) held the leading share of 36.90%, while Media & Entertainment is forecast to be the fastest-growing industry.
- By Customer Type, Enterprises accounted for the largest market share at 58.70%, while SMEs are expected to record the fastest growth.
- By Engagement Type, Monthly Subscriptions dominated with a 46.80% share, whereas On-demand Subscriptions are projected to grow the fastest.
- Asia-Pacific is expected to be the fastest-growing regional market during the forecast period.
Subscription Economy Statistics
- The e-commerce subscription market is experiencing rapid growth, expanding by more than 65% year over year. It is expected to exceed $900 billion by 2026 (Dealhub).
- Over the past decade, subscription revenue has surged by 437%, significantly outpacing the S&P 500 by a factor of 4.6x. This exceptional growth highlights the increasing consumer preference for subscription-based models.
- Digital subscription companies have achieved a remarkable combined market capitalization of $15 trillion, reflecting the sector’s financial strength and investor confidence.
- Approximately 98% of consumers now subscribe to at least one streaming service, illustrating the widespread adoption of digital media consumption.
- Millennials, in particular, showcase a strong affinity for digital subscriptions, maintaining an average of 17 media subscriptions per individual.
- On the business front, 99% of companies utilize at least one SaaS vendor, underscoring the indispensable role of software subscriptions in modern operations.
- Key Market Insights from NamiML: The United States is the largest consumer of digital subscriptions, accounting for 53% of the global market.
- Mobile app spending is on track to reach $270 billion, driven by the growing demand for subscription-based apps and digital services.
- The Software as a Service (SaaS) market has doubled in size, projected to reach $307 billion, reinforcing its critical role in enterprise software solutions.
- The largest subscription category is e-commerce, valued at $478 billion, showcasing its dominance among subscription models.
- Streaming services continue to expand, with market size expected to hit $155 billion, as consumer demand for on-demand media remains strong.
- The subscription and billing management market is projected to grow to $10.5 billion, driven by the need for streamlined, automated subscription handling.
Subscription Type Analysis
SaaS Subscriptions held the dominant position in the subscription economy, accounting for 38.60% of the market, driven by the rapid adoption of cloud-based software across businesses worldwide. According to Eurostat, 52.7% of EU enterprises used paid cloud computing services in 2025, up 7.4 percentage points from 2023. The most widely used cloud services included e-mail (85.2%), office software (71.7%), file storage (71.5%), and finance and accounting applications (58.2%).
As organizations use multiple SaaS applications simultaneously, recurring subscription revenue continues to increase. In addition, UNCTAD reported that digitally deliverable services accounted for 56% of global services exports in 2023, with exports reaching USD 4.5 trillion. Developing economies also crossed USD 1 trillion in digitally deliverable service exports for the first time, highlighting the growing importance of SaaS in the global digital economy.
Media & Streaming Subscriptions are projected to register the fastest growth during the forecast period due to the increasing shift from traditional television to on-demand digital content. According to Omdia’s 2025 TV & Video Market Data, global online video subscriptions reached 2.24 billion by the end of 2025, increasing 17.6% from 1.9 billion in 2024. Online video revenue also grew 13.5% to USD 176 billion, surpassing global pay-TV revenue for the first time. Furthermore, the ITU reported that 74% of the global population was using the internet in 2025.
Business Model Analysis
Business-to-Business (B2B) accounted for the largest share of 54.20% in the subscription economy market due to strong enterprise demand for subscription-based software and digital services. According to the World Intellectual Property Organization (WIPO) Global Innovation Index 2025, global software spending reached USD 675 billion in 2024, increasing by nearly 50% from USD 454 billion in 2020.
The United States contributed USD 368.5 billion, representing more than 54% of global software spending, with major investments in enterprise SaaS, cloud infrastructure, and AI platforms. In addition, Eurostat reported that in 2025, 55.03% of large enterprises and 30.36% of medium-sized enterprises in the EU had adopted AI technologies, most of which are delivered through subscription-based SaaS models.
Business-to-Consumer (B2C) is projected to register the fastest growth during the forecast period, supported by rising internet penetration and digital adoption across emerging economies. According to Ireland’s Central Statistics Office (CSO) Household Digital Consumer Behaviour 2025, 85% of internet users purchased goods or services online in 2025. The same report found that the use of internet banking and mobile payments reached 94%, increasing by 7 percentage points compared with 2024.
Payment Model Analysis
Recurring Fixed Subscriptions accounted for the largest market share of 49.30% because they provide predictable monthly or annual payments for both businesses and consumers. This billing model is widely used across enterprise software, cloud services, telecommunications, and digital subscriptions, as it helps organizations manage budgets more effectively.
The International Telecommunication Union (ITU) reported in 2025 that there were 99 mobile broadband subscriptions per 100 inhabitants worldwide, showing almost universal adoption. Most of these mobile, internet, and software subscriptions are billed through recurring monthly or annual plans, making recurring fixed subscriptions the largest revenue-generating payment model.
Usage-Based (Pay-as-You-Go) is the fastest-growing payment model due to the rapid expansion of AI, cloud computing, and data center services. According to the International Energy Agency (IEA) Energy and AI Report, global data center electricity consumption reached 415 TWh in 2024, increasing by 12% annually over the past five years, and is expected to reach 945 TWh by 2030. Cloud platforms typically charge customers based on actual resource usage, including computing power, API requests, storage, and data transfer.
Platform Type Analysis
Subscription Management Platforms accounted for the largest market share of 41.10% because they provide the core infrastructure required to manage recurring revenue models. These platforms automate subscription billing, plan upgrades, renewals, payment collection, and compliance, helping businesses efficiently manage large customer bases. According to Eurostat (2025), 53% of EU enterprises used specialized e-business software such as ERP, CRM, and SCM systems, while 33.02% used data analytics with their own employees.
Customer Retention & Analytics Tools are expected to register the fastest growth because reducing customer churn has become a top business priority. Eurostat (2025) reported that CRM adoption reached 63.14% among enterprises in the Information and Communication sector, with adoption increasing rapidly across other industries. As subscriber acquisition becomes more expensive, businesses are focusing on retaining existing customers to drive long-term revenue.
End User Industry Analysis
IT & Software (SaaS) accounted for the largest 36.9% share of the subscription economy by end-user in 2025, driven by the widespread shift from one-time software purchases to recurring subscription models. According to the WIPO Global Innovation Index 2025, global software spending reached USD 675 billion in 2024, up from USD 454 billion in 2020, representing nearly 50% growth.
The United States ranked 1st globally in software spending as a share of GDP, highlighting the growing dependence on subscription-based software. In addition, UNCTAD reported that international trade in digitally deliverable products increased by 10% year-over-year in 2025, matching the growth recorded in 2024.
Media & Entertainment is projected to be the fastest-growing end-user segment in the subscription economy as consumers continue shifting toward digital streaming services. According to Omdia’s 2025 TV & Video Market Data, online video subscriptions accounted for 68.4% of the world’s 3.3 billion TV and video subscriptions. The rapid expansion of streaming platforms into live sports, gaming, and audio content is attracting more paying users while traditional pay-TV subscriptions continue to decline.
Customer Type Analysis
Large enterprises held a dominant 58.70% share of the subscription economy market because they generate the highest recurring revenue through multi-user, multi-year software subscriptions. According to Eurostat’s Cloud Computing Statistics 2025, cloud adoption among large EU enterprises reached 79%, compared with the overall enterprise average of 52.7%. Large organizations typically use multiple subscription-based platforms, including ERP, CRM, HR, cybersecurity, and analytics solutions.
SMEs are projected to register the fastest growth during the forecast period due to their large untapped market potential and increasing digital adoption. According to the International Finance Corporation (IFC), MSMEs represent more than 90% of businesses worldwide, contribute around 50% of global GDP, and provide 70% of global employment.
The OECD’s AI Adoption by SMEs (December 2025) report states that cloud adoption among SMEs exceeded 50% in 2024, while AI and advanced SaaS adoption among small businesses with 10–49 employees remained only 11.9%. As software providers introduce lower-cost and flexible subscription plans, SMEs are adopting digital subscription services at a faster pace, supporting strong future market growth.
Engagement Type Analysis
Monthly Subscriptions accounted for the largest 46.80% share of the subscription economy market because they provide a balanced model for both consumers and service providers. Monthly billing is the standard pricing format across telecom, software, streaming, and other digital services, offering affordable payments while ensuring steady recurring revenue.
According to the Telecom Regulatory Authority of India (TRAI), India’s telephone subscriber base reached 1,330.58 million by March 2026, up 10.81% year-over-year, while internet subscribers totaled 1,092.79 million, with most users paying through monthly plans. Additionally, Barclays UK Subscription Economy Research (2025) reported that 88% of UK consumers have at least one active subscription and spend an average of £50.60 per month, highlighting the widespread adoption of monthly billing across digital services.
The 2025 International Labour Organization (ILO) report on platform work highlights that real-time, on-demand digital services have become a mainstream consumer preference. Expanding internet connectivity is further supporting this trend. According to TRAI, India added 63.69 million new internet subscribers between December 2025 and March 2026, creating a larger base of first-time digital users who are more likely to choose flexible, pay-as-you-use subscription models over fixed monthly plans.
Key Market Segments
By Subscription Type
- SaaS Subscriptions
- Subscription Boxes (Physical Goods)
- Media & Streaming Subscriptions
- Subscription Services (Fitness, Education, etc.)
By Business Model
-
Business-to-Business (B2B)
-
Business-to-Consumer (B2C)
-
Hybrid Models
By Payment Model
- Recurring Fixed Subscription
- Usage-Based (Pay-as-you-go)
-
Freemium-to-Paid Conversion
By Platform Type
-
Subscription Management Platforms
-
Billing & Revenue Management Systems
-
Customer Retention & Analytics Tools
-
Payment Gateways
By End User Industry
-
IT & Software (SaaS)
-
Media & Entertainment
-
Retail & E-commerce
-
Healthcare
-
Education & EdTech
By Customer Type
-
Enterprises
-
SMEs
-
Individual Consumers
By Engagement Type
-
Monthly Subscriptions
-
Annual Subscriptions
-
On-demand Subscriptions
Driver
Enterprise cloud adoption continues to be the primary growth driver for the Subscription Economy by expanding recurring software revenue across industries. Unlike one-time software licenses, cloud platforms generate predictable subscription income through multi-user and multi-module deployments.
According to Eurostat, 52.7% of EU enterprises used paid cloud computing services in 2025, up 7.4 percentage points from 2023. Among cloud users, 85.2% used cloud for email, 71.7% for office software, 71.5% for file storage, 65.5% for security software, 58.2% for finance and accounting, and 30.1% for ERP applications.
Artificial intelligence is further strengthening the Subscription Economy by transforming traditional pricing models into hybrid subscription and usage-based revenue structures. OECD data show that 20.2% of businesses used AI in 2025, up from 14.2% in 2024 and 8.7% in 2023.
AI adoption was highest among ICT companies at 57.3%. Meanwhile, the International Energy Agency (IEA) estimated global data center electricity consumption at around 415 TWh in 2024, increasing by 12% annually over the previous five years and projected to reach approximately 945 TWh by 2030.
| Driver | (~) % Impact on CAGR | Geographic Relevance | Impact Timeline |
|---|---|---|---|
| Enterprise cloud software penetration | +2.7% | North America core, EU, developed APAC | Medium term (2-4 years) |
| AI-led usage pricing and upsell | +2.2% | North America core, EU, APAC corridors | Short term (≤ 2 years) |
| SME digitization and affordable SaaS tiers | +1.9% | APAC, Latin America, Africa, EU spill-over | Medium term (2-4 years) |
| Mobile internet expansion and consumer billing scale | +2.4% | APAC core, Africa, South America spill-over | Short term (≤ 2 years) |
| Cross-border digital services trade growth | +1.6% | EU, North America, APAC export hubs | Long term (≥ 4 years) |
| Subscription compliance and trust architecture | +1.1% | U.S., EU, UK, India | Short term (≤ 2 years) |
Restraint
Subscription fatigue is becoming a key challenge for the Subscription Economy as consumers reduce recurring expenses and become more selective about the services they keep. In 2025–2026, consumer surveys showed that “too many subscriptions” was one of the main reasons for cancellations. In the UK, 88% of consumers had at least one active subscription, but many were actively reducing the number of services to control monthly spending.
Even a 1–2 percentage point rise in churn forces companies to spend more on customer acquisition to maintain subscriber numbers, weakening the ideal LTV: CAC ratio of 4:1 to 8:1. As a result, providers are relying more on discounts, bundled offers, and flexible pause or downgrade options, reducing profit margins and lowering market growth by an estimated 2–3 percentage points in mature regions.
Among U.S. and European providers, involuntary churn caused by expired cards, insufficient funds, or payment processing errors represents 20–40% of all cancellations. Even a 1% increase in failed payment rates across hundreds of millions of subscriptions creates millions of unpaid invoices that require repeated payment attempts and additional customer support.
The challenge is greater in emerging markets where payment systems are fragmented across digital wallets, UPI-based payments, and carrier billing. Without strong payment recovery systems and localized billing solutions, the Subscription Economy could lose approximately 1.5–2 percentage points of potential CAGR due to preventable payment failures rather than customer dissatisfaction.
| Restraint | (~) % Impact on CAGR | Geographic Relevance | Impact Timeline |
|---|---|---|---|
| Consumer subscription fatigue & churn | -2.3% | North America core, EU, developed APAC | Short term (≤ 2 years) |
| Payment failures & billing friction | -1.9% | Global, stronger in emerging markets | Short term (≤ 2 years) |
| Regulatory tightening on subscriptions | -1.5% | U.S., EU, UK, India | Medium term (2-4 years) |
| SME budget constraints & digital gaps | -1.8% | APAC, Latin America, Africa, EU periphery | Medium term (2-4 years) |
| Data centre cost inflation for AI | -1.4% | North America, EU, developed APAC | Long term (≥ 4 years) |
| Content & SaaS market saturation | -1.7% | North America, EU, urban APAC | Medium term (2-4 years) |
Opportunity
Hyper-localized micro-subscription tiers represent a strong future opportunity as many digital subscription models are still designed around Western monthly pricing, making them less affordable for users in emerging markets. In Asia Pacific, Africa, and Latin America, a large share of consumers rely on daily or weekly income and prepaid mobile services.
Offering low-cost plans, such as sub-USD 1 weekly passes, daily access, or event-based subscriptions for education, healthcare, entertainment, and productivity services, can significantly expand the addressable market. Over the next 5 to 8 years, these models could unlock an additional 10% to 20% of previously untapped users.
Providers can maintain profitability by offering limited features, such as fewer simultaneous streams, lower cloud storage, or restricted AI usage, while encouraging users to upgrade as their purchasing power grows. This approach is expected to support deeper subscription adoption and could contribute around 2 percentage points to the global market CAGR.
An orchestration platform that combines billing, subscription management, usage tracking, and cancellation into a single interface could generate revenue through a 2% to 3% management fee or a fixed monthly subscription. For enterprises, these platforms can reduce duplicate software spending and shadow IT, delivering 5% to 10% cost savings.
If orchestration platforms achieve 10% to 15% adoption among high-spending households and enterprises by 2030, they could increase the Subscription Economy market CAGR by an additional 1.5 to 2 percentage points through improved customer retention, reduced subscription fatigue, and stronger cross-platform monetization.
| Opportunity | (~) % Potential CAGR Upside | Geographic Relevance | Execution Window |
|---|---|---|---|
| Industrial & B2B non-software subscriptions | +2.4% | North America, EU, APAC industrial hubs | Medium term (2-4 years) |
| AI-native agentic subscription bundles | +2.8% | North America core, EU, advanced APAC | Short term (≤ 2 years) |
| Hyper-localized micro-subscription tiers | +2.1% | APAC emerging, Africa, LatAm | Medium term (2-4 years) |
| Cross-platform subscription orchestration & wallets | +1.9% | North America, EU, global digital natives | Short term (≤ 2 years) |
| M&A roll-ups in fragmented SaaS & creator tools | +2.3% | North America, EU, APAC SaaS corridors | Long term (≥ 4 years) |
| Data-monetization & insights-as-a-subscription | +2.0% | Global, strongest in regulated verticals | Medium term (2-4 years) |
Challenge
Talent shortages in AI and data continue to challenge the Subscription Economy as demand for AI-powered services grows faster than the supply of skilled professionals. AI engineers, data scientists, and machine learning product managers account for only a small share of the global technology workforce, while demand for these roles is increasing by more than 10–15% annually in several regions. At the same time, training and reskilling programs are expanding at a slower pace. AI and data professionals typically earn 30–50% higher salaries than general software engineers, increasing operating costs.
For many mid-sized subscription providers, hiring difficulties can delay AI feature launches by 6–12 months, reduce innovation speed, and increase reliance on third-party AI platforms. As a result, talent shortages are estimated to reduce the market’s potential CAGR by approximately 1.0–1.5 percentage points, particularly for companies with limited financial resources.
Cross-border operations also create additional VAT, GST, and e-invoicing obligations. A mid-sized subscription platform operating in 20–30 countries may spend approximately 3–5% of its operating expenses on legal and compliance activities, while product launches can be delayed by several months due to localization and regulatory approvals. These added costs and slower market expansion are estimated to reduce the market’s long-term CAGR by around 1 percentage point, encouraging companies to prioritize high-value regions and invest in scalable compliance systems.
| Challenge | (~) % CAGR Friction Drag | Geographic Relevance | Mitigation Horizon |
|---|---|---|---|
| Rising CAC & crowded channels | -1.6% | North America core, EU, urban APAC | Medium term (2-4 years) |
| Talent gaps in AI & data | -1.3% | North America, EU, APAC tech hubs | Long term (≥ 4 years) |
| Complex multi-region compliance | -1.1% | U.S., EU regulatory hubs, UK, India | Medium term (2-4 years) |
| Platform dependence & app-store terms | -1.2% | Global mobile ecosystems | Long term (≥ 4 years) |
| Infrastructure & payment fragmentation | -1.0% | APAC corridors, Africa, LatAm | Medium term (2-4 years) |
| Data privacy & trust management | -1.4% | EU, North America, high-reg markets | Long term (≥ 4 years) |
Regional Analysis
North America accounted for 42.10% of the global subscription economy, generating about USD 234.79 billion in 2025, supported by advanced digital infrastructure, high enterprise IT spending, and strong consumer demand for subscription services. According to the U.S. Bureau of Economic Analysis, the U.S. digital economy contributed nearly USD 2.57 trillion to the national economy and has been growing at more than three times the pace of overall GDP.
This rapid digital expansion continues to increase demand for subscription-based software, cloud platforms, digital media, and online services. The International Telecommunication Union (ITU) reported nearly 6 billion internet users worldwide with 74% internet penetration in 2025, while GSMA recorded 5.8 billion unique mobile subscribers, with mobile technologies contributing 5.8% of global GDP. North America benefits from some of the world’s highest digital connectivity and spending levels, supporting recurring subscription revenue across consumer and enterprise markets.
The region also benefits from its leadership in digital content, cloud computing, and software services. North America’s media and entertainment industry reached approximately USD 780.6 billion in 2025 and is projected to expand at a CAGR of about 8.6% through 2035. The presence of major streaming platforms, SaaS providers, cloud companies, and app ecosystems in the U.S. and Canada drives a large share of global subscription billing.
AI adoption continues to strengthen subscription demand. According to the OECD, 20.2% of businesses across member countries used AI tools in 2025, with the information and communication sector leading adoption. As businesses increasingly adopt AI, cloud software, analytics, and digital content through subscription models, North America is expected to maintain its leading position in the global subscription economy.
Key Regions and Countries
- North America
- US
- Canada
- Europe
- Germany
- France
- The UK
- Spain
- Italy
- Rest of Europe
- Asia Pacific
- China
- Japan
- South Korea
- India
- Australia
- Singapore
- Rest of Asia Pacific
- Latin America
- Brazil
- Mexico
- Rest of Latin America
- Middle East & Africa
- South Africa
- Saudi Arabia
- UAE
- Rest of MEA
Key Player Analysis
The Subscription Economy market is dominated by Tier-1 companies that generate substantial recurring revenue through software, cloud, and digital media subscriptions. Adobe reported USD 4.25 billion in Creative & Marketing Professionals subscription revenue in FY2025, up 11% year over year, while total Q2 FY2025 revenue reached USD 5.87 billion, supported by AI-powered Creative Cloud services.
Microsoft recorded 14% growth in its Productivity & Business Processes segment, adding USD 3.6 billion, while Microsoft 365 Commercial products and cloud services increased by USD 2.8 billion (15%). Salesforce generated USD 37.9 billion in FY2025 revenue, growing 9%, with guidance of USD 40.8 billion for FY2026.
In consumer subscriptions, Netflix reported USD 12.05 billion in Q4 2025 revenue, up 17.6%, alongside more than USD 1.5 billion in advertising revenue. Spotify reached 290 million paid subscribers, generating €4.013 billion (about USD 4.67 billion) in Premium revenue and €2.2 billion (about USD 2.5 billion) in annual operating income.
Apple expanded its services business from under USD 20 billion in 2015 to about USD 109 billion in 2025, supported by more than 1 billion paid subscriptions across 2.3 billion active devices. Together with Alphabet and Amazon, these companies account for an estimated 50–60% of the global Subscription Economy market.
Tier-2 companies strengthen the market by providing subscription management, billing, CRM, and SaaS infrastructure. Shopify generates several billion dollars annually from subscription solutions, while HubSpot continues to achieve high-teen to low-twenties recurring revenue growth through its integrated CRM platform. Zoom Video Communications maintains multi-billion-dollar annual revenue driven by enterprise subscriptions.
Infrastructure providers such as Zuora, Chargebee, Recurly, and Paddle support thousands of digital businesses with billing, tax, invoicing, and revenue management solutions. Individually, these companies generate approximately USD 0.1–5 billion in annual revenue, and collectively support an estimated 10–15% of the global Subscription Economy’s value through subscription infrastructure and monetization services.
Top Key Players in the Market
- Adobe
- Microsoft
- Salesforce
- Amazon (Prime ecosystem)
- Netflix
- Spotify
- Apple
- Google (Google One / Workspace)
- Zuora
- Recurly
- Chargebee
- Paddle
- Shopify
- HubSpot
- Zoom Video Communications
- Others
Recent Developments
- In February 2025, Microsoft announced the integration of cloud gaming into Xbox Game Pass Ultimate across more regions. This update enables users to stream games without downloading, aligning with the broader shift towards flexibility in digital subscriptions.
- In March 2025, Salesforce completed the acquisition of Spiff, a leading sales commission platform. This acquisition is intended to strengthen Salesforce’s subscription-based CRM offerings by automating compensation management for its clients.
- In October 2024, Adobe launched new generative AI tools across its Creative Cloud suite, available under its existing subscription model. These features are designed to boost productivity and creativity for users of Photoshop, Illustrator, and Premiere Pro.
- In November 2024, Netflix expanded its gaming footprint by acquiring the Finnish game studio Next Games. This move was aimed at strengthening Netflix’s in-house gaming capabilities and diversifying its content subscription offerings beyond movies and series.
Report Scope
| Report Features | Description |
|---|---|
| Market Value (2025) | USD 557.7 Bn |
| Forecast Revenue (2035) | USD 2,516.5 Bn |
| CAGR (2025-2035) | 16.3% |
| Base Year for Estimation | 2025 |
| Historic Period | 2020-2024 |
| Forecast Period | 2026-2035 |
| Report Coverage | Revenue forecast, AI impact on market trends, Share Insights, Company ranking, competitive landscape, Recent Developments, Market Dynamics and Emerging Trends |
| Segments Covered | By Subscription Type [SaaS Subscriptions, Subscription Boxes (Physical Goods), Media & Streaming Subscriptions, Subscription Services (Fitness, Education, etc.)] By Business Model [Business-to-Business (B2B), Business-to-Consumer (B2C), Hybrid Models] By Payment Model [Recurring Fixed Subscription, Usage-Based (Pay-as-you-go), Freemium-to-Paid Conversion] By Platform Type [Subscription Management Platforms, Billing & Revenue Management Systems, Customer Retention & Analytics Tools, Payment Gateways] By End User Industry [IT & Software (SaaS), Media & Entertainment, Retail & E-commerce, Healthcare, Education & EdTech] By Customer Type [Enterprises, SMEs, Individual Consumers] Bu Engagement Type [Monthly Subscriptions, Annual Subscriptions, On-demand Subscriptions] |
| Regional Analysis | North America – US, Canada; Europe – Germany, France, The UK, Spain, Italy, Russia, Netherlands, Rest of Europe; Asia Pacific – China, Japan, South Korea, India, New Zealand, Singapore, Thailand, Vietnam, Rest of APAC; Latin America – Brazil, Mexico, Rest of Latin America; Middle East & Africa – South Africa, Saudi Arabia, UAE, Rest of MEA |
| Competitive Landscape | Adobe, Microsoft, Salesforce, Amazon (Prime ecosystem), Netflix, Spotify, Apple, Google (Google One / Workspace), Zuora, Recurly, Chargebee, Paddle, Shopify, HubSpot, Zoom Video Communications and Others |
| Customization Scope | Customization for segments and region/country-level will be provided. Moreover, additional customization can be done based on the requirements. |
| Purchase Options | We have three licenses to opt for: Single User License, Multi-User License (Up to 5 Users), Corporate Use License (Unlimited Users and Printable PDF) |





























