


Report Overview
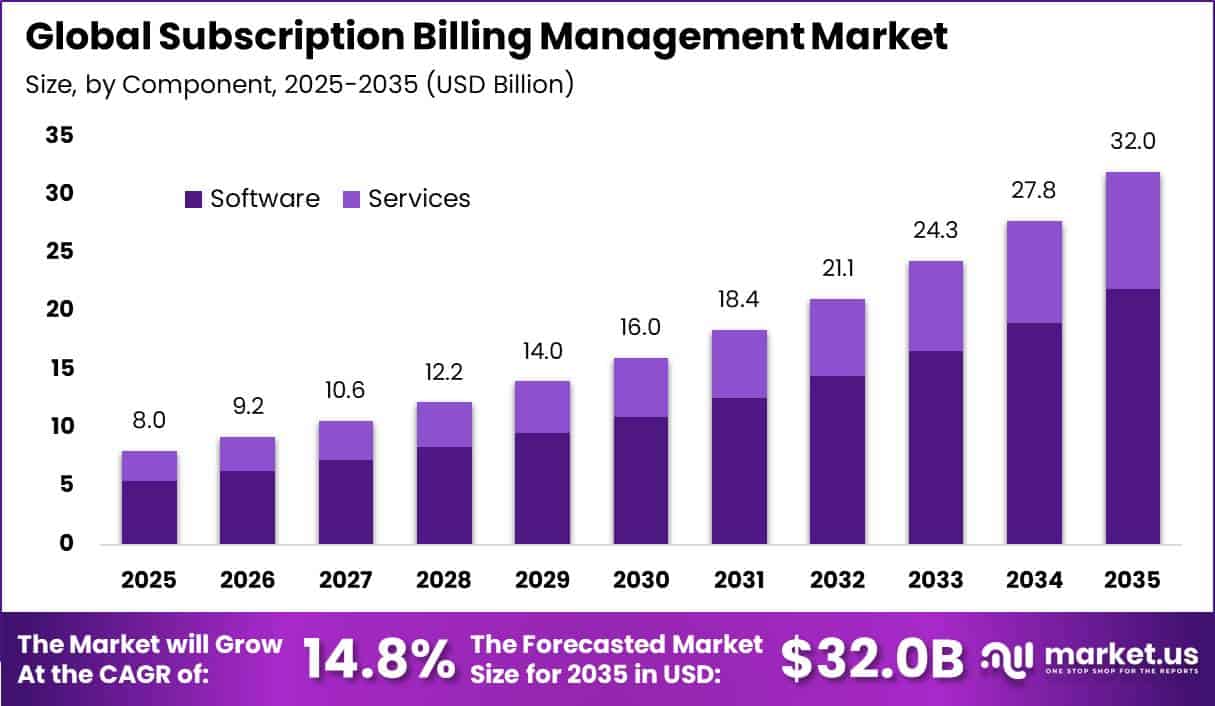
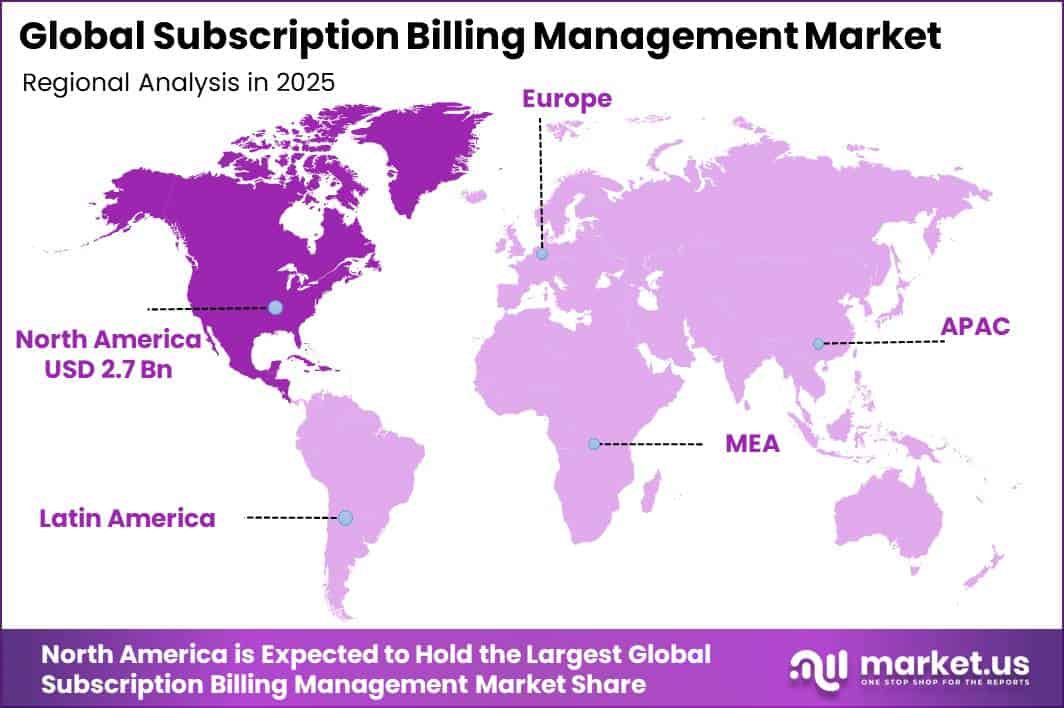
In 2025, the Global Subscription Billing Management Market was valued at USD 8.0 billion. The market is projected to grow at a CAGR of 14.8% during 2026–2035, reaching approximately USD 32.0 billion by 2035. North America dominated the global market in 2025, accounting for more than 33.2% of the total market share and generating approximately USD 2.7 billion in revenue.
Growth is supported by the increasing use of recurring-payment models across retail, media, software, and service industries. These platforms help businesses manage pricing, trials, renewals, payments, taxes, failed transactions, and customer churn. The U.S. Census Bureau reported that U.S. retail e-commerce sales reached USD 1.2 trillion in 2025, increasing 5.4% from 2024 and accounting for 16.4% of total retail sales.
In addition, U.S. consumer spending on subscription streaming reached USD 57.5 billion in 2025, rising 19.8% year on year, showing strong demand for automated recurring billing and revenue management systems.
The U.S. recorded 5.6 million business applications in 2025, including approximately 1.7 million high-propensity applications. As more businesses adopt monthly, annual, usage-based, and tiered pricing models, demand for billing automation, payment recovery, compliance management, and revenue reporting is expected to rise.
Key Takeaway
- The Subscription Billing Management Market was valued at USD 8.0 billion in 2025 and is projected to reach USD 32.0 billion by 2035, growing at a CAGR of 14.8%.
- The software segment dominates by component with a 68.5% share.
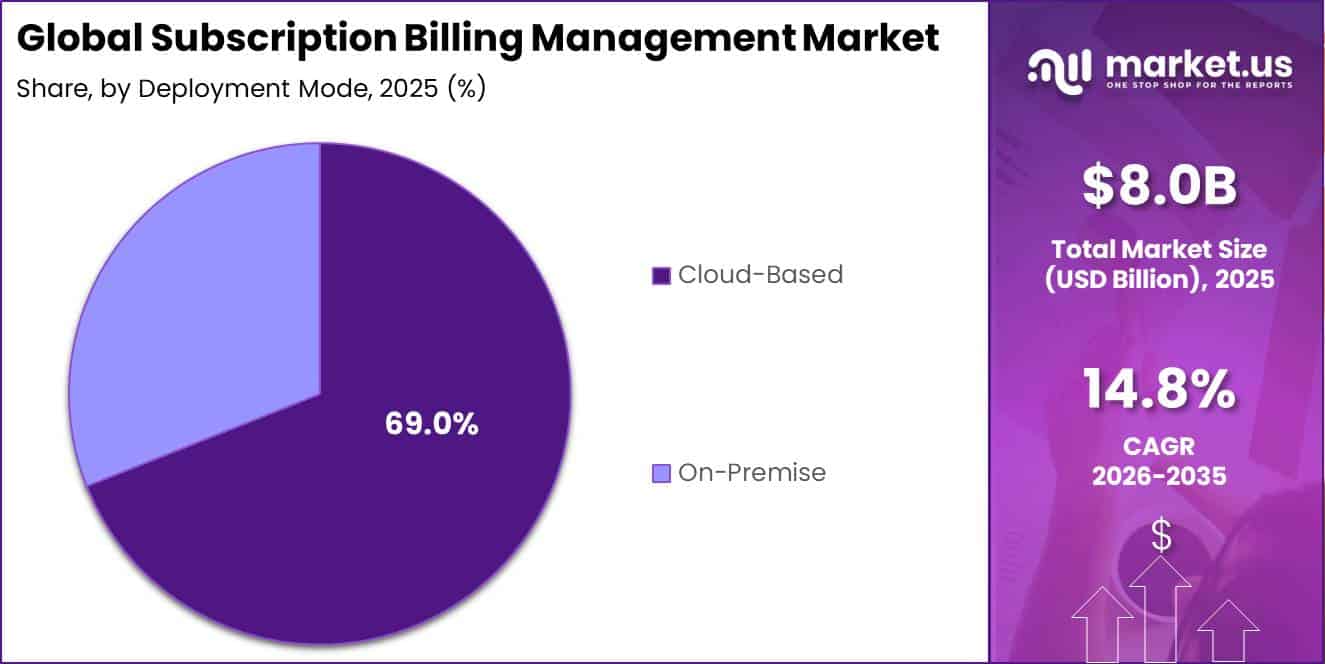
- The cloud-based deployment segment leads with a 69.0% share.
- Large enterprises lead by organization size with a 65.4% share.
- IT and telecommunications lead by industry vertical with a 23.1% share.
- North America led the market in 2025 with a 33.2% share and approximately USD 2.7 billion in revenue.
By Component
The Software segment dominates the Subscription Billing Management Market with a 68.5% share, supported by the growing need for automated and scalable recurring revenue management. Subscription billing software manages important activities such as customer onboarding, plan changes, usage tracking, invoice generation, tax calculation, payment processing, renewals, failed-payment recovery, and revenue reporting.
Demand is rising as more companies adopt cloud-based applications and offer subscription services across different markets. Eurostat reported that 52.7% of EU enterprises used paid cloud computing services in 2025, an increase of 7.4 percentage points from 2023. Cloud adoption was even higher among large enterprises, reaching 84.7%.
In addition, 47% of EU enterprises used intermediate or advanced cloud services for finance, accounting, enterprise resource planning, customer relationship management, security, and application development. These cloud-based activities often involve recurring or usage-based charges that are difficult to manage through spreadsheets or basic invoicing systems.
By Deployment Mode
The Cloud-Based deployment segment leads the Subscription Billing Management Market with a 69.0% share, supported by the need to manage recurring billing across multiple customers, payment channels, locations, and time zones.
According to the OECD, 49% of firms with at least 10 employees across member countries used cloud computing in 2023, while adoption levels ranged from 16% to 78% across different countries. This growing cloud adoption creates a strong foundation for subscription billing platforms. Cloud deployment also allows businesses to increase system capacity as subscriber numbers grow, connect easily with digital payment gateways, and support remote finance and customer-service teams.
By Organization Size
The Large Enterprises segment leads the Subscription Billing Management Market with a 65.4% share, mainly because large companies handle complex billing across high customer volumes, multiple products, countries, payment methods, and tax structures.
Eurostat reported that 88.7% of large EU enterprises used enterprise resource planning software in 2025, compared with 41.1% of small enterprises. Customer relationship management software adoption among large enterprises also reached 65.4%, compared with 24.7% among small firms.
By Industry Vertical
The IT and Telecommunications segment leads the Subscription Billing Management Market with a 23.1% share, mainly because these industries depend heavily on recurring and high-volume billing. Telecom companies charge customers regularly for mobile services, fixed broadband, data, voice, roaming, and other value-added services.
IT providers are increasingly offering cloud software, storage, cybersecurity, and computing services through subscription and usage-based pricing models. According to the OECD, mobile-broadband subscriptions across member countries reached 1.9 billion by mid-2024, increasing 16% from June 2021, while fixed-broadband subscriptions reached 504 million.
In addition, 5G subscriptions increased 48% in one year and represented 33% of total mobile subscriptions across reporting OECD markets. Managing such a large number of accounts requires accurate handling of different plans, usage levels, discounts, taxes, and service changes.
Key Market Segments
By Component
- Software
- Services
By Deployment Mode
- Cloud-Based
- On-Premise
By Organization Size
- Small and Medium-Sized Enterprises
- Large Enterprises
By Industry Vertical
- IT and Telecommunications
- BFSI
- Retail and E-Commerce
- Healthcare
- Media and Entertainment
- Other Industry Verticals
Geopolitical Impact Analysis
The Subscription Billing Management Market is influenced more by the cost and reliability of digital infrastructure than by physical product distribution. Billing platform providers depend on servers, networking equipment, storage systems, semiconductors, and data-centre capacity, with many of these components linked to Asian supply chains.
UNCTAD reported that disruptions in the Red Sea and Suez routes increased Shanghai–Northern Europe container freight rates to USD 2,648 per TEU on 9 February 2024, which was 256% higher than early-November 2023 levels. The broader Shanghai spot freight-rate average also increased 122% between early December and early February.
Higher freight costs, war-risk insurance, and longer shipping routes around the Cape of Good Hope can increase the cost and delivery time of servers, routers, cooling systems, and power equipment used by cloud providers. This can raise infrastructure and hosting expenses for subscription billing companies, especially when expanding data-centre capacity or entering new regions.
Energy prices create another cost pressure because billing platforms must process invoices, payments, usage records, and revenue data continuously. The International Energy Agency reported that average wholesale electricity prices in the European Union and United States increased by around 30–40% year on year during the first half of 2025.
Regional Analysis
North America dominated the Subscription Billing Management Market in 2025, holding 33.2% of global revenue and generating approximately USD 2.7 billion in market value. The region benefits from a strong presence of cloud software companies, telecom operators, streaming platforms, digital media firms, and online retailers using monthly, annual, tiered, and usage-based pricing models.
The United States remains the main demand centre. According to the U.S. Census Bureau, retail e-commerce sales reached USD 365.2 billion in the fourth quarter of 2025, rising 5.6% from the previous quarter and accounting for 18.3% of total retail sales.
This large digital-sales base increases demand for payment processing, subscription renewals, invoice generation, tax management, and failed-payment recovery. Canada also supports regional growth, as Statistics Canada reported that 25.7% of businesses adopting artificial intelligence purchased cloud services or cloud storage in the second quarter of 2025, compared with 16.1% a year earlier.
Asia Pacific is expected to be the fastest-growing region as internet access, mobile commerce, digital services, and cloud adoption expand. The International Telecommunication Union estimated that 6.0 billion people worldwide were online in 2025. Growing demand from telecom, gaming, streaming, online education, and software companies is increasing the need for billing platforms that support local currencies, digital wallets, multiple tax systems, high transaction volumes, and flexible subscription plans.
Key Regions and Countries
North America
- US
- Canada
Europe
- Germany
- France
- The UK
- Spain
- Italy
- Rest of Europe
Asia Pacific
- China
- Japan
- South Korea
- India
- Australia
- Rest of APAC
Latin America
- Brazil
- Mexico
- Rest of Latin America
Middle East & Africa
- GCC
- South Africa
- Rest of MEA
Market Dynamics
Drivers
| Driver | (~) % CAGR | Geographic Relevance | Impact Timeline |
|---|---|---|---|
| Usage-Based SaaS Pricing | +2.4% | Global | Short term (2 years or less) |
| Telecom Monetization Modernization | +1.8% | North America, Europe, Asia Pacific | Medium term (2 to 4 years) |
| Digital-Service Subscription Growth | +1.5% | Global | Short term (2 years or less) |
| Cloud Finance Integration | +1.3% | North America and Europe | Medium term (2 to 4 years) |
| Cross-Border Digital Commerce | +1.0% | Asia Pacific, Europe, Middle East | Medium term (2 to 4 years) |
Usage-Based SaaS Pricing
Usage-based and hybrid pricing is a major market driver because it creates recurring billing for users, transactions, storage, API calls, and consumption levels. EU enterprise AI adoption stood at only 8% in 2023, while the 2030 target is for 75% of enterprises to use cloud, AI, or big-data services.
Eurostat reported that 45.2% of EU enterprises used paid cloud services in 2023, while OECD data showed cloud adoption reached 49% among firms with at least 10 employees. Rising usage-based billing can increase transaction volumes and is estimated to add around 2.4% to the baseline CAGR through more accurate invoicing, payment recovery, and recurring revenue recognition.
Restraints
| Restraint | (~) % CAGR | Geographic Relevance | Impact Timeline |
|---|---|---|---|
| Payment Compliance Costs | -2.1% | Global | Short term (2 years or less) |
| Enterprise Budget Freezes | -1.5% | North America and Europe | Short term (2 years or less) |
| Legacy Contract Lock-In | -1.2% | Global | Medium term (2 to 4 years) |
| Data Localization Mandates | -1.0% | Asia Pacific, Europe, Middle East | Medium term (2 to 4 years) |
| Merchant Fee Pressure | -0.8% | Global | Short term (2 years or less) |
Payment Compliance Costs
Payment-compliance costs remain an immediate market restraint because subscription billing platforms manage card data, recurring payments, refunds, and customer information across different countries. PCI DSS version 4.0.1 required future-dated controls, including stronger authentication, payment-page security, and risk management.
The standard included 64 new or updated requirements, with 51 subject to the 2025 implementation deadline. The European Commission also reported that only 32% of European companies had adopted data analytics by 2023, showing integration gaps among smaller businesses.
Higher compliance, security testing, legal review, and staffing costs can delay adoption and are estimated to reduce achievable CAGR by 2.1% from the 14.8% baseline.
Challenges
| Challenge | (~) % CAGR | Geographic Relevance | Mitigation Horizon |
|---|---|---|---|
| Multi-System Data Reconciliation | -1.8% | Global | Medium term (2 to 4 years) |
| Billing Talent Scarcity | -1.3% | North America and Europe | Medium term (2 to 4 years) |
| Cross-Border Tax Complexity | -1.1% | Global | Long term (4 years or more) |
| Payment Failure Management | -0.9% | Global | Short term (2 years or less) |
| Cloud Service Concentration | -0.7% | Global | Medium term (2 to 4 years) |
Multi-System Data Reconciliation
Multi-system data reconciliation remains a major challenge because subscription revenue must match product usage, customer contracts, payment records, tax calculations, ledger entries, and revenue-recognition schedules. Cloud computing was used by 49% of firms with at least 10 employees, while EU enterprise AI adoption stood at only 8% in 2023.
Eurostat also reported that 45.2% of EU enterprises purchased cloud services in 2023, showing that cloud systems still operate alongside manual and legacy finance processes. This integration burden can slow implementation and reduce market growth by an estimated 1.8%, making standardized connectors, automated reconciliation, and stronger partner networks increasingly important.
Opportunities
| Opportunity | (~) % CAGR | Geographic Relevance | Execution Window |
|---|---|---|---|
| Embedded Billing for AI | +2.2% | North America, Europe, Asia Pacific | Medium term (2 to 4 years) |
| Utility Subscription Platforms | +1.6% | Europe, North America, Asia Pacific | Long term (4 years or more) |
| Mid-Market ERP Partnerships | +1.4% | Global | Medium term (2 to 4 years) |
| Merchant-of-Record Expansion | +1.2% | Asia Pacific, Latin America, Middle East | Medium term (2 to 4 years) |
| Vertical Platform Consolidation | +0.9% | Global | Long term (4 years or more) |
Embedded Billing for AI
Embedded billing for AI services remains an emerging opportunity because many providers still use pilots, fixed contracts, or unmetered bundles instead of charging for tokens, model calls, inference time, and storage. EU enterprise AI adoption increased from 7.6% in 2021 to only 8% in 2023, showing a large gap before the 2030 digital target. Cloud adoption reached 49% among firms with at least 10 employees.
The opportunity is supported by a growing digital user base, with 6.0 billion people online globally in 2025. By adding metering, entitlement control, payment recovery, and revenue recognition into AI platforms, vendors can improve billing efficiency and capture an estimated 2.2% CAGR upside above the 14.8% baseline through higher-value transaction-based revenue.
Key Players Analysis
SAP and Oracle lead the Subscription Billing Management Market because of their large enterprise software portfolios, global customer bases, and strong cloud-finance integration. SAP generated €21.02 billion in cloud revenue in 2025, increasing 23%, while Cloud ERP Suite revenue reached €18.12 billion, up 28%. The company also invested €6.6 billion in R&D, equal to 18.0% of total revenue, supporting billing, contract management, revenue recognition, and finance automation.
Oracle generated USD 44.03 billion from cloud services and license support in fiscal 2025, representing 76.7% of its USD 57.4 billion total revenue, while R&D spending reached USD 9.9 billion. Oracle Fusion Cloud ERP SaaS revenue reached USD 1.0 billion in Q4, rising 22%.
Together, SAP and Oracle are estimated to represent around 35–45% of enterprise-grade subscription billing spending, although standalone billing revenue is not separately reported. Tier-2 companies such as Zuora, Chargebee, Recurly, Aria Systems, Zoho, BillingPlatform, FastSpring, and Maxio compete through specialized recurring-billing tools, quicker deployment, and strong SaaS support.
These vendors focus on usage billing, plan changes, dunning, tax management, subscription analytics, and payment orchestration. This Tier-2 group is estimated to account for around 25–35% of specialized billing-platform demand, while the remaining market is served by regional vendors and internally developed systems.
Top Key Players in the Market
- SAP SE
- Oracle Corporation
- Zuora Inc.
- Chargebee
- Recurly, Inc.
- Aria Systems, Inc.
- Zoho Corporation
- BillingPlatform
- FastSpring
- Maxio
Recent Developments
- In 2025, Silver Lake and GIC completed the acquisition of Zuora for USD 1.7 billion on February 14. Zuora shareholders received USD 10.00 per share in cash, and the company stopped trading on the New York Stock Exchange after becoming privately held.
- In 2025, Maxio acquired RevOps.io in March and launched, expanding its platform from recurring billing and revenue management into configure-price-quote and complete quote-to-cash automation. Maxio served more than 2,000 customers and managed around USD 17 billion in billings.
Report Scope
| Report Features | Description |
|---|---|
| Market Value (2025) | USD 8.0 Billion |
| Forecast Revenue (2035) | USD 32.0 Billion |
| CAGR (2026-2035) | 14.8% |
| Base Year for Estimation | 2025 |
| Historic Period | 2020-2024 |
| Forecast Period | 2026-2035 |
| Report Coverage | Revenue Forecast, Market Dynamics, Competitive Landscape, Recent Developments |
| Segments Covered | By Component (Software, Services); By Deployment Mode (Cloud-Based, On-Premise); By Organization Size (Small and Medium-Sized Enterprises, Large Enterprises); By Industry Vertical (IT and Telecommunications, BFSI, Retail and E-Commerce, Healthcare, Media and Entertainment, Other Industry Verticals) |
| Regional Analysis | North America – US, Canada; Europe – Germany, France, The UK, Spain, Italy, Rest of Europe; Asia Pacific – China, Japan, South Korea, India, Australia, Singapore, Rest of APAC; Latin America – Brazil, Mexico, Rest of Latin America; Middle East & Africa – GCC, South Africa, Rest of MEA |
| Competitive Landscape | SAP SE, Oracle Corporation, Zuora Inc., Chargebee, Recurly, Inc., Aria Systems, Inc., Zoho Corporation, BillingPlatform, FastSpring, Maxio |
| Customization Scope | We will provide customization for segments and region/country levels. Moreover, additional customization can be done based on the requirements. |
| Purchase Options | We have three licenses to opt for: Single User License, Multi-User License (Up to 5 Users), Corporate Use License (Unlimited Users and Printable PDF) |





























