Spectrum Heatmap Analytics Market By Component (Software (Spectrum Data Processing Software, Heatmap Visualization Software), Hardware (Spectrum Analyzers, Radio Frequency Sensors), Services (Spectrum Monitoring Services, Data Analysis and Reporting Services)), By Deployment Mode (On-Premises, Cloud), By Enterprise Size (Small and Medium Enterprises, Large Enterprises), By Application (Telecommunications, Healthcare, Defense and Security ), By End-User (Telecom Operators, Research Institutes, Government Agencies), By Regional Analysis, Global Trends and Opportunity, Future Outlook By 2026-2035
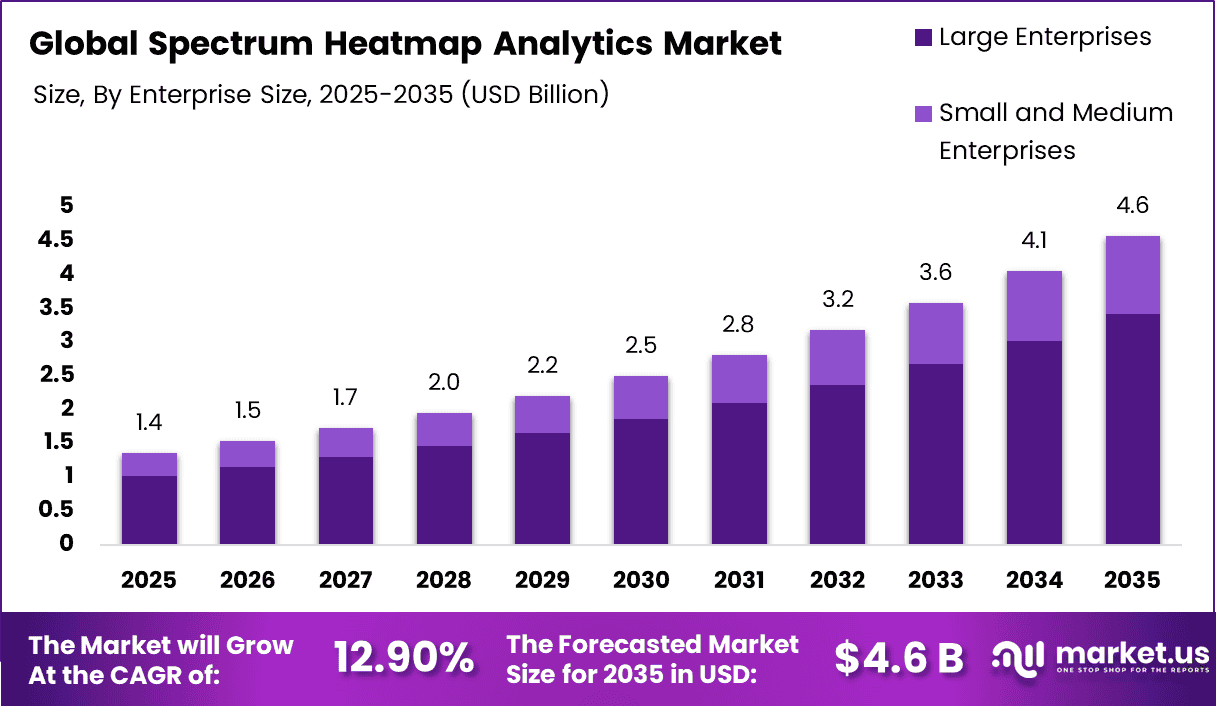
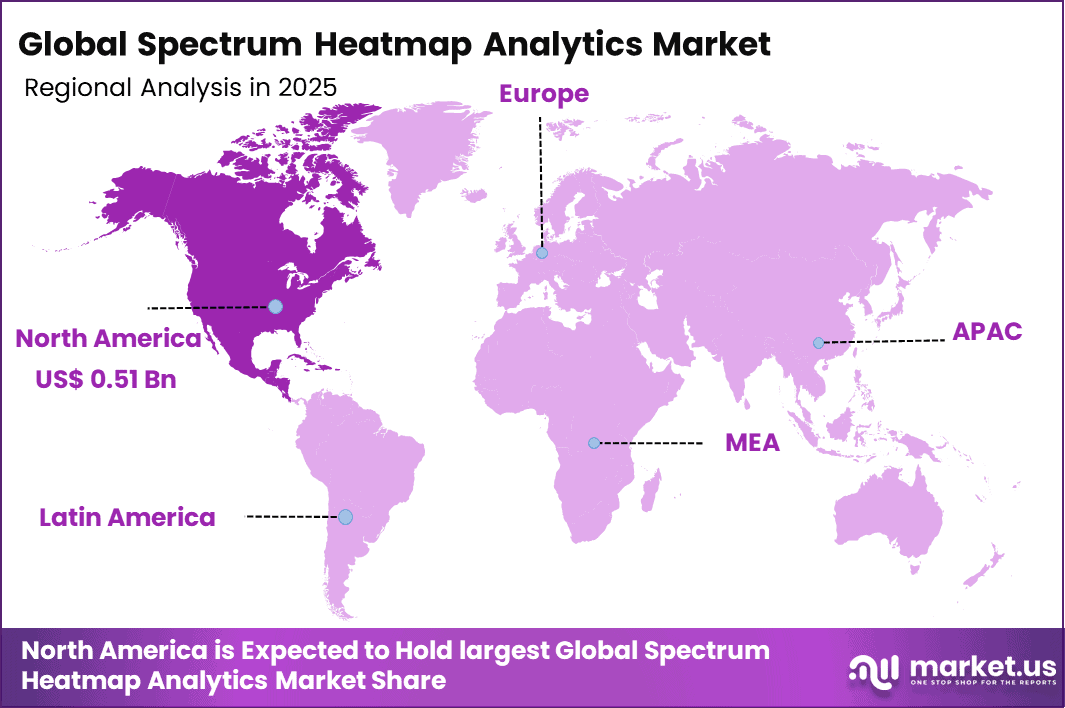
The Global Spectrum Heatmap Analytics Market generated USD 1.4 billion in 2025 and is predicted to register growth from USD 1.5 billion in 2026 to about USD 4.6 billion by 2035, recording a CAGR of 12.90% throughout the forecast span. In 2025, North America held a dominant market position, capturing more than a 37.5% share, holding USD 0.51 Billion revenue.
Top Market Takeaways
Software commands 45.3% market share, delivering real-time RF visualization, interference classification, and predictive capacity planning across crowded frequency bands.
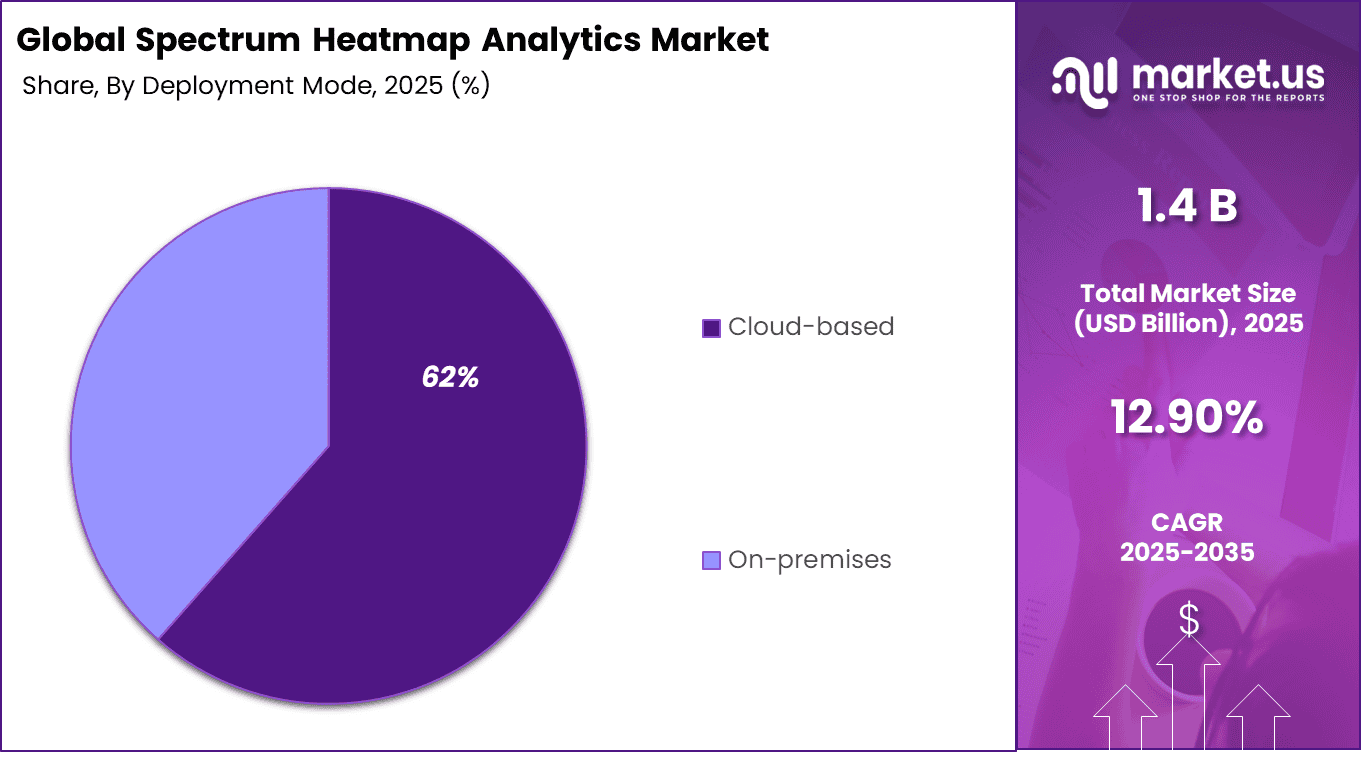
Cloud-based deployment captures 61.5%, enabling elastic sensor scaling, collaborative dashboards, and AI-driven anomaly detection without on-premises hardware.
Large enterprises hold 74.6%, leveraging enterprise-grade analytics for network planning, regulatory reporting, and dynamic spectrum sharing orchestration.
Telecommunications applications claim 38.4%, powering base station site selection, beamforming optimization, and carrier aggregation validation through geospatial insights.
Telecom operators represent 47.1%, utilizing heatmap tools for license compliance, white space identification, and CBRS/LSA deployment automation.
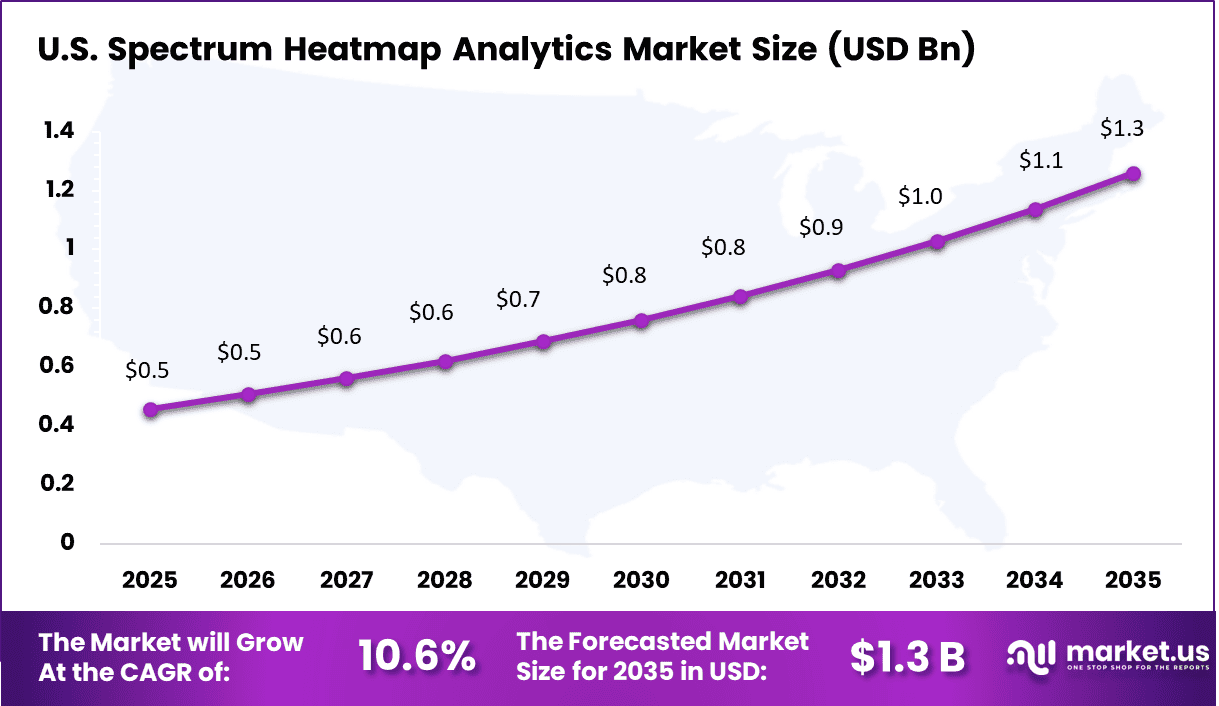
North America drives 37.5% global value, with U.S. market at USD 0.46 billion and 10.6% CAGR, fueled by FCC spectrum auctions and private 5G networks.
Spectrum Heatmap Analytics market refers to software and monitoring solutions that visualize radio frequency activity, signal strength, interference patterns, and spectrum usage across a specific area in the form of heatmaps.
These tools help users understand how wireless signals behave across indoor and outdoor environments and support better planning, monitoring, and troubleshooting of spectrum dependent networks. The market is gaining importance as wireless systems become more dense and operators need clearer visibility into how spectrum is being used across telecom, public safety, industrial, and private network environments.
One of the main factors driving this market is the growing complexity of wireless environments. As more devices, networks, and services operate across limited spectrum resources, organizations need better tools to identify congestion, weak coverage zones, and interference risks.
Another important driver is the rising need for more efficient spectrum planning and performance monitoring, especially in environments where service quality, signal reliability, and network coordination are critical.
Demand for spectrum heatmap analytics is increasing among telecom operators, regulators, network planners, defense communication users, and enterprise wireless teams that need a clearer view of spectrum conditions across different locations.
These buyers want practical tools that can support coverage analysis, interference detection, planning decisions, and operational monitoring. Demand is also rising because wireless infrastructure is expanding and spectrum visibility has become more important for both performance management and regulatory control.
Drivers Impact Analysis
Driver Factor
Impact on CAGR Forecast (~%)
Geographic Relevance
Impact Timeline
Strategic Effect
Rising demand for efficient spectrum utilization
+1.6%
North America, Europe
Short to Mid Term
Enhances network performance and bandwidth efficiency
Expansion of 5G and advanced wireless networks
+1.8%
Global
Mid Term
Drives need for real-time spectrum monitoring
Increasing adoption in defense and public safety sectors
+1.3%
North America, APAC
Mid to Long Term
Strengthens surveillance and communication systems
Growth in smart city infrastructure
+1.2%
APAC, Europe
Mid to Long Term
Expands use in urban connectivity management
Integration with AI-based spectrum analysis tools
+1.4%
Global
Mid Term
Improves predictive analytics and optimization
Restraints Impact Analysis
Restraint Factor
Impact on CAGR Forecast (~%)
Geographic Relevance
Impact Timeline
Strategic Limitation
High cost of deployment and spectrum monitoring equipment
-1.2%
Global
Short Term
Limits adoption among smaller operators
Regulatory complexities and licensing requirements
-1.1%
Europe, North America
Mid to Long Term
Slows implementation and expansion
Data security and privacy concerns
-0.9%
Global
Mid Term
Increases compliance burden
Limited technical expertise in emerging markets
-0.8%
APAC, Latin America
Mid Term
Reduces operational efficiency
Integration challenges with legacy telecom infrastructure
-0.7%
Global
Mid Term
Delays system deployment
By Component Analysis
Software accounted for 45.3% of the Spectrum Heatmap Analytics Market. This segment leads because organizations rely on software platforms to visualize spectrum usage, analyze interference patterns, and generate actionable insights. These tools help improve decision making by providing clear heatmap representations of frequency utilization.
The segment is also supported by increasing demand for real time analytics and efficient spectrum management. Software solutions enable faster data processing, easier integration with monitoring systems, and better visualization capabilities, which strengthens their adoption across telecom environments.
By Deployment Mode Analysis
Cloud based deployment held 62% of the market. This segment leads because cloud platforms allow centralized analysis of spectrum data across multiple locations. It enables remote access, scalable processing, and efficient management of large datasets generated from monitoring systems.
The segment is driven by the need for flexible and cost effective solutions. Cloud deployment supports faster implementation, continuous updates, and seamless integration with digital infrastructure, which encourages wider adoption.
By Enterprise Size Analysis
Large enterprises accounted for 74.6% of the market. This segment dominates because large organizations operate extensive communication networks and require advanced tools to monitor and manage spectrum usage effectively. They need comprehensive analytics to maintain performance and compliance.
The segment is supported by higher investment capacity and complex operational requirements. Large enterprises adopt spectrum heatmap analytics to improve network visibility, optimize frequency usage, and enhance overall efficiency.
By Application Analysis
Telecommunications represented 38.4% of the market. This segment leads because telecom operators depend on efficient spectrum utilization to deliver reliable communication services. Heatmap analytics helps identify congestion, interference, and underutilized frequencies.
The segment is driven by increasing demand for wireless connectivity and network optimization. Telecom companies use these tools to improve service quality, enhance network planning, and manage spectrum resources more effectively.
By End User Analysis
Telecom operators accounted for 47.1% of the market. This segment dominates because operators are responsible for managing large scale spectrum resources and ensuring compliance with regulatory requirements. Heatmap analytics supports better monitoring and operational control.
The segment is supported by the need for continuous network optimization. Telecom operators invest in advanced analytics solutions to improve performance, reduce interference, and maintain efficient spectrum usage across their networks.
Investor Type Impact Analysis
Investor Type
Growth Sensitivity
Risk Exposure
Geographic Focus
Investment Outlook
Venture Capital Firms
High
High
North America, APAC
Focus on next-gen wireless analytics startups
Private Equity Firms
Medium
Medium
Global
Invest in scalable telecom analytics platforms
Corporate Investors
High
Low
Global
Strategic investments aligned with telecom expansion
Institutional Investors
Medium
Low
North America, Europe
Preference for stable telecom infrastructure assets
Impact Investors
Medium
Medium
Europe, APAC
Interest in smart city and connectivity solutions
Technology Enablement Analysis
Technology Enabler
Impact on CAGR Forecast (~%)
Geographic Relevance
Impact Timeline
Implementation Significance
AI-driven spectrum analytics
+1.7%
Global
Mid Term
Enhances predictive and real-time spectrum insights
Cloud-based spectrum monitoring platforms
+1.4%
Global
Short to Mid Term
Enables scalable and centralized data access
Advanced RF sensors and monitoring devices
+1.3%
North America, APAC
Short to Mid Term
Improves data accuracy and coverage
Edge computing for low-latency analysis
+1.2%
North America, Europe
Mid Term
Supports real-time decision-making
Integration with telecom network management systems
+1.1%
Global
Mid to Long Term
Enables seamless operational workflows
Key Challenges
Data accuracy is a major challenge because spectrum heatmap analytics depends on correct sensor placement, proper map alignment, and reliable RF measurements to show useful coverage and interference patterns.
Interference is difficult to analyze because busy wireless environments contain many overlapping signals, noise sources, and external interference sources that can affect the final heatmap results.
Monitoring newer and wider spectrum bands is another challenge because modern wireless environments give operators much more spectrum to scan and analyze in detail.
Integration can be difficult because spectrum heatmap analytics tools often need to work with access points, controllers, analyzers, and other monitoring systems in one environment.
Real time analysis can be hard because organizations must collect, process, and review large volumes of spectrum data without slowing down troubleshooting and decision making.
Emerging Trends
A key trend in the Spectrum Heatmap Analytics market is the increasing use of visualization tools that map radio frequency activity across different locations in real time. These systems convert complex spectrum data into easy to understand heatmaps, helping operators identify congestion, interference, and coverage gaps.
Network teams rely on these insights to optimize performance and improve signal quality. This trend reflects a shift toward more data driven spectrum management where visual analytics supports faster and more accurate decision making.
Growth Factors
The growing demand for efficient spectrum utilization is supporting the expansion of spectrum heatmap analytics solutions. As wireless networks become more dense and data usage continues to rise, managing frequency resources effectively becomes more important.
These analytics tools help organizations monitor usage patterns and improve network planning. At the same time, the expansion of advanced communication systems encourages the adoption of solutions that provide clear visibility into spectrum behavior and support better network performance.
Key Market Segments
By Component
Software
Spectrum Data Processing Software
Heatmap Visualization Software
Signal Analysis And Interpretation Software
Frequency Monitoring Software
Interference Detection Software
Hardware
Spectrum Analyzers
Radio Frequency Sensors
Monitoring Antennas
Signal Receivers
Data Acquisition Devices
Services
Spectrum Monitoring Services
Data Analysis and Reporting Services
System Integration Services
Consulting and Advisory Services
Maintenance and Support Services
By Deployment Mode
On-Premises
Cloud
By Enterprise Size
Small and Medium Enterprises
Large Enterprises
By Application
Telecommunications
Healthcare
Defense and Security
Industrial
Research and Academia
Other Applications
By End-User
Telecom Operators
Research Institutes
Government Agencies
Enterprises
Other End-Users
Regional Analysis
North America accounted for 37.5% of the Spectrum Heatmap Analytics Market, reflecting strong demand for advanced network visualization and monitoring tools across telecom and enterprise environments.
Organizations across the region increasingly use heatmap analytics to visualize spectrum usage, detect interference, and optimize network performance. The growing complexity of wireless networks and rising demand for bandwidth continue to drive adoption of tools that provide real time insights into spectrum efficiency across North America.
The U.S. generated about USD 0.46 Billion within the regional market and is projected to expand at a CAGR of 10.6%. Telecom operators and enterprises across the country continue to invest in solutions that help analyze spectrum utilization and improve network planning.
Spectrum heatmap analytics platforms support better decision making by identifying congestion areas and enhancing signal distribution. As wireless communication demand increases and network environments become more dynamic, demand for spectrum analytics solutions continues to grow steadily across the US market.
Key Regions and Countries
North America
US
Canada
Europe
Germany
France
The UK
Spain
Italy
Russia
Netherlands
Rest of Europe
Asia Pacific
China
Japan
South Korea
India
Australia
Singapore
Thailand
Vietnam
Rest of APAC
Latin America
Brazil
Mexico
Rest of Latin America
Middle East & Africa
South Africa
Saudi Arabia
UAE
Rest of MEA
Competitive Analysis
The competitive landscape of the Spectrum Heatmap Analytics market includes network testing companies, wireless infrastructure providers, and analytics software firms. Cisco Systems Inc., Keysight Technologies Inc., Rohde & Schwarz GmbH & Co. KG, Extreme Networks Inc., VIAVI Solutions Inc., Anritsu Corporation, EXFO Inc., Cambium Networks Corporation, LS telcom AG, Ranplan Wireless Network Design Ltd, Hamina Wireless Oy, and TamoSoft Ltd. hold strong positions because they offer tools for spectrum monitoring, wireless planning, signal analysis, and network performance visualization. These companies compete by helping users identify coverage gaps, manage interference, and improve wireless network quality.
Other players such as Contentsquare SAS, FullStory Inc., Pendo.io Inc., Mixpanel Inc., Wingify Software Pvt. Ltd., Lepton Software Export & Research Pvt. Ltd., Crazy Egg Inc., and Lucky Orange LLC. add competition by bringing stronger analytics, user behavior tracking, and data visualization capabilities.
Their solutions support deeper insight into usage patterns and performance trends across digital and wireless environments. The market is shaped by data accuracy, visualization quality, ease of integration, and the ability to convert complex network data into useful operational insights.
The future outlook for the Spectrum Heatmap Analytics Market looks positive as wireless networks become more crowded and operators need better visual tools to track spectrum use, detect interference, and improve coverage quality. Current industry tools already use heat maps to guide technicians to likely interference areas, while wireless analytics platforms also use network heatmaps and AI based comparisons to spot performance trends across access points and sites.
As enterprises, telecom networks, and critical communication systems place more focus on faster troubleshooting and better RF visibility, demand for spectrum heatmap analytics solutions is expected to grow steadily in the coming years.
Recent Developments
March, 2026 – Cisco DNA Center adds 6G heatmap overlays for Wi-Fi 7 deployments and auto-detects interference in campuses. Predicts channel shifts and targets enterprises with ThousandEyes integration. February 2026 Cisco Live shows AI traffic optimization for SASE with live spectrum views.
February, 2026 – Keysight N9042B launches 110 GHz real-time spectrum maps and supports O-RAN testing for 6G FR3 bands. Fits labs with AI anomaly alerts and partners telcos for field trials. Adds AR glasses export for site walks.
Report Scope
Report Features
Description
Market Value (2025)
USD 1.4 Billion
Forecast Revenue (2035)
USD 4.6 Billion
CAGR(2025-2035)
12.6%
Base Year for Estimation
2024
Historic Period
2020-2024
Forecast Period
2026-2035
Report Coverage
Revenue forecast, AI impact on Market trends, Share Insights, Company ranking, competitive landscape, Recent Developments, Market Dynamics and Emerging Trends
Segments Covered
By Component (Software (Spectrum Data Processing Software, Heatmap Visualization Software), Hardware (Spectrum Analyzers, Radio Frequency Sensors), Services (Spectrum Monitoring Services, Data Analysis and Reporting Services)), By Deployment Mode (On-Premises, Cloud), By Enterprise Size (Small and Medium Enterprises, Large Enterprises), By Application (Telecommunications, Healthcare, Defense and Security ), By End-User (Telecom Operators, Research Institutes, Government Agencies)
Regional Analysis
North America – US, Canada; Europe – Germany, France, The UK, Spain, Italy, Russia, Netherlands, Rest of Europe; Asia Pacific – China, Japan, South Korea, India, New Zealand, Singapore, Thailand, Vietnam, Rest of Latin America; Latin America – Brazil, Mexico, Rest of Latin America; Middle East & Africa – South Africa, Saudi Arabia, UAE, Rest of MEA