
Quick Navigation
Report Overview
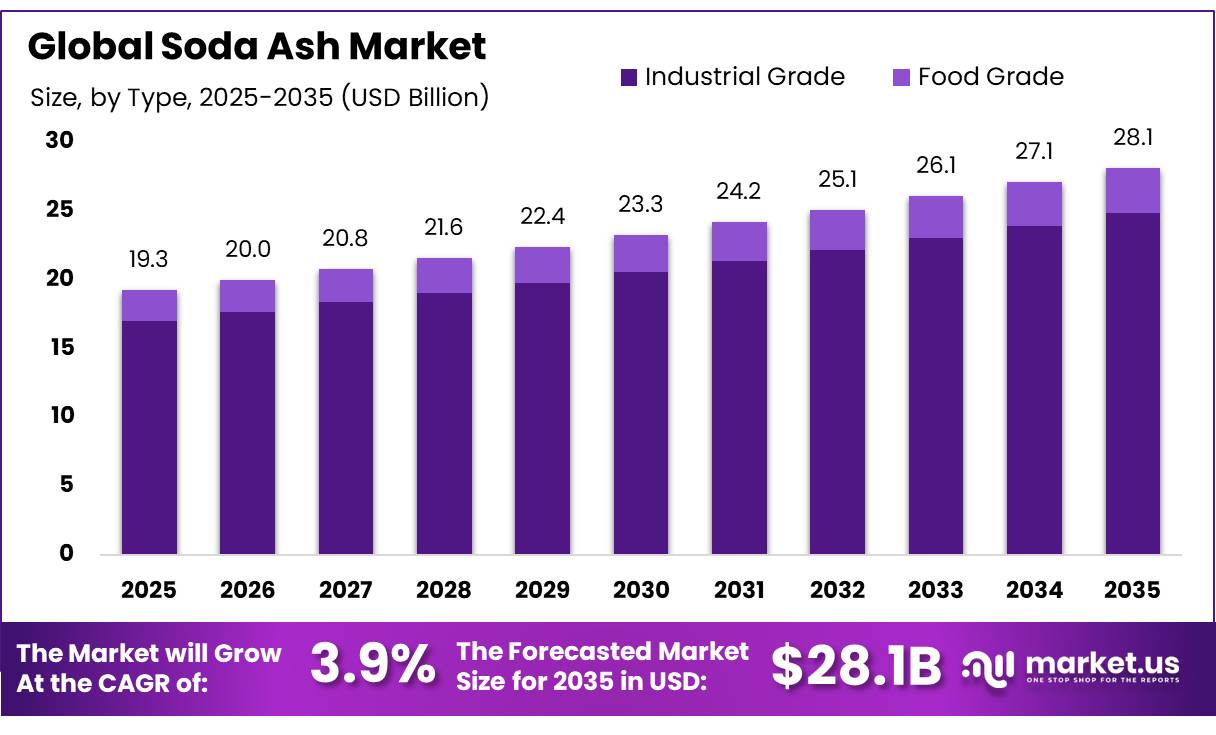
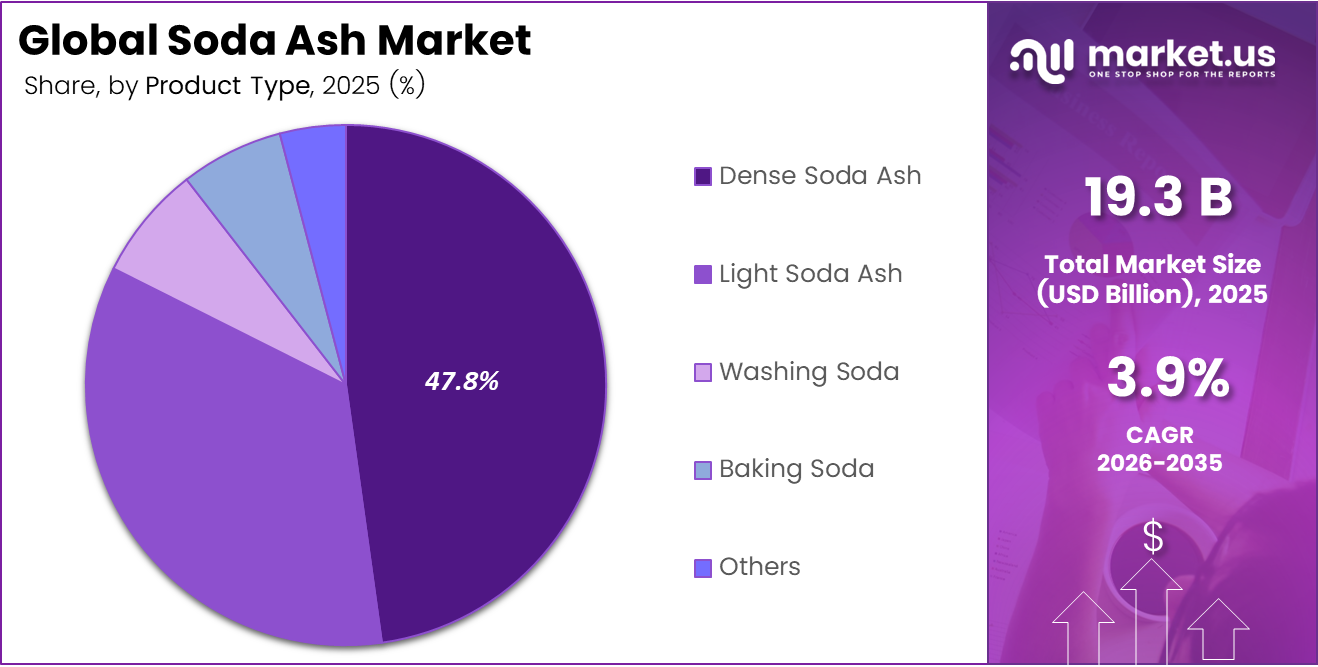
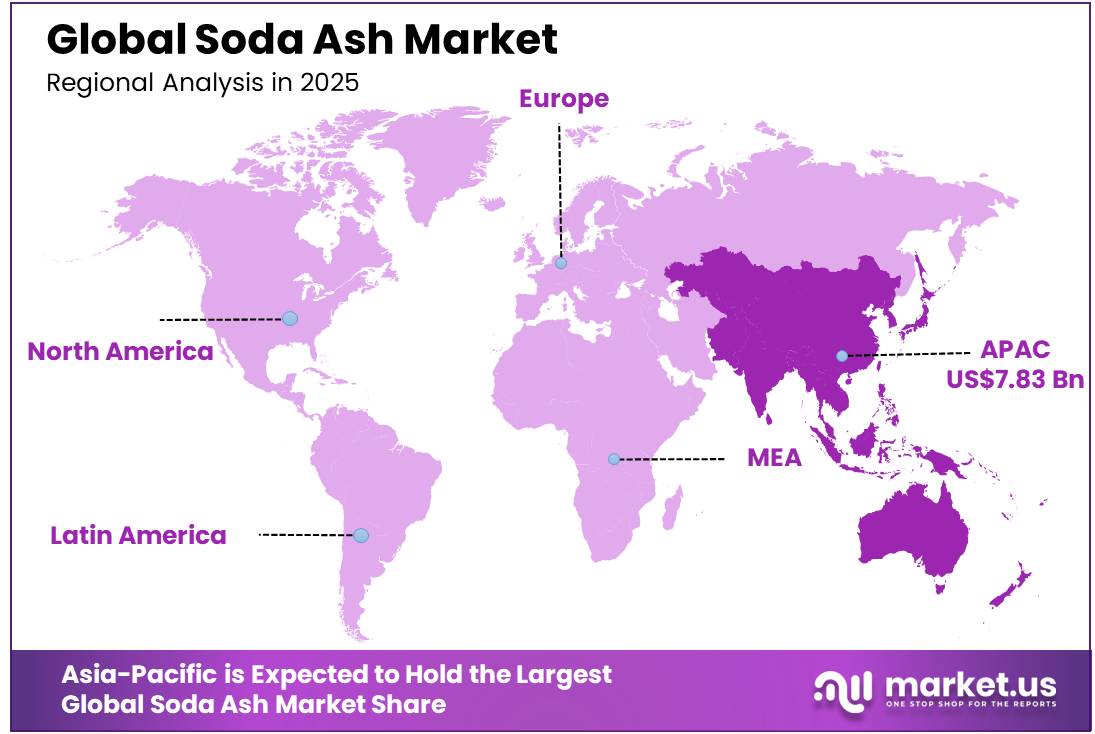
The Global Soda Ash Market was valued at USD 19.3 billion, and between 2026 and 2035, this market is estimated to register a CAGR of 3.9%, reaching about USD 28.1 billion by 2035. In 2025, Asia Pacific led the market, achieving over 40.6% share with a revenue of USD 7.83 billion.
The soda ash market includes sodium carbonate produced from natural trona and synthetic processes. Demand is rising with the expansion of solar glass, lithium carbonate processing, and sustainable infrastructure, while higher fuel and electricity costs are reducing the competitiveness of synthetic production. In 2025, U.S. soda ash output was estimated at 12.0 million metric tons, representing a 3% increase from 2024.
Natural soda ash generally offers lower production costs and environmental impacts than energy-intensive synthetic alternatives. The U.S. industry operated 6 plants owned by 5 companies in 2025, with combined nameplate capacity of 13.9 million metric tons per year. Meanwhile, Tata Chemicals’ Mithapur facility produced 1 million tonnes in FY2025–26, supported by improvements in efficiency, reliability, cost optimisation, and asset productivity.
Key Takeaways
- The global soda ash market was valued at US$ 19.3 billion in 2025.
- The global soda ash market is projected to grow at a CAGR of 3.9% and is estimated to reach US$ 28.1 billion by 2035.
- Dominant Source Type: Natural Soda Ash controls the majority of the market with a 58.4% segment share, cementing the structural cost and environmental edge over synthetic processing.
- Dominant Product Type: Dense Soda Ash is the leading product form at 47.8%, driven heavily by its requirement in granular, high-strength industrial processes.
- Dominant Quality Grade: Industrial Grade overwhelmingly commands the market with an 88.3% segment share, reflecting its foundational role in heavy manufacturing over specialised food grades.
- Dominant Downstream Application: Glass Manufacturing represents the absolute primary anchor of demand at 52.6%, serving as the critical substrate for flat glass, container glass, and high-growth solar photovoltaic panels.
- Dominant Market Region: Asia Pacific functions as the absolute geographic anchor of the global soda ash market, commanding a dominant 40.6% of the total segment share.
Type Analysis
Natural Soda Ash represents the dominant Segment in the Market
Natural Soda Ash commands a dominant 58.4% segment share of the market due to lower energy footprint and reduced greenhouse gas emissions associated with trona ore processing compared to synthetic manufacturing methods. Processing natural trona requires significantly fewer calcination and chemical transformation steps, protecting producers from extreme electricity and fuel price shocks.
Large-scale mining operations in Wyoming’s Green River basin leverage massive, highly accessible trona deposits to achieve unmatched production margins. This structural cost advantage allows natural producers to comfortably absorb global shipping spikes and consistently undercut synthetic pricing in highly competitive export markets.
Major glass and detergent multinational brands actively prioritise natural supply chains to successfully lower their scope 3 carbon footprint metrics. This clear manufacturing preference, combined with superior production economics, positions natural soda ash as the foundational pillar of global alkali supply chains.
Product Type Analysis
Dense Soda Ash is a significant type
Dense Soda Ash holds a major 47.8% share of the market because of its thick, coarse granules. This type is needed for strong, heavy industrial processes that require high heat. It’s the most common choice because its dense structure reduces dust and stops material from being lost during handling and when adding it to high-temperature furnaces.
These physical features are important for big operations where the grains need to line up consistently and react predictably to avoid flaws in the final products. The steady demand from industries like construction and container manufacturing keeps dense-grade Soda Ash as the main source of income across all product types.
Ultra-pure light soda ash designed for use in concentrated consumer products is becoming a big trend. Companies are aiming to grow their market presence between 2030 and 2035. This is because there’s a growing need for special kinds of builders that dissolve easily in powder detergents. These builders help clean stains better while using less water.
Grade Analysis
Industrial Grade is the Most Widely Used Grade in Soda Ash Market
Industrial Grade holds a strong 88.3% share of the market because it works well with big manufacturing processes like making flat glass, blowing containers, working with metals, and creating basic chemicals. This grade is popular because most industrial chemical processes don’t need the costly, multi-step filtering and strict cleaning steps that are needed for things people drink or use in medicine.
Battery-cathode grade sodium carbonate is a key area that is gaining a lot of attention. It is expected to reach major production levels between 2030 and 2035 as the global electric vehicle supply chain grows. This special type of sodium carbonate is used to help extract high-purity lithium carbonate from mineral brines and spodumene ore.
The main reason for this growth is the fast increase in battery production for vehicles and energy storage systems. However, the growth of this high-profit area is limited by strict quality standards. Battery makers need a very pure product, with impurities below 99.5%, to avoid serious problems in batteries. This means suppliers need to invest heavily in upgrading their refining processes to meet these high standards.
Application Analysis
Soda Ash Is Mostly Utilised in the Glass Manufacturing Sector
Glass manufacturing makes up 52.6% of the market because it needs soda ash, which is a key ingredient. This dominance is due to the large and continuous use of soda ash in flat glass, container glass, fibreglass, and solar glass production. Soda ash helps lower the melting temperature of silica, which reduces energy use and improves glass-forming efficiency. Its role as a key raw material makes it essential for large-scale glass manufacturing.
The growth of construction, automotive, packaging, and solar panel industries continues to support strong demand from this segment. Flat glass is widely used in buildings, vehicles, and infrastructure projects, while container glass is used in food, beverage, and pharmaceutical packaging. Rising solar PV installations are also increasing demand for solar glass, further strengthening soda ash consumption in glass manufacturing.
Lithium carbonate precipitation for energy storage systems is becoming one of the most important trends, with big increases in usage expected between 2030 and 2035. This trend is happening because it takes about two metric tons of sodium carbonate to make one metric ton of lithium carbonate used in batteries. The main reason for this growth is the worldwide move toward making more electric vehicles and setting up local battery production.
Key Market Segments
By Type
- Natural Soda Ash
- Synthetic Soda Ash
By Product Type
- Light Soda Ash
- Dense Soda Ash
- Washing Soda
- Baking Soda
- Others
By Grade
- Industrial Grade
- Food Grade
By Application
- Glass Manufacturing
- Soaps & Detergents
- Chemicals Manufacturing
- Water Treatment
- Pulp & Paper
- Metallurgy
- Textile Processing
- Food & Beverage
- Pharmaceuticals
- Agriculture
- Others
Market Dynamics
Opportunity
The sodium-ion battery supply chain presents a new growth opportunity for soda ash producers because it remains separate from the market’s established dependence on glass and detergent manufacturing. The sodium-ion battery sector was valued at USD 1.39 billion in 2025 and is projected to reach USD 7.81 billion by 2035, expanding at an 18.84% CAGR. Sodium carbonate is used as a precursor in layered metal oxide and Prussian blue analogue cathode chemistries, while approximately 1.10 kg of soda ash is also required to produce one kilogram of battery-grade lithium carbonate.
Its pricing near USD 300 per ton offers greater feedstock stability than lithium carbonate, which has historically fluctuated between USD 13,000 and USD 80,000 per ton. Under a scenario in which global sodium-ion battery capacity reaches 700 GWh annually by 2030, incremental soda ash consumption could rise by 350,000–450,000 metric tons per year.
Producers supplying material with at least 99.8% Na₂CO₃ purity and heavy-metal content below 5 ppm could secure premiums of USD 80–150 per ton and improve specialist-product EBITDA margins by 400–600 basis points. Supply agreements will need to be secured ahead of planned gigafactory commissioning across China, Europe, and India during 2027–2028.
| Opportunity | (~) % Potential CAGR Upside | Geographic Relevance | Execution Window |
|---|---|---|---|
| Sodium-Ion Battery Feedstock Monetisation | +1.8% | China, APAC emerging, EU grid storage | Medium term (2–4 years) |
| Solar Glass Supply Chain Integration | +1.5% | China, India, Southeast Asia, MENA | Medium term (2–4 years) |
| Green / Low-Carbon Soda Ash Premium Segment | +1.2% | EU, North America, Japan | Short–Medium term (1–4 years) |
| MEA & Sub-Saharan Africa Greenfield Capacity Buildout | +1.0% | East Africa, Gulf, West Africa | Long term (≥ 4 years) |
| M&A Roll-Up of Distressed Mid-Tier Producers | +0.9% | Global, China exit assets, Eastern Europe | Short–Medium term (1–3 years) |
| Pharmaceutical & High-Purity Soda Ash Vertical | +0.7% | North America, EU, India | Medium term (2–4 years) |
Drivers
Glass manufacturing remains the largest structural demand driver for soda ash, representing approximately 51–57% of worldwide consumption. Soda ash functions as a critical fluxing agent by lowering the melting temperature of silica from nearly 1,700°C to a commercially manageable range of 1,200–1,500°C. This role supports its continued use in flat, container, automotive, and speciality glass production, with no scalable alternative currently offering equivalent technical and economic performance.
Construction activity across South and Southeast Asia and the Gulf is increasing demand for architectural glass, while the recovery of vehicle manufacturing is supporting automotive applications. Each vehicle contains glass requiring an estimated 3.5–5 kg of soda ash equivalent.
Container glass consumption is also benefiting from restrictions on disposable plastic packaging and the expansion of extended producer responsibility frameworks. More than 70 countries had introduced some form of single-use plastic control by 2026, encouraging beverage and food companies to adopt recyclable glass formats. Total glass-sector soda ash procurement is estimated at 40–42 million metric tons annually, creating an addressable purchasing pool of roughly USD 12–14 billion and providing producers with a stable long-term volume base.
| Driver | (~) % Impact on CAGR Forecast | Geographic Relevance | Impact Timeline |
|---|---|---|---|
| Glass Manufacturing Demand Expansion | +1.4% | APAC (China, India, SEA), North America | Short–Medium term |
| Renewable Energy Infrastructure (Solar PV Glass) | +0.9% | China, India, MENA, Southeast Asia | Medium term |
| Urbanisation & Construction Activity | +0.7% | South & Southeast Asia, MENA, Africa | Medium–Long term |
| Detergent & Home Care Industry Growth | +0.5% | South Asia, Sub-Saharan Africa, Latin America | Short–Medium term |
| Water Treatment Expansion in Emerging Economies | +0.4% | South Asia, Africa, LATAM | Medium term |
| EV & Lithium Carbonate Processing Demand | +0.3% | China, APAC, Chile, Australia | Short–Medium term |
Restraints
Persistent Chinese oversupply represents the most significant restraint on soda ash market performance. Domestic spot prices declined by 18.19% during 2025, falling from RMB 1,528 per ton at the beginning of the year to RMB 1,250 per ton by year-end. China contributes close to half of global production and consumption, making its capacity additions highly influential in international pricing. New low-cost plants, supported by regional industrial policies and production incentives, have expanded faster than downstream demand can absorb.
Worldwide consumption increased by only 1.2%, equivalent to approximately 800,000 metric tons, following an unusually strong 8% expansion in the preceding year. This imbalance is placing particular pressure on European synthetic producers, where manufacturing costs can reach EUR 180–220 per ton. Market prices below EUR170perton may push higher-cost facilities into negative operating cash flow.
| Restraint | (~) % Impact on CAGR Forecast | Geographic Relevance | Impact Timeline |
|---|---|---|---|
| China-Driven Global Oversupply & Price Collapse | -1.2% | Global (most severe in APAC, EU import corridors) | Short–Medium term |
| Raw Material & Energy Price Volatility | -0.8% | Global (acute for synthetic producers in Europe, India) | Short term |
| Environmental & Carbon Emission Regulations | -0.6% | EU, North America, China (dual carbon policy) | Medium–Long term |
| Synthetic Process Substitution Risk | -0.5% | Europe, North America | Long term |
| Trade Barriers, Tariffs & Geopolitical Disruption | -0.4% | US–China corridors, EU–Turkey, India–China | Short–Medium term |
| Limited Scalability of Natural Trona Resources | -0.3% | North America core (Wyoming), East Africa | Long term |
Challenges
The shortage of experienced technical personnel is becoming a major operational challenge as soda ash capacity expands into regions with limited chemical-processing expertise. Facilities with inadequate staffing can experience maintenance downtime equal to 8–12% of theoretical capacity, compared with an industry benchmark of 4–6%. The experienced global workforce supporting these operations is estimated at only 12,000–15,000 chemical-process engineers and senior technicians.
Competition for qualified workers has intensified, with experienced personnel in major Chinese industrial provinces receiving salary premiums of 35–55% compared with 2019 levels. New projects in Africa and the Middle East frequently depend on expatriate engineering teams costing three to five times more than local employees.
For a facility producing 500,000 tons per year, this reliance can add USD 8–15 million to annual operating expenses. The long-term risk is amplified by workforce ageing, as an estimated 30–35% of experienced specialists may reach retirement age by 2032, increasing the need for structured training, automation, and knowledge-transfer programs.
| Challenge | (~) % CAGR Friction Drag | Geographic Relevance | Mitigation Horizon |
|---|---|---|---|
| Supply Chain Logistics & Bulk Handling Complexity | -0.7% | Global (acute in APAC corridors, Africa) | Medium term (2–4 years) |
| Technical Workforce & Process Expertise Shortage | -0.5% | MENA, Africa, South/Southeast Asia | Long term (≥ 4 years) |
| Water Scarcity in Production Catchment Areas | -0.6% | India, MENA, Northern China, East Africa | Long term (≥ 4 years) |
| Quality Standardisation Across Diverse Applications | -0.4% | Global (APAC complexity, EU spec divergence) | Medium term (2–4 years) |
| Digital & Operational Technology Adoption Lag | -0.3% | APAC mid-tier producers, Africa, LATAM | Medium term (2–4 years) |
| Price Discovery Opacity & Contract Structure Friction | -0.4% | Global spot markets, emerging regions | Short–Medium term (1–3 years) |
Geopolitical Impact Analysis
Geopolitical Disruptions and Market Vulnerabilities
The growing military conflicts in the Middle East and Eastern Europe in early 2026 have created major challenges for the global soda ash market. Energy price volatility, shipping delays, and trade-route disruptions are affecting production costs and supply reliability. Synthetic soda ash producers in Europe remain more exposed because their operations depend heavily on natural gas, electricity, and stable logistics networks.
This pressure is increasing the cost gap between synthetic soda ash producers and natural trona-based producers. Operations in the U.S. and Turkey are better positioned due to lower-cost feedstock access and comparatively stable production economics. As a result, European producers using older Solvay-process plants are facing tighter margins and more cautious production planning.
Trade protection is also becoming more visible as countries try to protect domestic supply chains. India’s DGTR investigations into soda ash imports show how governments are responding to global uncertainty with closer import monitoring and possible restrictions. Overall, geopolitical disruption is reshaping soda ash trade, pricing, and regional competitiveness.
Regional Analysis
Asia Pacific Held the Largest Share of the Global Soda Ash Market
Asia Pacific led the market, achieving over 40.6% share with a revenue of USD 7.83 billion. This dominance is due to its industrial manufacturing areas, fast construction projects, and most of the world’s solar glass production facilities are there. This region keeps leading because it’s the main place for making flat glass and containers, which use a lot of soda ash.
According to data from the World Population Review, the area has some of the fastest-growing cities and the most populated countries, especially China and India. The ongoing growth of cities creates a steady demand for chemical products like detergent powders and laundry soap, which keeps Asia Pacific as the main market for chemical companies around the world.
The Middle East and Africa are becoming very important markets, with big increases in demand. This growth is driven by major projects in these regions that aim to spread out their economies and build newer factories for making automotive and construction glass locally. These trends are supported by population studies from the World Population Review, which show that Sub-Saharan Africa and major areas in the Middle East will experience the fastest urban growth and population increase in the world.
Key Regions and Countries Covered in this Report
- North America
- The US
- Canada
- Europe
- Germany
- France
- The UK
- Spain
- Italy
- Russia & CIS
- Rest of Europe
- APAC
- China
- Japan
- South Korea
- India
- ASEAN
- Rest of APAC
- Latin America
- Brazil
- Mexico
- Rest of Latin America
- Middle East & Africa
- GCC
- South Africa
- Rest of MEA
Key Players Analysis
The global soda ash market operates under a highly consolidated, tier-one oligopolistic structure. This market concentration intensifies significantly within the natural soda ash segment and across export-dependent trade corridors, where a limited cohort of multinational producers commands the majority of trans-oceanic volumes.
Conversely, the remaining global capacity is held by a fragmented network of domestic manufacturers. This decentralised production is highly evident in mainland China’s synthetic sector, where localised manufacturing footprints are heavily influenced by state-directed industrial planning and environmental policy frameworks. Prohibitive capital intensity remains the primary structural entry barrier, as establishing new synthetic Solvay processing hubs or natural extraction facilities requires massive up-front investments.
Furthermore, economically viable, high-purity natural trona ore deposits are geographically scarce and heavily locked under long-term corporate mineral leases. Finally, commercial viability depends entirely on secured, high-volume bulk transport networks, including specialised rail car allocations and dedicated deep-water port shipping terminals, giving established players a permanent competitive advantage.
The Following are some of the Major Players in the Industry
- Solvay
- Ciner Group
- Tata Chemicals Limited
- Genesis Alkali
- WE Soda
- Şişecam
- OCI Chemical Corporation
- Nirma Limited
- GHCL Limited
- DCW Limited
- Tokuyama Corporation
- FMC Corporation
- Inner Mongolia Yuanxing Energy Company Limited
- China National Chemical Corporation (ChemChina)
- Shandong Haihua Group
Key Development
- In May 2026, Tata Chemicals Limited announced that its main manufacturing plant in Mithapur, Gujarat, reached a major milestone by producing 1 million metric tonnes of soda ash during the 2025–2026 financial year. This success was due to better coordination between departments, improved reliability of the plant’s infrastructure, and changes in marketing strategies.
- In May 2026, WE Soda adjusted its 2026 production and sales targets downward to around 9.3 million metric tonnes. This change was made to account for lower market prices and reduced profit margins. However, as the world’s largest natural soda ash producer, the company still plans to meet its overall financial goals for the year, which include $570 million in Adjusted EBITDA and $400 million in Free Cash Flow.
Report Scope
| Report Features | Description |
|---|---|
| Market Value (2025) | USD 19.3 Bn |
| Forecast Revenue (2035) | USD 28.1 Bn |
| CAGR (2026-2035) | 3.9% |
| Base Year for Estimation | 2025 |
| Historic Period | 2020-2024 |
| Forecast Period | 2026-2035 |
| Report Coverage | Revenue Forecast, Market Dynamics, Competitive Landscape, Recent Developments |
| Segments Covered | By Type (Natural Soda Ash, Synthetic Soda Ash), By Product Type (Light Soda Ash, Dense Soda Ash, Washing Soda, Baking Soda, Others), By Grade (Industrial Grade, Food Grade), By Application (Glass Manufacturing, Soaps & Detergents, Chemicals Manufacturing, Water Treatment, Pulp & Paper, Metallurgy, Textile Processing, Food & Beverage, Pharmaceuticals, Agriculture, Others) |
| Regional Analysis | North America – The US & Canada; Europe – Germany, France, The UK, Spain, Italy, Russia & CIS, Rest of Europe; APAC- China, Japan, South Korea, India, ASEAN & Rest of APAC; Latin America- Brazil, Mexico & Rest of Latin America; Middle East & Africa- GCC, South Africa, & Rest of MEA |
| Competitive Landscape | Solvay, Ciner Group, Tata Chemicals Limited, Genesis Alkali, WE Soda, Şişecam, OCI Chemical Corporation, Nirma Limited, GHCL Limited, DCW Limited, Tokuyama Corporation, FMC Corporation, Inner Mongolia Yuanxing Energy Company Limited, China National Chemical Corporation (ChemChina), Shandong Haihua Group. |
| Customization Scope | Customization for segments and region/country-level will be provided. Moreover, additional customization can be done based on the requirements. |
| Purchase Options | We have three licenses to opt for: Single User License, Multi-User License (Up to 5 Users), Corporate Use License (Unlimited Users and Printable PDF) |


