


Report Overview
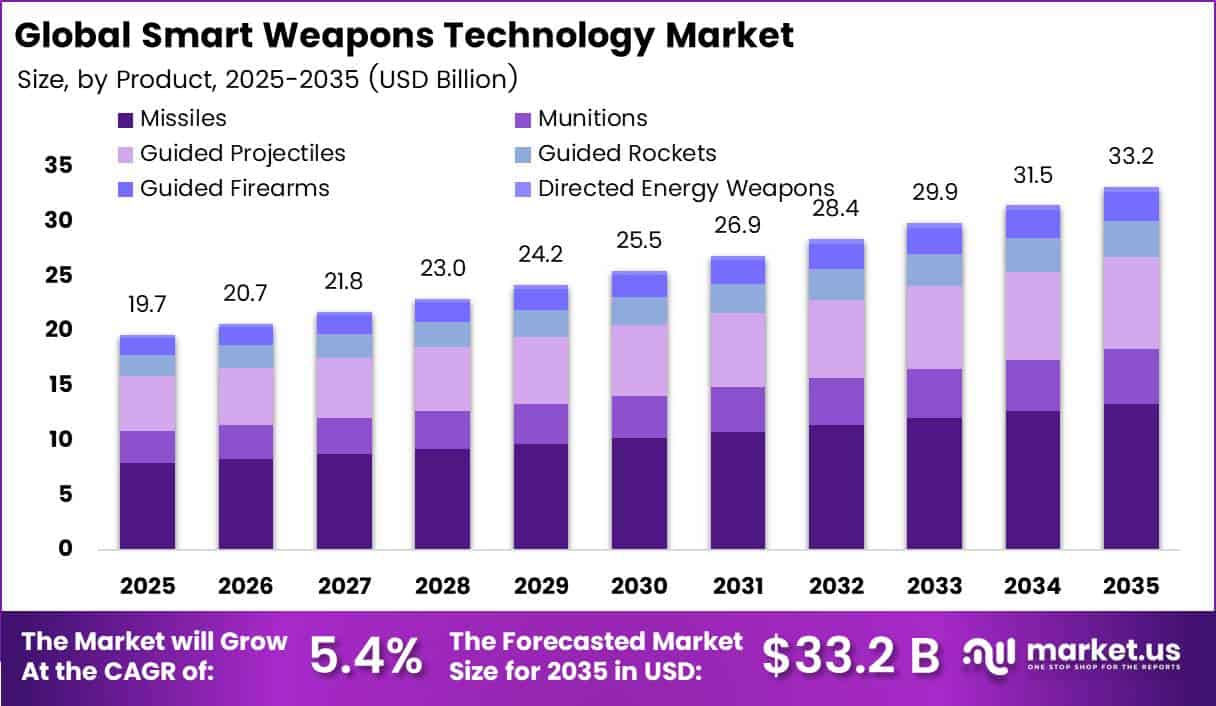
In 2025, the Global Smart Weapons Technology Market was valued at USD 19.7 billion. The market is projected to grow at a CAGR of 5.4% during 2026–2035, reaching approximately USD 33.2 billion by 2035. North America dominated the global market in 2025, accounting for more than 38.4% of the total market share and generating approximately USD 7.5 billion in revenue.
Growth is strongly supported by rising global defense spending and the increasing use of precision-guided weapons. According to SIPRI, global military expenditure reached a record USD 2,887 billion in 2025, increasing by 2.9% in real terms and recording an eleventh consecutive year of growth. Military spending also represented 2.5% of global GDP, the highest level since 2009.
Europe increased defense expenditure by 14% to USD 864 billion in 2025. NATO members also agreed to raise core defense spending to 3.5% of GDP by 2035, alongside an additional 1.5% for defense-related infrastructure. Higher defense budgets are supporting procurement of guided missiles, precision munitions, and smart bombs as governments replace older weapon systems with more accurate technologies.
The United States remained the largest global military spender, despite a 7.5% decline in expenditure to USD 954 billion in 2025. The US, China, and Russia together represented 51% of global military expenditure. Meanwhile, military spending across Asia and Oceania increased by 8.1% in 2025, supporting further demand for advanced smart weapon systems.
Key Takeaway
- The Smart Weapons Technology Market was valued at USD 19.7 billion in 2025 and is projected to reach USD 33.2 billion by 2035, growing at a CAGR of 5.4%.
- Missiles led the product segment with a 40.3% share, driven by demand for long-range and precision-strike capabilities.
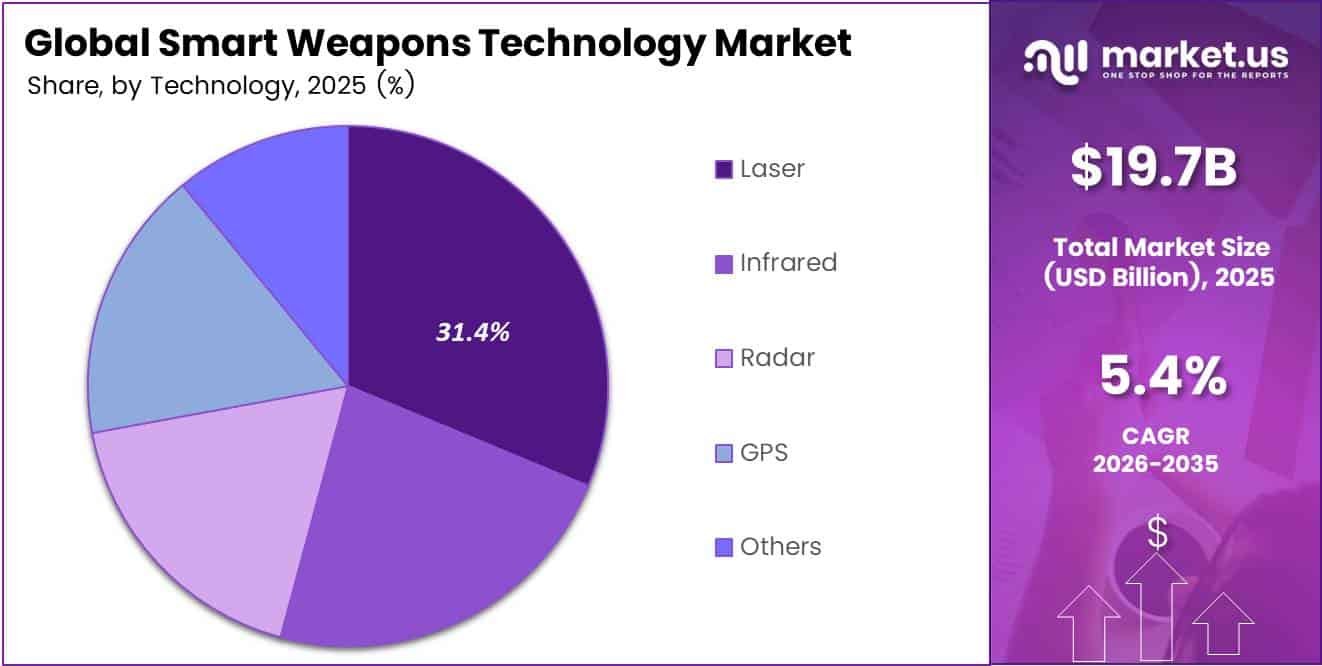
- Laser technology led the technology segment with a 31.4% share, supported by its role in precision air-to-ground strikes.
- Land platforms led the platform segment with a 44.9% share, driven by artillery, air defense, and tactical strike demand.
- Defense applications led the application segment with a 70.1% share, driven by large-scale national procurement programs.
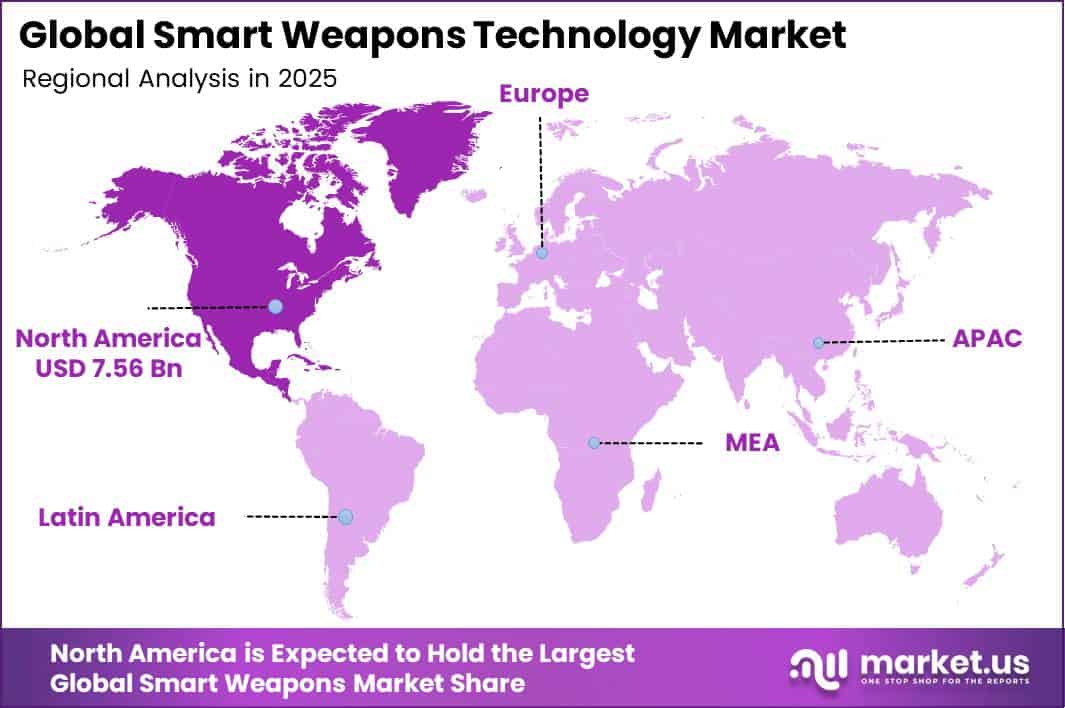
- North America led the market with a 38.4% share and approximately USD 7.56 billion in revenue in 2025.
By Product
The missiles segment held a dominant 40.3% share of the smart Weapons Technology Market, supported by the growing need for long-range and precision-strike capabilities. Missiles combine guidance, propulsion, targeting, and onboard control technologies in a single system, making them more valuable than conventional unguided weapons.
Demand is also being strengthened by continued procurement of ground-launched, air-launched, and sea-launched missile systems. The U.S. Department of Defense requested USD 29.8 billion for missiles and munitions in FY2025, showing the high priority given to advanced strike and defense systems. The enacted FY2025 National Defense Authorization Act authorized USD 22.5 billion for selected missile and munition programs.
This included procurement of 300 Army Precision Strike Missiles, compared with the 230 missiles originally requested. Funding was also provided for 12 SM-3 Block IIA missile interceptors for naval ballistic-missile defense. These programs require advanced seekers, guidance systems, data links, and control technologies, increasing the overall value of each missile.
By Technology
Laser technology accounted for a 31.4% share of the smart Weapons Technology Market, supported by its strong role in improving targeting accuracy and precision strike capability. Laser-guided weapons use reflected laser energy from a marked target, allowing the guidance system to track the target and correct the weapon’s flight path during operation.
This technology is widely used with aircraft-delivered bombs because it can improve accuracy without requiring major changes to the complete weapon platform. In FY2025, the U.S. Air Force planned procurement of approximately 1,500 JDAM guidance kits and also funded general-purpose bombs in 250-pound, 500-pound, 1,000-pound, 2,000-pound, and 5,000-pound classes.
By Platform
Land platforms held a dominant 44.9% share of the smart Weapons Technology Market, supported by strong demand for guided weapons across artillery, air defense, anti-armor, and tactical strike operations. Ground forces rely heavily on mobile launch systems because they can operate from dispersed locations and provide flexible battlefield coverage. Precision-guided weapons also improve firing range, targeting accuracy, and ammunition efficiency compared with conventional systems.
In FY2025, the U.S. Army requested USD 1.16 billion for Guided Multiple Launch Rocket System procurement, along with USD 51.5 million for advance procurement. The funding supported the purchase of 6,408 GMLRS rockets, highlighting the large volume of guided munitions required for land-based operations.
By Application
Defense applications held a dominant 70.1% share of the smart Weapons Technology Market, mainly because national armed forces are the largest buyers and users of guided weapon systems. Defense agencies have the financial capacity to procure, operate, maintain, and regularly replace advanced munitions on a large scale.
In FY2025, Japan’s Ministry of Defense allocated ¥8.47 trillion under its Defense Buildup Program, including ¥287.6 billion for ammunition and guided missiles. The ministry also assigned ¥293 billion for the acquisition of Hyper Velocity Gliding Projectiles. These investments directly support demand for guided missiles, seekers, navigation systems, control units, and secure command links.
Key Market Segments
By Product
- Missiles
- Munitions
- Guided Projectiles
- Guided Rockets
- Guided Firearms
- Directed Energy Weapons
By Technology
- Laser
- Infrared
- Radar
- GPS
- Others
By Platform
- Air
- Land
- Naval
By Application
- Defense
- Homeland Security
- Law Enforcement
Geopolitical Impact Analysis
Geopolitical tensions are increasing supply-chain risks for smart-weapons manufacturers, especially for semiconductors, optical lenses, GPS-navigation equipment, sensors, permanent magnets, high-grade alloys, and energetic materials. WTO monitoring showed that trade-restrictive measures in force covered USD 4.6 trillion, equal to 19.4% of global merchandise imports, by May 2025, compared with 12.5% at the end of 2024.
Although the WTO Information Technology Agreement removes tariffs on many semiconductors, optical lenses, and GPS products, export controls, customs checks, and changing trade rules can still delay critical components. This may force defense suppliers to maintain larger inventories or purchase higher-cost approved alternatives, raising costs for missile seekers, laser-guidance systems, inertial-navigation equipment, and secure data links.
Shipping disruptions create another challenge. UNCTAD reported that container tonnage passing through the Suez Canal had fallen by 82% by the first half of February 2024, while traffic through both the Suez and Panama canals declined by more than 40% from peak levels. Longer shipping routes increase fuel use, transit time, insurance costs, and working-capital requirements. Energy-price volatility also affects production costs.
The World Bank projected Brent crude at USD 64 per barrel in 2025, compared with USD 81 in 2024, but warned that prolonged Middle East disruption could push the 2026 average to USD 95–115 per barrel. Higher energy and freight costs can increase logistics, propellant-input, and manufacturing expenses across the smart weapons supply chain.
Regional Analysis
North America held the dominant position in the smart Weapons Technology Market, accounting for 38.4% of global revenue and reaching around USD 7.5 billion in 2025. The region benefits from large defense procurement programs, strong manufacturing capacity, advanced testing infrastructure, and continuous investment in precision-guided weapons.
In FY2025, the U.S. Department of Defense requested USD 29.8 billion for munitions, covering conventional ammunition and precision-guided systems. This spending supports demand for guided missiles, smart bombs, launch systems, seekers, navigation equipment, and secure communication components.
Asia Pacific is the fastest-growing region, supported by military modernization, domestic production, and rising demand for long-range and precision-strike systems. India’s Ministry of Defence reported that 509 equipment, weapon-system, and platform items were included in Armed Forces positive indigenization lists, while 5,012 items were placed under Defense Public Sector Undertaking lists.
Europe remains an important market for air-defense interceptors, guided artillery, and stand-off missiles. The Middle East, Africa, and Latin America are smaller but emerging markets, supported by border security, air-defense needs, and modernization programs. Overall, North America maintains the largest revenue base, while Asia Pacific offers strong long-term growth potential.
Key Regions and Countries
North America
- US
- Canada
Europe
- Germany
- France
- The UK
- Spain
- Italy
- Rest of Europe
Asia Pacific
- China
- Japan
- South Korea
- India
- Australia
- Rest of APAC
Latin America
- Brazil
- Mexico
- Rest of Latin America
Middle East & Africa
- GCC
- South Africa
- Rest of MEA
Market Dynamics
Drivers
| Driver | (~) % CAGR | Geographic Relevance | Impact Timeline |
|---|---|---|---|
| Precision munitions replenishment | +0.8% | Global | Short term (2 years or less) |
| Air-defense modernization | +0.7% | North America and Europe | Medium term (2 to 4 years) |
| Long-range strike procurement | +0.6% | Asia Pacific and Europe | Medium term (2 to 4 years) |
| Guidance-system upgrades | +0.4% | Global | Short term (2 years or less) |
| Domestic production mandates | +0.3% | Asia Pacific | Long term (4 years or more) |
Precision Munitions Replenishment
Precision-munition replenishment is the strongest active driver because governments are converting operational stockpile gaps into multi-year procurement demand. SIPRI recorded global military expenditure of USD 2.8 trillion in 2025, a real increase of 2.9% and the eleventh consecutive annual rise; this expands the funding base for guided interceptors, missiles, and smart artillery rounds.
The U.S. Department of Defense requested USD 29.8 billion for munitions in FY2025, while the U.S. Army budgeted USD 1.16 billion for GMLRS procurement and supported 6,408 rockets. Japan’s Ministry of Defense allocated ¥287.6 billion to ammunition and guided missiles in FY2025. These orders improve factory loading, lower unit-cost absorption pressure, and support an estimated +0.8% incremental contribution to the baseline CAGR.
Restraints
| Restraint | (~) % CAGR | Geographic Relevance | Impact Timeline |
|---|---|---|---|
| Export-control fragmentation | -0.9% | Global | Short term (2 years or less) |
| Restricted defense budgets | -0.6% | Emerging markets | Medium term (2 to 4 years) |
| Lengthy approval cycles | -0.5% | Europe and North America | Medium term (2 to 4 years) |
| Technology-transfer limits | -0.4% | Asia Pacific and Middle East | Long term (4 years or more) |
| High qualification costs | -0.3% | Global | Short term (2 years or less) |
Export-Control Fragmentation
Export-control fragmentation creates an immediate sales challenge because smart weapons depend on licensed transfers of guidance electronics, infrared sensors, secure communications, propulsion materials, and technical data. WTO monitoring showed that trade-restrictive measures covered USD 4.6 trillion, equal to 19.4% of world merchandise imports by May 2025, up from 12.5% at the end of 2024.
UNCTAD also reported that Suez and Panama Canal transits were down by more than 40% from peak levels in early 2024, increasing delivery uncertainty for controlled components. These restrictions can delay contracts, raise compliance costs, and reduce supply flexibility, creating an estimated -0.9% CAGR friction drag.
Challenges
| Challenge | (~) % CAGR | Geographic Relevance | Mitigation Horizon |
|---|---|---|---|
| Component qualification delays | -0.7% | Global | Medium term (2 to 4 years) |
| Energetic material shortages | -0.5% | North America and Europe | Long term (4 years or more) |
| Skilled labor constraints | -0.4% | Global | Medium term (2 to 4 years) |
| Supplier concentration risk | -0.4% | Global | Long term (4 years or more) |
| Testing range congestion | -0.3% | North America and Europe | Short term (2 years or less) |
Component Qualification Delays
Component qualification delays create a major operational challenge because replacement seekers, processors, semiconductors, and propulsion inputs must pass strict safety, reliability, and platform-integration testing. UNCTAD reported an 82% decline in container tonnage crossing the Suez Canal by the first half of February 2024, increasing supply uncertainty for imported electronics and specialist materials.
The World Bank projected the energy-price index to fall by 17% in 2025, while still warning that geopolitical tensions could raise freight and energy costs. To reduce these risks, manufacturers need dual sourcing, buffer inventories, and earlier supplier testing. These delays could create an estimated -0.7% CAGR friction drag.
Opportunities
| Opportunity | (~) % CAGR | Geographic Relevance | Execution Window |
|---|---|---|---|
| Modular retrofit guidance kits | +0.9% | Global | Medium term (2 to 4 years) |
| Autonomous targeting architectures | +0.7% | North America and Asia Pacific | Long term (4 years or more) |
| Lifecycle sustainment contracts | +0.6% | Global | Medium term (2 to 4 years) |
| Regional co-production programs | +0.5% | Europe and Asia Pacific | Long term (4 years or more) |
| Multi-mode seeker integration | +0.4% | Global | Medium term (2 to 4 years) |
Modular Retrofit Guidance Kits
Modular retrofit guidance kits offer a strong growth opportunity because large stocks of conventional munitions can be upgraded into precision-guided weapons. In FY2025, the U.S. Air Force planned around 1,500 JDAM guidance kits for general-purpose bombs ranging from 250 to 5,000 pounds, showing the cost benefit of adding guidance systems to existing weapons.
The U.S. Army also allocated USD 1.16 billion for GMLRS procurement, while Japan’s Ministry of Defense assigned ¥293 billion to Hyper Velocity Gliding Projectiles. Wider use of retrofit kits could improve production efficiency, reduce integration costs, and support recurring maintenance demand, creating a potential +0.9% CAGR upside.
Key Players Analysis
Tier-1 companies in the smart Weapons Technology Market include Lockheed Martin, RTX’s Raytheon business, MBDA, and BAE Systems, supported by their strong positions in missiles, precision guidance, air defense, and electronic warfare. Lockheed Martin generated USD 12.6 billion from its Missiles and Fire Control segment in 2024, rising 12.7% year over year.
RTX’s Raytheon segment reported USD 26.7 billion in sales, supported by higher volumes from Patriot, NASAMS, and counter-UAS programs. MBDA recorded EUR 4.9 billion in revenue, EUR 13.8 billion in orders, and a backlog of EUR 37 billion in 2024. The company also delivered one-third more missiles than in 2023. BAE Systems generated GBP 7.1 billion from Electronic Systems and invested GBP 357 million in self-funded R&D.
Tier-2 challengers include Northrop Grumman, Thales, Leonardo, L3Harris, General Dynamics, and Boeing. Northrop Grumman’s Defense Systems business generated USD 8.5 billion in 2024 sales and USD 866 million in operating income. Thales reported EUR 10.9 billion in defense revenue, up 13.9%.
Leonardo’s Electronics Europe business generated EUR 4.7 billion, while the group invested EUR 2.4 billion, equal to about 14% of revenue, in R&D. General Dynamics’ Combat Systems represented 19% of its USD 47.7 billion revenue, while Boeing Defense, Space & Security generated USD 23.9 billion but recorded a USD 5.4 billion operating loss.
Top Key Players in the Market
- BAE Systems Plc.
- General Dynamics Corporation
- L3Harris Technologies Inc.
- Leonardo S.p.A.
- Lockheed Martin Corporation
- MBDA
- Northrop Grumman Corporation
- Raytheon Technologies Corporation
- Thales Group
- The Boeing Company
Recent Developments
- In 2026, Lockheed Martin signed a seven-year framework agreement with the U.S. government to expand annual PAC-3 MSE interceptor production capacity from approximately 600 to 2,000 missiles. The company delivered a record 620 PAC-3 MSE interceptors in 2025, after increasing production by more than 60% over the previous two years.
- In 2025, BAE Systems and Polska Grupa Zbrojeniowa formed a strategic partnership to establish a new 155 mm ammunition manufacturing facility in Poland. PGZ plans to raise production capacity to around 150,000–180,000 large-caliber shells annually. The plant will use automated manufacturing technology similar to systems designed to deliver a sixteen-fold increase in BAE Systems’ UK 155 mm shell-production capacity.
Report Scope
| Report Features | Description |
|---|---|
| Market Value (2025) | USD 19.7 Billion |
| Forecast Revenue (2035) | USD 33.2 Billion |
| CAGR (2026-2035) | 5.4% |
| Base Year for Estimation | 2025 |
| Historic Period | 2020-2024 |
| Forecast Period | 2026-2035 |
| Report Coverage | Revenue Forecast, Market Dynamics, Competitive Landscape, Recent Developments |
| Segments Covered | By Product (Missiles, Munitions, Guided Projectiles, Guided Rockets, Guided Firearms, Directed Energy Weapons); By Technology (Laser, Infrared, Radar, GPS, Others); By Platform (Air, Land, Naval); By Application (Defense, Homeland Security, Law Enforcement) |
| Regional Analysis | North America – US, Canada; Europe – Germany, France, The UK, Spain, Italy, Rest of Europe; Asia Pacific – China, Japan, South Korea, India, Australia, Singapore, Rest of APAC; Latin America – Brazil, Mexico, Rest of Latin America; Middle East & Africa – GCC, South Africa, Rest of MEA |
| Competitive Landscape | BAE Systems Plc., General Dynamics Corporation, L3Harris Technologies Inc., Leonardo S.p.A., Lockheed Martin Corporation, MBDA, Northrop Grumman Corporation, Raytheon Technologies Corporation, Thales Group, The Boeing Company |
| Customization Scope | Customization for segments, region/country-level will be provided. Moreover, additional customization can be done based on the requirements. |
| Purchase Options | We have three licenses to opt for: Single User License, Multi-User License (Up to 5 Users), Corporate Use License (Unlimited Users and Printable PDF) |





































