


Report Overview
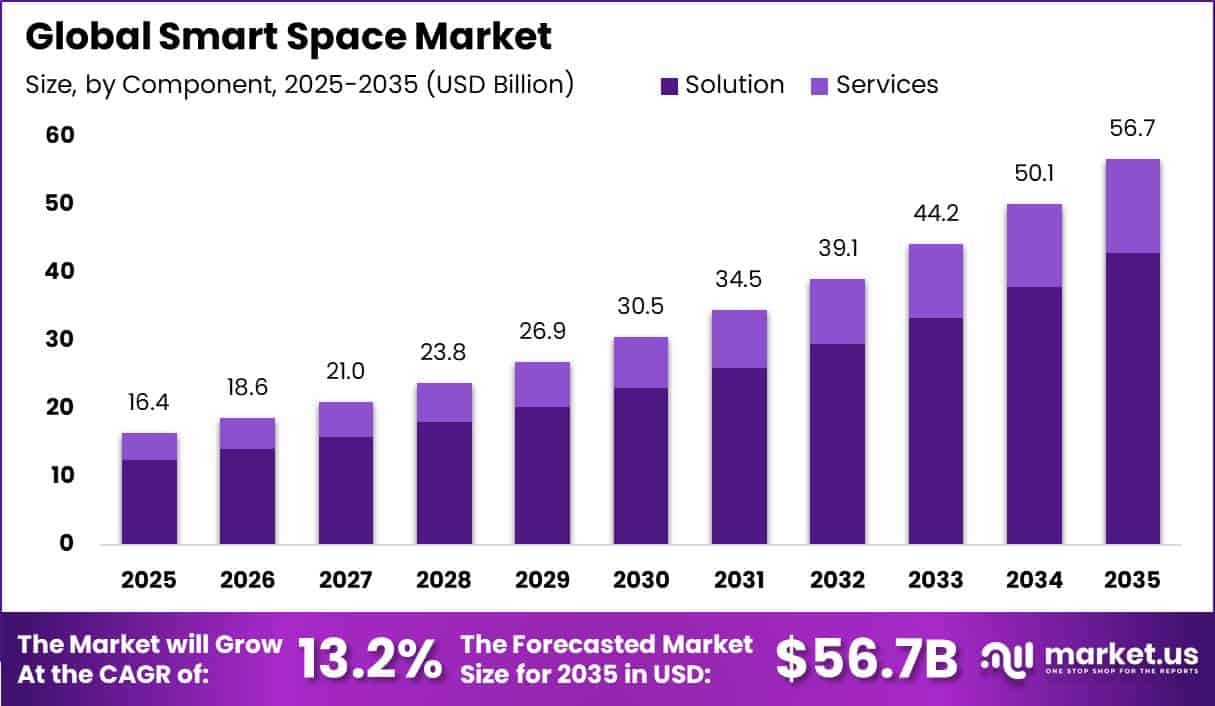
In 2025, the Global Smart Space Market was valued at USD 16.4 billion. The market is projected to grow at a CAGR of 13.2% during 2026–2035, reaching approximately USD 56.7 billion by 2035. North America dominated the global market in 2025, accounting for more than 39.2% of the total market share and generating approximately USD 6.4 billion in revenue.
Growth is being supported by the increasing need to manage larger and more energy-intensive commercial, public, and urban facilities. The United Nations expects urban areas to add nearly 2.5 billion people by 2050, which will increase demand for connected offices, hospitals, retail locations, transport hubs, and public buildings.
Smart-space technologies, including occupancy sensors, building-management software, smart lighting, access-control systems, and real-time energy monitoring, help operators reduce manual work and improve building efficiency. Energy management is also becoming more important, as building operations accounted for 26% of global energy-system emissions in 2022, according to the International Energy Agency.
The U.S. Department of Energy reports that commercial buildings cover 93 billion square feet, consume 18% of national primary energy, and generate nearly USD 190 billion in annual energy costs. Around 30% of commercial-building energy is also wasted, creating strong demand for sensors, automated controls, analytics, and intelligent building platforms that improve energy use, security, maintenance, occupancy management, and overall operating performance.
Key Takeaway
- The Smart Space Market was valued at USD 16.4 billion in 2025 and is projected to reach USD 56.7 billion by 2035, growing at a 13.2% CAGR.
- The Solution segment dominated By Component with a 75.5% market share.
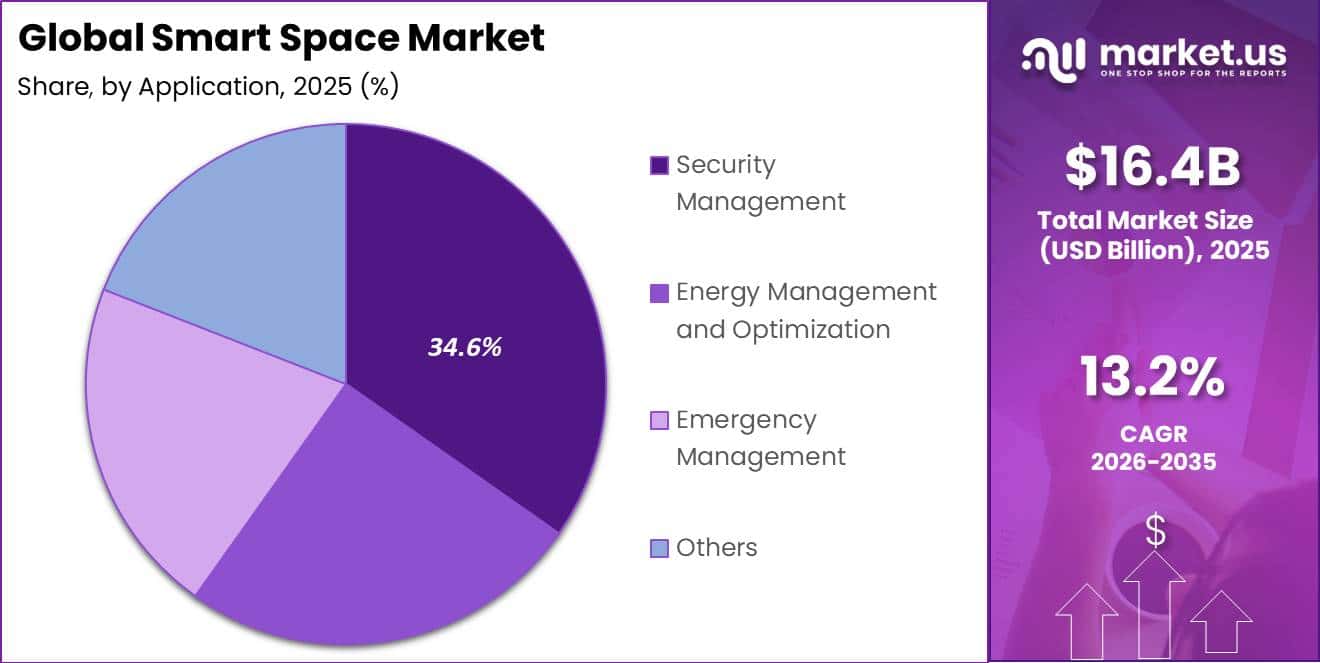
- Security Management led by Application with a 34.6% share, driven by demand across transport and public infrastructure.
- Commercial Premises led by Premises Type with a 42.5% share, supported by global services-sector growth.
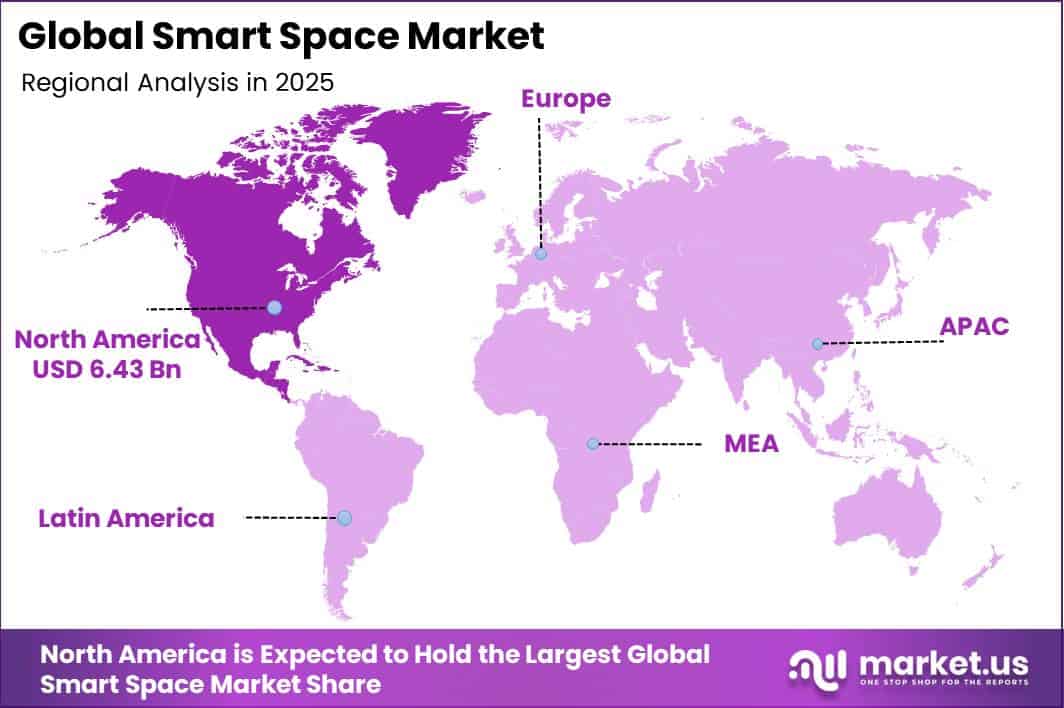
- North America led the market in 2025 with a 39.2% revenue share, worth approximately USD 6.4 billion.
Market Statistics and Data Insights
- Mandatory building decarbonisation is becoming a strong demand driver for smart-space technologies across Europe. The European Commission states that the worst-performing 16% of non-residential buildings must be renovated by 2030, increasing to 26% by 2033. Around 85% of EU buildings were constructed before 2000, and nearly 75% have poor energy performance, while the annual renovation rate remains close to 1%.
- In a 2026 Lawrence Berkeley National Laboratory experiment, machine-learning-enhanced model predictive control reduced daily HVAC energy costs by 8.7%, reduced peak-price-period load by 41.7%, and cut peak demand by 29.2% compared with baseline control.
- A 2025 LBNL field demonstration in a large commercial office found that model predictive HVAC control produced a 40%–65% decrease in demand and annual electricity-cost savings of up to 61% compared with existing rule-based controls.
- A 2025 peer-reviewed office study covering 129 days and 69 volunteers found that occupancy-centric controls reduced total room electricity use by 11.87%, air-conditioning operating hours by 25.96%, and lighting operating hours by 13.36%.
- Claroty’s 2025 analysis of more than 467,000 building-management devices across 529 organizations found that 75% of organizations operated BMS devices with known exploited vulnerabilities, 69% had devices containing vulnerabilities used in confirmed ransomware attacks, and 51% had vulnerable systems combined with insecure internet connectivity.
- Johnson Controls’ 2026 facilities-management survey found that 65% of U.S. business leaders and 67% of facility managers were already using AI to improve facility operation, utilization, and maintenance; among organizations already deploying AI, 42% of business leaders and 47% of facility managers used it for predictive maintenance.
- Johnson Controls also reported that 85% of organizations in its 2025 survey were already using workplace-management solutions, while its 2026 findings showed that 75% of organizations using workplace-management technology applied it to space management and planning.
- A Siemens smart-building project completed in 2025 at the University of San Diego achieved a 32% reduction in central-plant energy consumption based on approximately one year of measurement and verification, generating about USD 276,000 in annual utility savings.
- Artificial intelligence is becoming a day-to-day operational technology rather than only an experimental building tool. Honeywell found that nearly 60% of surveyed U.S. commercial-building decision-makers were already using AI to streamline maintenance and repair, while 63% used it to monitor unusual behaviour, 52% used location-tracking technology for occupant safety, and 45% used biometric access-control systems.
- Retrofit costs remain a major barrier because much of the existing building stock requires substantial modernization before smart systems can be fully deployed. Around 85% of EU buildings were built before 2000, and about 75% have poor energy performance, yet only around 1% are renovated each year. The European Commission also permits exemptions from EV-charging infrastructure requirements when related costs exceed 10% of total renovation costs, showing the financial pressure facing building owners.
By Component
The Solution segment holds a dominant 75.5% share of the Smart Space Market, mainly because spending is concentrated on technologies that directly improve building operations. These solutions include sensors, connected controllers, building-management platforms, access-control software, data platforms, and analytics tools.
According to the U.S. Energy Information Administration, the United States has around 5.9 million commercial buildings covering nearly 96.4 billion square feet and supporting about 85.8 million workers. Large commercial facilities create particularly strong demand for centralized smart-space solutions.
Buildings larger than 100,000 square feet represent less than 3% of all commercial buildings, but they account for around 34% of total commercial floor space. These large properties require integrated systems to manage HVAC, lighting, security, occupancy, and equipment data from a single platform.
By Application
The Security Management segment leads the Smart Space Market with a 34.6% share, supported by the growing need to protect high-traffic commercial, transport, and public facilities. Smart security systems help organizations make access decisions faster while maintaining clear digital records of people, incidents, and security events.
Demand is particularly strong across transport infrastructure, where very large passenger and baggage volumes require automated monitoring. In 2024, the U.S. Transportation Security Administration screened around 904 million passengers, 494 million checked bags, and 2.1 billion carry-on bags.
Managing activity at this scale requires advanced identity verification, access control, video surveillance, and event-management systems, as manual processes alone cannot provide consistent real-time oversight. Connected security platforms also help protect the digital networks that operate smart buildings.
By Premises Type
The Commercial Premises segment leads the Smart Space Market with a 42.5% share, supported by the growing scale of global service-based activities and continued expansion of offices, retail spaces, hotels, and other commercial facilities. According to the World Bank, services account for around 66.2% of global GDP, showing the strong economic importance of commercial activities.
Between 2000 and 2023, the service sector contributed nearly two-thirds of global GDP growth and about three-fourths of global employment growth, increasing the need for modern commercial floor space equipped with connected building systems.
Commercial construction is also expanding rapidly in major economies. In 2025, India’s commercial office stock reached nearly 1 billion square feet, after growing at an 8.6% CAGR since 2005, according to Knight Frank. Each new commercial building requires systems for HVAC control, lighting, energy monitoring, access management, tenant security, and performance reporting.
Key Market Segments
By Component
- Solution
- Services
By Application
- Security Management
- Energy Management and Optimization
- Emergency Management
- Others
By Premises Type
- Commercial
- Residential
- Others
Geopolitical Impact Analysis
Geopolitical disruptions are increasing the cost and supply risk of smart-space hardware, including sensors, cameras, RFID readers, gateways, controllers, switches, semiconductors, copper wiring, and metal enclosures. According to UN Trade and Development, by mid-2024, tonnage passing through the Suez Canal had declined by 70%, while arrivals around the Cape of Good Hope increased by 89%.
The longer shipping route added around 12% to container-ship demand and pushed Shanghai–Northern Europe spot freight rates up by 256% to USD 2,648 per TEU in February 2024. UNCTAD also estimated that rerouting between the Far East and Northwest Europe can add about 10 days to two weeks to sailing time.
Trade and commodity risks are also affecting equipment costs. The World Trade Organization reported that China’s 2025 simple-average most-favoured-nation tariff stood at 7.5%, although duties on specific electronics and industrial inputs can be higher. The World Bank forecast copper prices at USD 9,700 per metric ton in 2025, around 6.1% above 2024 levels.
Copper is widely used in cabling, circuit boards, power systems, motors, and network infrastructure. Energy prices add further pressure. The International Energy Agency reported that Brent crude increased by USD 5 per barrel to USD 74 per barrel following the June 2025 Israel-Iran escalation, raising freight, plastics, and installation costs and increasing the advantage of local sourcing and regional inventory.
Regional Analysis
North America led the global Smart Space Market in 2025, accounting for 39.2% of worldwide revenue and generating approximately USD 6.4 billion. The region’s strong position is supported by widespread adoption of IoT-based building controls, cloud platforms, smart access systems, connected lighting, and workplace analytics across offices, hospitals, universities, retail facilities, airports, and public infrastructure.
The United States remains the main demand centre because its large non-residential building base requires regular automation upgrades, system integration, and asset-performance monitoring. U.S. construction spending reached an annualized USD 2.14 trillion in May 2025, including USD 753.3 billion in non-residential construction.
Asia Pacific is expected to be the fastest-growing regional market, supported by rapid urbanization, expanding commercial floor space, smart-city development, and digital infrastructure investment across China, India, Southeast Asia, Japan, and South Korea. The region is increasingly adopting integrated platforms that combine sensors, surveillance, access control, HVAC management, and real-time analytics.
India’s office stock approached 1 billion square feet in 2025, showing the scale of commercial facilities requiring connected management systems. North America is expected to retain its revenue leadership due to higher technology spending per building, while Asia Pacific is likely to record stronger expansion as new projects include smart-space technologies during the design and construction stages.
Key Regions and Countries
North America
- US
- Canada
Europe
- Germany
- France
- The UK
- Spain
- Italy
- Rest of Europe
Asia Pacific
- China
- Japan
- South Korea
- India
- Australia
- Rest of APAC
Latin America
- Brazil
- Mexico
- Rest of Latin America
Middle East & Africa
- GCC
- South Africa
- Rest of MEA
Market Dynamics
Drivers
| Driver | (~) % CAGR | Geographic Relevance | Impact Timeline |
|---|---|---|---|
| Building energy-performance mandates | +2.2% | Europe, North America | Short term (2 years or less) |
| Connected-security upgrades | +1.6% | Global commercial hubs | Short term (2 years or less) |
| Data-centre infrastructure expansion | +1.4% | North America, Asia Pacific | Medium term (2 to 4 years) |
| Workplace utilization analytics | +1.1% | North America, Europe | Short term (2 years or less) |
| Smart-city infrastructure procurement | +0.9% | Asia Pacific, Middle East | Medium term (2 to 4 years) |
Building energy-performance mandates
Mandatory building decarbonisation is a major growth driver for the Smart Space Market, as controls, sensors, energy-management software, and sub-metering are increasingly becoming compliance-led investments.
The European Commission’s revised Energy Performance of Buildings Directive entered into force on 28 May 2024 and required national transposition by 29 May 2026. It targets renovation of the worst-performing 16% of non-residential buildings by 2030 and 26% by 2033.
IEA tracking shows that buildings account for around 30% of global energy demand, supporting stronger demand for HVAC, lighting, occupancy, and power optimization. This shift toward recurring monitoring, controls-as-a-service, and performance reporting could contribute around +2.2% incremental growth within the 13.2% baseline CAGR.
Restraints
| Restraint | (~) % CAGR | Geographic Relevance | Impact Timeline |
|---|---|---|---|
| Retrofit capital-access constraints | -1.8% | Global | Short term (2 years or less) |
| Fragmented procurement budgets | -1.2% | Global | Short term (2 years or less) |
| Legacy-system replacement costs | -1.0% | North America, Europe | Medium term (2 to 4 years) |
| Construction-project deferrals | -0.9% | Europe, Asia Pacific | Short term (2 years or less) |
| Data-sovereignty restrictions | -0.7% | Europe, China, Middle East | Medium term (2 to 4 years) |
Retrofit capital-access constraints
Retrofit capital constraints remain a major near-term restraint because smart-space projects require upfront spending on hardware, electrical work, network upgrades, commissioning, and system integration before savings are realized.
The World Bank projected global growth of only 2.7% for 2025, which can reduce property owners’ willingness to approve non-essential modernization projects. Higher financing costs also make large retrofit programs harder to justify.
The European Commission allows exemptions from charging-infrastructure requirements when costs exceed 10% of renovation cost, showing how capital intensity can delay even required upgrades. As a result, owners may phase projects, extend payback periods, or prioritize critical repairs, creating an estimated -1.8% drag on the baseline CAGR.
Challenges
| Challenge | (~) % CAGR | Geographic Relevance | Mitigation Horizon |
|---|---|---|---|
| Interoperability across legacy estates | -1.5% | Global | Medium term (2 to 4 years) |
| Operational technology cyber risk | -1.3% | Global | Medium term (2 to 4 years) |
| Controls engineering talent gaps | -1.0% | North America, Europe | Long term (4 years or more) |
| Semiconductor supply volatility | -0.8% | Global | Medium term (2 to 4 years) |
| Building data quality inconsistency | -0.7% | Global | Medium term (2 to 4 years) |
Interoperability across legacy estates
Interoperability remains a major growth challenge because many buildings contain equipment installed across different renovation cycles, often using incompatible protocols, incomplete asset records, and proprietary control systems.
The European Commission’s life-cycle global-warming framework requires disclosure from January 2028 for new buildings larger than 1,000 m² and from January 2030 for all new buildings, increasing the need for reliable and standardized building-data systems.
IEA analysis shows that commercial and public buildings represent roughly 30% of building-sector energy demand, making effective data integration important for both energy optimization and reporting. NIST guidance also stresses asset identification, secure configuration, and lifecycle maintenance for IoT systems.
Poor interoperability increases engineering work, extends commissioning time, and raises implementation risk, creating an estimated -1.5% ceiling drag until building owners adopt open protocols, normalized data models, and stronger lifecycle asset governance.
Opportunities
| Opportunity | (~) % CAGR | Geographic Relevance | Execution Window |
|---|---|---|---|
| Grid-interactive building services | +2.0% | North America, Europe, Asia Pacific | Medium term (2 to 4 years) |
| Outcome-based retrofit contracts | +1.6% | Global | Medium term (2 to 4 years) |
| Digital-twin portfolio subscriptions | +1.4% | North America, Europe | Medium term (2 to 4 years) |
| Healthy-building service bundles | +1.1% | Global urban centres | Short term (2 years or less) |
| Middle-market managed platforms | +0.9% | Asia Pacific, Latin America | Long term (4 years or more) |
Grid-interactive building services
Grid-interactive building services represent a major untapped opportunity, as most connected buildings still use automation mainly for internal efficiency rather than demand flexibility, storage coordination, and distributed-energy optimization.
This remains a future growth area. The European Commission requires new office buildings and major office renovations to provide at least one charging point for every 2 parking spaces from 30 May 2026, creating controllable electrical loads that can be managed with HVAC, batteries, and on-site generation.
IEA tracking shows that buildings account for around 30% of global energy demand, while the European Commission requires all new buildings to be designed to optimize solar generation for permits submitted after 29 May 2026. A potential +2.0% CAGR upside depends on converting building-load data into shared energy value and reducing customer acquisition costs through utility, fleet, and property partnerships.
Key Players Analysis
The Smart Space Market is mainly led by Tier-1 automation and digital infrastructure companies, including Siemens, Schneider Electric, ABB, Cisco, and Huawei. These companies benefit from large installed bases, strong distribution networks, advanced software capabilities, and the financial strength needed to deliver complete smart-building platforms.
Siemens reported FY2024 Smart Infrastructure revenue of €21.3 billion, within total group revenue of €75.9 billion. Schneider Electric generated €38.1 billion in 2024 revenue, including €31.1 billion from Energy Management. ABB’s Electrification business recorded USD 15.4 billion in 2024 revenue, increasing by 6%, highlighting the scale of its smart power and building-control operations.
Cisco and Huawei strengthen the connectivity and data-platform side of the market. Cisco reported USD 53.8 billion in fiscal 2024 revenue, while subscription revenue increased by 11% to USD 27.4 billion, representing 51% of total sales. Its Splunk acquisition added about USD 1.4 billion in fiscal-2024 revenue.
Huawei generated CNY 862.1 billion in 2024 revenue, including CNY 369.9 billion from ICT Infrastructure, while R&D spending reached CNY 179.7 billion, equal to 20.8% of revenue.
Tier-2 companies, including Hitachi Vantara, ICONICS, Spacewell, Adappt Intelligence, and Smart Spaces, compete through specialist software, digital twins, workplace platforms, and integration services. However, Tier-1 firms remain stronger in large, multi-site deployments due to broader hardware, software, and service portfolios.
Top Key Players in the Market
- ABB
- Adappt Intelligence
- Cisco Systems, Inc
- Hitachi Vantara LLC
- Huawei Technologies Co., Ltd.
- ICONICS, Inc.
- Smart Spaces
- Spacewell International NV
- Siemens
- Schneider Electric
Recent Developments
- In February 2025, Schneider Electric completed the acquisition of a 75% controlling interest in Motivair, strengthening its capabilities in liquid cooling and thermal management for high-performance computing and digital infrastructure. The transaction was originally valued at USD 850 million, while Schneider Electric expects to acquire the remaining 25% in 2028.
- In March 2025, ABB completed its acquisition of Siemens’ Wiring Accessories business in China, expanding its smart-building and home-automation portfolio. The acquired business generated more than USD 150 million in annual revenue, employed around 350 people, and provided ABB access to a distribution network covering 230 cities.
Report Scope
| Report Features | Description |
|---|---|
| Market Value (2025) | USD 16.4 Billion |
| Forecast Revenue (2035) | USD 56.7 Billion |
| CAGR (2026-2035) | 13.2% |
| Base Year for Estimation | 2025 |
| Historic Period | 2020-2024 |
| Forecast Period | 2026-2035 |
| Report Coverage | Revenue Forecast, Market Dynamics, Competitive Landscape, Recent Developments |
| Segments Covered | By Component (Solution, Services); By Application (Security Management, Energy Management and Optimization, Emergency Management, Others); By Premises Type (Commercial, Residential, Others) |
| Regional Analysis | North America – US, Canada; Europe – Germany, France, The UK, Spain, Italy, Rest of Europe; Asia Pacific – China, Japan, South Korea, India, Australia, Singapore, Rest of APAC; Latin America – Brazil, Mexico, Rest of Latin America; Middle East & Africa – GCC, South Africa, Rest of MEA |
| Competitive Landscape | ABB, Adappt Intelligence, Cisco Systems Inc., Hitachi Vantara LLC, Huawei Technologies Co., Ltd., ICONICS Inc., Smart Spaces, Spacewell International NV, Siemens, Schneider Electric |
| Customization Scope | Customization for segments, region/country-level will be provided. Moreover, additional customization can be done based on the requirements. |
| Purchase Options | We have three licenses to opt for: Single User License, Multi-User License (Up to 5 Users), Corporate Use License (Unlimited Users and Printable PDF) |





























