


Short Video Platforms Market Overview
Global Short Video Platforms Market size is expected to be worth around USD 7.2 Billion by 2035 from USD 2.2 Billion in 2025, growing at a CAGR of 12.8% during the forecast period 2026 to 2035.
The short video platforms market encompasses digital ecosystems where users create, share, and consume video content typically ranging from a few seconds to several minutes. The market spans advertising-supported, subscription, tipping, and shoppable commerce revenue models, serving individual creators, brands, and media companies across mobile-first and web-based platforms globally.
Key Takeaways
- The Global Short Video Platforms Market is valued at USD 2.2 Billion in 2025 and is forecast to reach USD 7.2 Billion by 2035, at a CAGR of 12.8%.
- Pre-Recorded Video Posts dominates the Content Type segment with a 59.1% share in 2025.
- Advertising-Supported monetization leads the Monetization Model segment with a 77.1% share.
- Application-Based Platforms holds a 89.2% share in the Deployment segment.
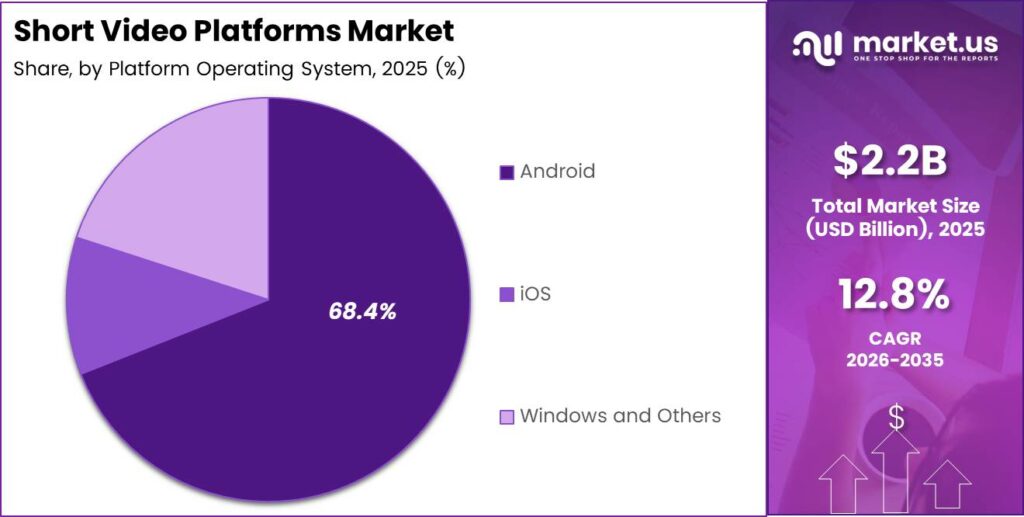
- Android leads the Platform Operating System segment with a 68.4% share.
- The 18–24 Years age group is the dominant user demographic with a 36.1% share.
- Media and Entertainment is the leading end-user industry with a 50.2% share.
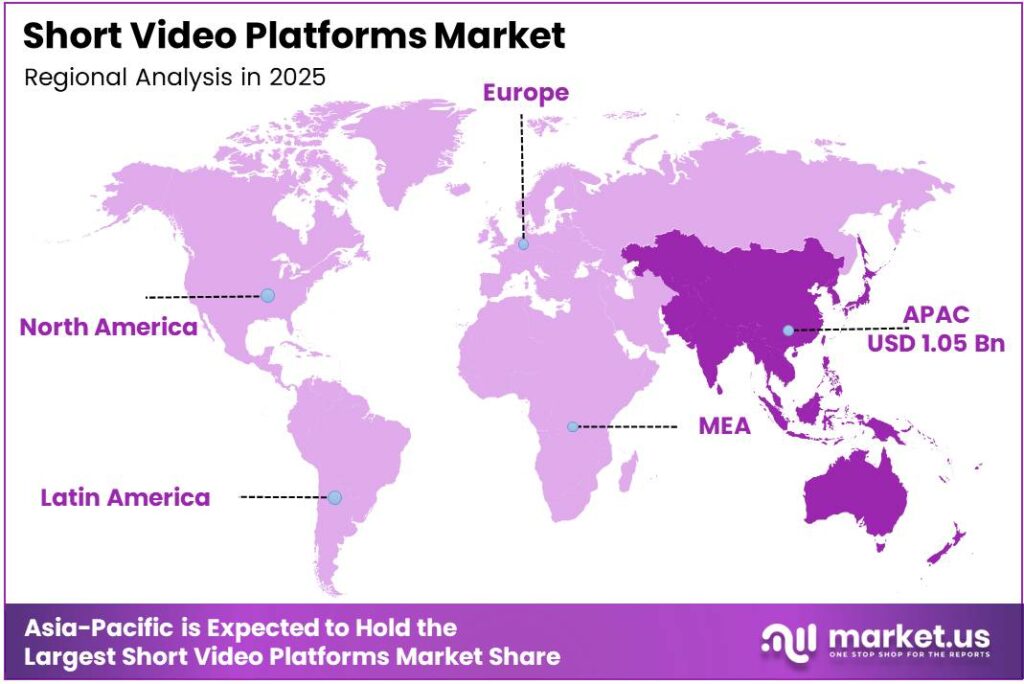
- Asia-Pacific is the dominant region, holding a 48.2% market share valued at USD 1.05 Billion.
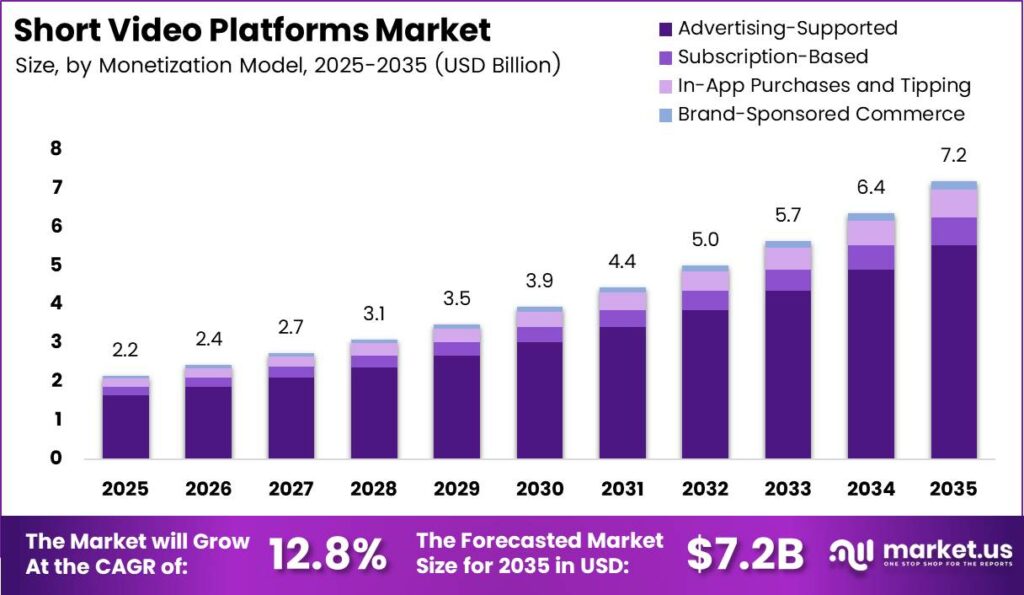
According to International Telecommunication Union data, global internet users reached 6 billion, representing 74% of the world’s population in 2025. This scale of connectivity directly expands the addressable audience for short video platforms. Platforms operating in this environment gain the user base needed to sustain high-frequency content loops and advertiser demand simultaneously.
International Telecommunication Union data shows 5G networks covered 55% of the world’s population in 2025. Faster mobile connectivity enables seamless high-resolution video streaming, which directly supports higher watch-time completion rates. As per our research, world trade in goods and commercial services grew 8% to USD 34.89 trillion in 2025, reflecting the global digital commerce environment in which short video commerce features are scaling.
Kuaishou’s Chinese New Year content generated 250 billion short-video views and 15 billion live-streaming views in Q1 2026, demonstrating the power of culturally anchored content events. Meta introduced AI-powered Facebook creative and sharing tools in June 2026, signaling that generative AI is now a platform-level infrastructure investment. These developments confirm that content supply expansion and AI tooling are the two dominant competitive vectors for this market over the forecast period.
Content Type Analysis
Pre-Recorded Video Posts dominates with 59.1% due to creator flexibility and editing quality advantage.
In 2025, Pre-Recorded Video Posts held a dominant market position in the By Content Type segment of the Short Video Platforms Market, with a 59.1% share. This segment includes short-form edited videos, user-generated content clips, and tutorials. As reported by Meta Platforms, Inc., Reels accounted for 60% of Facebook’s total creator payments in 2025, confirming that edited short-form content generates the highest platform-level monetization returns.
Nearly 10% of daily Facebook Reels views came from videos created in Meta’s Edits application during Q4 2025, according to Meta Platforms, Inc. This signals that in-platform editing tools are reshaping content production behavior. Platforms offering integrated creation tools gain a structural advantage by reducing friction between creation and publishing, which directly increases content supply volume and advertiser inventory.
Live Video serves a distinct audience segment through events, interactive sessions, gaming streams, and Q&A formats. Kuaishou’s live-streaming revenue reached RMB 39.1 billion in 2025, according to Kuaishou Technology, reflecting sustained commercial viability of the live format. This revenue stream supports a parallel monetization model built on virtual gifting and real-time audience participation rather than pre-roll advertising.
In June 2025, TikTok introduced Manage Topics and enhanced Smart Keyword Filters, giving users greater control over recommended content. This development strengthens the discovery layer for Short-Video Stories and other ephemeral formats. Short-Video Stories hold a smaller but structurally distinct share, functioning as daily-habit content tied to personal expression rather than produced entertainment.
Monetization Model Analysis
Advertising-Supported dominates with 77.1% due to zero-cost user entry and mass advertiser reach.
In 2025, Advertising-Supported held a dominant market position in the By Monetization Model segment of the Short Video Platforms Market, with a 77.1% share. Alphabet Inc. reported that YouTube advertising revenue increased 15% year over year to USD 10.3 billion in Q3 2025. This confirms that ad-supported short video generates material revenue at scale, making it the primary commercial architecture for platforms targeting broad, price-sensitive audiences.
Alphabet Inc. data shows YouTube Shorts generated more revenue per watch hour than traditional in-stream YouTube viewing in Q3 2025 in the United States. This metric reframes Shorts from a defensive product into an active margin contributor. Platforms that can improve short-video ad yields relative to long-form inventory hold a structural pricing advantage in negotiations with large brand advertisers.
Subscription-Based models, including SVOD and freemium tiers, capture users seeking ad-free or exclusive experiences. Kuaishou Technology reported live-streaming revenue of RMB 39.1 billion in 2025, reflecting the scale of in-app tipping and virtual gifting as a non-advertising revenue pillar. Digitally deliverable product trade grew 10% in 2025, according to United Nations Trade and Development, confirming that subscription and digital commerce models are expanding across global platforms.
Brand-Sponsored Commerce with shoppable tags represents the highest-margin growth vector within monetization. Kuaishou Technology data shows short-video e-commerce GMV grew more than 30% year over year in Q2 2025. This growth rate outpaces both advertising and subscription models, signaling that commerce-integrated monetization is the most commercially significant structural shift underway in this segment.
Deployment Analysis
Application-Based Platforms dominates with 89.2% due to mobile-native design and push notification reach.
In 2025, Application-Based Platforms held a dominant market position in the By Deployment segment of the Short Video Platforms Market, with an 89.2% share. Alphabet Inc. data confirms YouTube content viewers globally streamed more than 1 billion hours per day on television screens in 2024. This figure illustrates that native app architecture extends beyond smartphones into connected television, expanding total viewing inventory without requiring separate platform infrastructure.
Web-Based Platforms serve a functionally different audience segment, including corporate users, desktop researchers, and regions where native app distribution faces regulatory friction. As per our research, global mobile-network coverage exceeded 98% of the population in 2024, leaving approximately 170 million people outside mobile coverage. This residual uncovered population represents the primary structural use case for web-based short video access, particularly in fixed-broadband-dependent markets.
Platform Operating System Analysis
Android dominates with 68.4% due to device volume leadership in emerging and mid-tier markets.
In 2025, Android held a dominant market position in the By Platform Operating System segment of the Short Video Platforms Market, with a 68.4% share. Data from World Bank shows 5G coverage in lower-middle-income countries rose from 5% of the population in 2022 to 35% in 2024. This infrastructure expansion directly benefits Android-first platforms, as affordable Android devices are the primary access point for newly connected users in these markets.
iOS holds a smaller but commercially valuable share concentrated in high-income markets where per-user advertising yield and in-app purchase conversion rates are structurally higher. Windows and Others serve niche use cases. This operating system concentration means short video platforms that optimize Android performance first capture the largest user volume, while iOS optimization drives the highest revenue-per-user outcomes.
User Demographics Age Group Analysis
18–24 Years dominates with 36.1% due to high content creation and daily platform engagement rates.
In 2025, the 18–24 Years age group held a dominant market position in the By User Demographics Age Group segment of the Short Video Platforms Market, with a 36.1% share. International Telecommunication Union data shows 82% of people aged 15–24 used the internet in 2025, compared with 72% of the rest of the population. This connectivity gap confirms that younger cohorts remain structurally more digitally active, sustaining their outsized platform share.
The 13–17 Years cohort represents the next tier, driving high content creation volume but attracting increasing regulatory scrutiny on advertising targeting. The 25–34 Years group offers greater purchasing power and higher commerce-conversion potential per session. The 35–44 Years and 45+ Years segments hold smaller shares but are growing as platform interfaces simplify and content categories expand into finance, health, and professional education.
End-User Industry Analysis
Media and Entertainment dominates with 50.2% due to existing content production capacity and creator density.
In 2025, Media and Entertainment held a dominant market position in the By End-User Industry segment of the Short Video Platforms Market, with a 50.2% share. This segment encompasses music videos, dance content, comedy, viral clips, lifestyle, and fashion content. Kuaishou Technology reported 410 million average daily active users in 2025, with a content supply that is weighted toward entertainment formats, confirming that entertainment remains the primary use case driving platform-level daily active user counts.
Education and EduTech is a structurally distinct growth segment, encompassing micro-learning modules and instructor-led short lessons. Kuaishou Technology data shows the average daily active Shopping Mall merchant count increased 30% year over year in Q2 2025, demonstrating that commerce functionality is growing alongside educational formats as platforms diversify their content-to-revenue pathways beyond pure entertainment.
Retail and Live Commerce is the highest-value industry vertical by revenue-per-content-unit, operating through influencer-led flash sales and in-app shoppable videos. Travel and Hospitality represents a growing category, particularly as destination creators and tourism boards use short-form video to drive direct booking intent. Travel content benefits from strong completion rates driven by visual storytelling, which improves ad yield and organic discovery simultaneously.
Short Video Platforms Market Segments
By Content Type
- Pre-Recorded Video Posts
- Short-Form Edited Videos
- User-Generated Content (UGC) Videos
- Tutorials and How-To Clips
- Live Video
- Live Streaming for Events
- Interactive Live Video Sessions
- Live Gaming Streams
- Live Q&A and Webinars
- Short-Video Stories (Ephemeral)
By Monetization Model
- Advertising-Supported
- Subscription-Based (SVOD, Freemium)
- In-App Purchases and Tipping
- Brand-Sponsored Commerce (Shoppable Tags)
By Deployment
- Application-Based Platforms
- Web-Based Platforms
By Platform Operating System
- Android
- iOS
- Windows and Others
By User Demographics
- 18–24 Years
- 13–17 Years
- 25–34 Years
- 35–44 Years
- 45+ Years
By End-User Industry
- Media and Entertainment
- Music Videos and Dance Content
- Comedy and Viral Clips
- Lifestyle and Fashion Content
- Education and EduTech
- Micro-Learning Modules
- Instructor-Led Short Lessons
- Retail and Live Commerce
- Influencer-Led Flash Sales
- In-App Shoppable Videos
- Travel and Hospitality
- Others
Short Video Platforms Market Regional Analysis
Asia-Pacific Dominates the Short Video Platforms Market with a Market Share of 48.2%, Valued at USD 1.05 Billion
Asia-Pacific holds the largest regional share of the Short Video Platforms Market at 48.2%, valued at USD 1.05 Billion in 2025. As reported by United Nations Trade and Development, Asia and Oceania merchandise exports increased 9.0% in 2025. This trade expansion reflects the broader economic momentum that is fueling digital advertising budgets and live commerce adoption across the region’s platform ecosystem.
Developing economies represent the fastest-growing regional cohort for short video platform adoption. United Nations Trade and Development data shows developing economies exported USD 1.3 trillion in digitally deliverable products in 2025, up 12% year over year. This export growth signals that digital infrastructure investment in these economies is reaching a level that directly enables creators and small businesses to participate in platform commerce at scale.
North America and Europe represent mature but high-yield regional markets. Figures from United Nations Trade and Development show digitally deliverable services accounted for 56% of worldwide services exports in 2024, with global ICT-services trade totaling USD 1.2 trillion. In June 2026, Snapchat introduced AI-powered advertising capabilities including Image-to-Video and Smart Upscale, targeting these high-CPM markets where brand advertising budgets are concentrated and short-form video ad adoption is accelerating.
Key Regions and Countries
North America
- US
- Canada
Europe
- Germany
- France
- The UK
- Spain
- Italy
- Rest of Europe
Asia Pacific
- China
- Japan
- South Korea
- India
- Australia
- Rest of APAC
Latin America
- Brazil
- Mexico
- Rest of Latin America
Middle East and Africa
- GCC
- South Africa
- Rest of MEA
Market Dynamics
Market Opportunity Analysis - Underexploited segments and emerging regions present high-return entry points for platform investors and commerce-focused operators
The Brand-Sponsored Commerce segment, holding a minority share within the 77.1% advertising-dominated monetization model, represents the clearest underexploited revenue opportunity in this market. Kuaishou’s short-video e-commerce GMV growth of more than 30% in Q2 2025 demonstrates that commerce monetization can outpace advertising growth within the same platform. New entrants that prioritize shoppable video infrastructure early can establish merchant relationships before the dominant ad-supported platforms fully close this gap.
The 35–44 Years and 45+ Years demographic segments represent an underserved audience within the 36.1% youth-dominated user base. These cohorts carry higher disposable income and stronger purchase intent per session than the dominant 18–24 Years group. Platforms and brands that develop content formats tailored to older demographics can capture premium advertising rates without competing directly against youth-focused incumbents on content volume or creator count.
Web-Based Platforms hold a structurally underserved position within the 89.2% application-dominated deployment segment. Corporate users, regulated industries, and government-device-restriction markets cannot reliably access native apps. Operators that invest in full-featured web experiences capture an audience segment that larger mobile-first platforms systematically underserve, creating a defensible niche with lower creator-acquisition costs.
The Education and EduTech end-user industry segment remains underdeveloped relative to Media and Entertainment’s 50.2% dominance. Micro-learning and instructor-led short lessons serve a use case with high completion rates, strong repeat-session behavior, and institutional subscription potential. This segment offers platform operators a revenue model that is structurally insulated from entertainment content volatility and less exposed to advertising cycle fluctuations.
Technology and Innovation Landscape - AI-generated content tools, algorithm upgrades, and commerce infrastructure are reshaping platform competitiveness
Generative AI video creation is the fastest-moving technology layer in this market. In September 2025, YouTube integrated Google DeepMind’s Veo 3 Fast into Shorts, enabling creators to generate video backgrounds and clips with sound. This capability removes the camera and production skill barrier for new creators, directly expanding content supply and the long-tail inventory available to advertisers without requiring additional human labor.
In March 2025, Snapchat introduced generative AI Video Lenses for Snapchat Platinum subscribers, allowing users to create animated and AI-generated video effects within the camera experience. This positions AI creation tools as a subscription differentiator rather than a free feature. Platforms that gate advanced AI capabilities behind paid tiers create a direct monetization pathway from technology investment, reducing reliance on advertising yield alone.
AI-driven recommendation algorithms are becoming a primary performance variable across platform operators. Meta’s algorithm surfaced more than 25% more same-day Reels in Q4 2025, while original content reached 75% of U.S. Instagram recommendations. This algorithmic advantage creates a compounding effect: better recommendations increase watch time, which improves advertiser outcomes, which attracts larger media budgets, which funds further algorithm investment.
World Trade Organization data shows artificial intelligence could raise global trade by 34–37% by 2040 if digital infrastructure, skills, and policy gaps are addressed. For short video platforms, this projection signals that AI-enabled commerce features, cross-border creator tools, and automated localization technology are not peripheral features. They are the infrastructure investments that will determine which platforms capture the largest share of the next decade’s digital trade expansion.
Drivers
Algorithmic content discovery drives platform growth by converting passive browsing into high-completion viewing sessions without requiring users to follow established accounts. Product changes across 2024 and 2025 combined watch-time, replay, sharing, and preference signals to improve relevance for newly uploaded content. This supports an estimated +2.4% incremental contribution to the 12.8% baseline CAGR by raising daily engagement and increasing sellable impressions per active user.
Mobile video advertising budgets are shifting from display toward short-form video inventory, reflecting higher completion and conversion rates. Creator monetization programs are expanding across platforms, enabling more professional-grade content supply. Affordable smartphone penetration in Asia-Pacific, Latin America, and Africa is extending the user base into lower-income tiers, while vertical video production tools lower the skill barrier for new creators entering the ecosystem.
| Driver | (~) % Impact on CAGR Forecast | Geographic Relevance | Impact Timeline |
|---|---|---|---|
| Algorithmic Content Discovery | +2.4% | Global | Short term (≤ 2 years) |
| Mobile Video Advertising Shift | +2.1% | North America, Europe, Asia-Pacific | Short term (≤ 2 years) |
| Creator Monetization Expansion | +1.8% | Global | Medium term (2–4 years) |
| Affordable Smartphone Penetration | +1.5% | Asia-Pacific, Latin America, Africa | Medium term (2–4 years) |
| Vertical Video Production Tools | +1.2% | Global | Short term (≤ 2 years) |
| Live Commerce Adoption | +1.0% | China, Southeast Asia, North America | Medium term (2–4 years) |
Restraints
National-security scrutiny can immediately interrupt advertising continuity, creator income, and merchant demand rather than gradually slowing adoption. The 2024 U.S. divest-or-ban legislation created a statutory path toward restricted availability for a major short-video service, while India’s continuing restrictions demonstrated the commercial consequence of a large market becoming inaccessible. A forced restructuring or service interruption in a major national market creates an estimated -2.3% deduction from the 12.8% baseline CAGR.
Minor-targeting advertising restrictions in the European Union, United Kingdom, and North America reduce monetizable inventory among the 13–17 year age cohort. Cross-border data restrictions impose infrastructure duplication costs across platforms operating in multiple jurisdictions. Music licensing cost inflation, app-store payment fees, and government device restrictions each apply additional margin pressure that collectively limits the pace at which platform operators can reinvest in product development and creator acquisition.
| Restraint | (~) % Impact on CAGR Forecast | Geographic Relevance | Impact Timeline |
|---|---|---|---|
| Platform Access Bans | -2.3% | United States, India, selected national markets | Short term (≤ 2 years) |
| Minor-Targeting Advertising Limits | -1.7% | European Union, United Kingdom, North America | Short term (≤ 2 years) |
| Cross-Border Data Restrictions | -1.4% | United States, Europe, India, China | Medium term (2–4 years) |
| Music Licensing Cost Inflation | -1.1% | Global | Short term (≤ 2 years) |
| App-Store Payment Fees | -0.8% | Global | Medium term (2–4 years) |
| Government Device Restrictions | -0.6% | North America, Europe, Asia-Pacific | Short term (≤ 2 years) |
Challenges
Trust and safety scaling represents the highest-friction structural challenge because each increase in uploads, livestreams, and commerce listings expands the moderation surface faster than manual review capacity. European Union Digital Services Act requirements mandate recommender-system changes, age-assurance controls, and audit trails for very large platforms. These obligations create an estimated -1.9% friction drag on maximum growth potential that extends over a mitigation horizon of at least 4 years.
Generative AI content volume is compressing signal quality in recommendation systems, creating a content-flood problem that platforms must address through classifier investment. Creator income concentration discourages mid-tier creators, which reduces content diversity and weakens the long-tail supply that sustains advertiser inventory breadth. Video infrastructure cost pressure, attribution measurement fragmentation across privacy-constrained environments, and content rights identification together constrain the operational efficiency gains that would otherwise accelerate net margin expansion.
| Challenge | (~) % CAGR Friction Drag | Geographic Relevance | Mitigation Horizon |
|---|---|---|---|
| Trust and Safety Scaling | -1.9% | Global | Long term (≥ 4 years) |
| Generative AI Content Flood | -1.6% | Global | Medium term (2–4 years) |
| Creator Income Concentration | -1.3% | Global | Medium term (2–4 years) |
| Video Infrastructure Cost Pressure | -1.1% | Global | Medium term (2–4 years) |
| Attribution Measurement Fragmentation | -0.9% | North America, Europe, Asia-Pacific | Medium term (2–4 years) |
| Content Rights Identification | -0.7% | Global | Long term (≥ 4 years) |
Opportunities
Performance commerce media represents the largest near-term revenue upside because most short-video platforms still monetize engagement through impression-based advertising rather than closed-loop commerce. Deliberate execution of merchant tooling, checkout integration, and affiliate settlement could add an estimated +2.2% to the 12.8% baseline CAGR. Platforms that reduce merchant content-production costs by 15–30% through creator assets and automated catalog feeds unlock a repeatable commerce revenue model.
Business software creator tools, connected television extensions, and local-language SME commerce in India, Southeast Asia, Latin America, and Africa represent medium-to-long-term structural opportunities. Synthetic media licensing and creator services consolidation offer additional upside for platforms that move early to establish ownership of the AI-generated content supply chain. Each of these opportunities rewards platforms that invest ahead of advertiser and creator demand rather than responding after competitors have established category positions.
| Opportunity | (~) % Potential CAGR Upside | Geographic Relevance | Execution Window |
|---|---|---|---|
| Performance Commerce Media | +2.2% | Asia-Pacific, North America, Europe | Medium term (2–4 years) |
| Business Software Creator Tools | +1.7% | Global | Medium term (2–4 years) |
| Connected Television Extensions | +1.4% | North America, Europe, Asia-Pacific | Long term (≥ 4 years) |
| Local-Language SME Commerce | +1.3% | India, Southeast Asia, Latin America, Africa | Medium term (2–4 years) |
| Synthetic Media Licensing | +1.1% | Global | Long term (≥ 4 years) |
| Creator Services Consolidation | +0.9% | North America, Europe, Asia-Pacific | Long term (≥ 4 years) |
Top Key Players Insights
The Short Video Platforms Market concentrates around three Tier 1 operators that hold structural advantages in algorithm maturity, creator investment, and advertising yield. ByteDance, Meta Platforms, and Alphabet collectively control the largest global daily active user bases and the deepest advertiser relationships. Facebook paid creators nearly USD 3 billion in 2025, while YouTube Shorts averaged more than 200 billion daily views, confirming that creator economics and engagement scale are the two primary competitive moats at the top tier.
Tier 2 challengers including Kuaishou, Snap, and Tencent compete through regional dominance, camera-first product differentiation, and ecosystem integration rather than global scale. Kuaishou recorded 410 million average daily active users in 2025 and grew total revenue 12.5% year over year to RMB 142.8 billion, demonstrating that regional depth can generate platform-level economics comparable to global operators. This creates a two-speed competitive dynamic where Tier 1 wins on breadth and Tier 2 wins on market-specific depth.
Tier 3 operators including Bilibili, Chingari, ShareChat, Triller, and others compete on vertical specialization and language localization rather than algorithmic reach. These platforms serve audiences that Tier 1 and Tier 2 operators systematically underserve, including regional language communities, niche interest groups, and creator ecosystems in markets with platform access restrictions. This specialization strategy limits scale but creates defensible audience loyalty that larger platforms cannot easily replicate through algorithm adjustments alone.
Key Players
- ByteDance Ltd. (TikTok / Douyin)
- Meta Platforms, Inc. (Instagram Reels / Facebook Reels)
- Alphabet Inc. (YouTube Shorts)
- Kuaishou Technology
- Snap Inc. (Snapchat Spotlight)
- Tencent Holdings Ltd. (Weishi / Channels)
- Bigo Technology Pte. Ltd. (Likee)
- Pinterest Inc.
- Reddit Inc.
- Netflix Inc. (Fast Laughs)
- Triller Inc.
- Chingari App Pvt. Ltd.
- Xiaohongshu (Zhiliao Technology)
- JOYY Inc. (Bigo Live)
- ShareChat (MX TakaTak)
- Bilibili
- Kwai Brasil Tecnologia Ltda. (Kwai)
- Beijing Wei Ran Internet Technology
- Vimeo, Inc.
- Lemon8 (ByteDance)
Recent Developments
- July 2024 – Kuaishou Technology launched full beta testing of its Kling AI video-generation model globally, alongside upgraded model capabilities and a subscription program for users in mainland China.
- September 2024 – Snap introduced a redesigned Snapchat experience that unified Stories and Spotlight videos under a personalized recommendation system, improving content discovery for users, creators, and publishers.
- February 2025 – YouTube upgraded Dream Screen with Google DeepMind’s Veo 2, enabling Shorts creators to generate standalone AI video clips for incorporation into their Shorts.
- April 2025 – TikTok began testing Footnotes for short-form videos in the U.S., allowing users to add contextual information as part of TikTok’s efforts to improve content reliability.
- October 2025 – TikTok launched Smart Split and AI Outline, enabling creators to automatically convert longer videos into multiple short clips and use AI to develop video titles, hooks, hashtags, and content outlines.
- March 2026 – TikTok introduced new premium advertising formats in Australia, including Prime Time and Logo Takeover, expanding monetization opportunities for brands on its short-form video platform.
- July 2026 – Kuaishou secured approximately USD 2.8 billion in funding for its Kling AI video-generation business, with the unit reportedly valued at around USD 15 billion before the investment.
- July 2026 – Tencent Mobility raised approximately USD 1.5 billion through a sale of its Kuaishou shares, representing a significant transaction involving one of China’s leading short-video platforms.
Regulatory Landscape
The United States represents the highest-stakes regulatory environment for short video platforms. The 2024 divest-or-ban legislation created a statutory path toward restricted availability for a major short-video operator, forcing accelerated legal proceedings, infrastructure restructuring, and contingency planning across the platform’s advertiser and creator base. This single legislative action demonstrated that national-security classification of a digital platform can produce market disruption faster than any competitive threat.
The European Union’s Digital Services Act imposes the most structurally complex compliance obligations globally. Very large platforms must maintain non-profiled recommendation options, conduct algorithmic risk audits, and support independent researcher data access. These requirements increase operational overhead and constrain the recommendation personalization that drives watch-time, ad-fill rates, and creator discovery. Platforms that fail audits face fines of up to 6% of global annual revenue.
India’s continuing platform restrictions established a commercial precedent with direct revenue consequences. A major short-video platform lost access to one of the world’s largest and fastest-growing user bases through a single regulatory action. This precedent signals to investors that geographic concentration in any single emerging market carries binary regulatory risk that diversification strategies must explicitly account for.
Minor-targeting advertising restrictions are tightening across the European Union, United Kingdom, and North America simultaneously. Regulators in these jurisdictions are moving toward outright bans on behavioral advertising directed at users under 18 years of age. This directly reduces monetizable inventory within the 13–17 Years demographic segment, which represents a structurally high-engagement but increasingly restricted audience tier for platform advertisers.
Audience Monetization Gap Analysis
The Short Video Platforms Market carries a structural tension between engagement concentration and revenue yield. The 18–24 Years age group dominates with 36.1% of users but delivers lower advertising CPM rates and weaker commerce conversion than the 25–44 Years cohort. This means platforms generating the highest watch-time numbers are not necessarily generating the highest revenue-per-user outcomes. Engagement share and monetization share are not the same metric.
The 25–34 Years segment represents the most undermonetized audience tier relative to its engagement contribution. This cohort combines active content consumption with meaningful disposable income and established purchase behavior. Platforms that develop content formats, commerce features, and advertising products specifically targeting this demographic close the gap between engagement volume and revenue yield more efficiently than those optimizing purely for total user count.
The 45+ Years segment presents the widest monetization gap in absolute terms. This cohort carries the highest disposable income of any age group on the platform but receives the least tailored content, commerce, and advertising investment from platform operators. As per our research, digitally deliverable product trade grew 10% in 2025, confirming that older digitally active consumers are transacting online at scale. Platforms that develop dedicated content and commerce pathways for this segment capture premium advertising rates with minimal competitive pressure from youth-focused incumbents.
Monetization Maturity Matrix
The Short Video Platforms Market operates four concurrent monetization models at different stages of commercial maturity. Advertising-Supported leads with 77.1% market share but faces a structural ceiling as minor-targeting restrictions tighten across the European Union, United Kingdom, and North America. This ceiling creates immediate pressure on platforms to accelerate revenue diversification across subscription, tipping, and commerce models before advertising yield compression reduces total platform revenue growth.
Subscription-Based and In-App Tipping models occupy the mid-maturity tier. Both models generate reliable per-user revenue but scale more slowly than advertising because they require active payment commitment rather than passive exposure. Kuaishou’s live-streaming revenue of RMB 39.1 billion in 2025 demonstrates that tipping and virtual gifting can reach platform-level commercial significance when creator-audience relationships are deep enough to sustain real-money participation consistently across large user bases.
Brand-Sponsored Commerce with shoppable tags represents the least mature but highest-ceiling monetization model in this market. Kuaishou’s short-video e-commerce GMV grew more than 30% year over year in Q2 2025, outpacing every other monetization model’s growth rate within the same period. This growth differential signals that commerce monetization is transitioning from an experimental feature into a primary revenue architecture. Platforms that complete this transition earliest will capture the highest blended revenue-per-user ratios across the forecast period.
Creator Economy Dependency Index
Short video platforms derive their core inventory, engagement, and advertiser value entirely from creator-produced content rather than platform-produced content. This creates a structural dependency where creator retention directly determines advertising revenue, commerce GMV, and subscription growth simultaneously. Facebook paid creators nearly USD 3 billion in 2025, up 35% year over year, reflecting how aggressively platforms must invest in creator economics simply to maintain their existing content supply against competing platform offers.
Creator income concentration represents the deepest vulnerability within this dependency. A small percentage of top-tier creators generate a disproportionate share of total platform views, advertiser impressions, and commerce transactions. When high-value creators migrate, platforms lose not just content volume but the specific audience relationships and purchase behaviors those creators have built. Platforms that diversify creator investment toward mid-tier creators reduce this concentration risk while simultaneously expanding the long-tail content supply that sustains advertiser inventory breadth across niche categories.
Regulatory Risk Scoring by Region
North America carries the highest regulatory risk score of any region in this market. The 2024 U.S. divest-or-ban legislation created a binary outcome risk for a major platform operator, while ongoing Section 230 reform debates threaten the content liability protections that underpin current moderation cost structures. Europe ranks second, with Digital Services Act enforcement introducing fines of up to 6% of global annual revenue for non-compliant very large platforms. Together these two regions concentrate the majority of high-consequence regulatory exposure despite representing premium advertising yield markets that platforms cannot afford to exit.
Asia-Pacific presents a fragmented but escalating risk profile across its constituent markets. India’s continuing platform restrictions have already demonstrated the commercial consequence of sudden market inaccessibility for a major short-video operator. China’s data-localization and content-moderation requirements create a parallel compliance architecture that no single global platform infrastructure can satisfy simultaneously. Platforms expanding across Asia-Pacific must therefore treat each major national market as a distinct regulatory jurisdiction with independent legal, infrastructure, and content-governance requirements rather than a unified regional opportunity.
Report Scope
| Report Features | Description |
|---|---|
| Market Value (2025) | USD 2.2 Billion |
| Forecast Revenue (2035) | USD 7.2 Billion |
| CAGR (2026-2035) | 12.8% |
| Base Year for Estimation | 2025 |
| Historic Period | 2020-2024 |
| Forecast Period | 2026-2035 |
| Report Coverage | Revenue Forecast, Market Dynamics, Market Opportunity Analysis, Technology and Innovation Landscape, Competitive Landscape, Recent Developments |
| Segments Covered | By Content Type (Pre-Recorded Video Posts, Live Video, Short-Video Stories), By Monetization Model (Advertising-Supported, Subscription-Based, In-App Purchases and Tipping, Brand-Sponsored Commerce), By Deployment (Application-Based Platforms, Web-Based Platforms), By Platform Operating System (Android, iOS, Windows and Others), By User Demographics Age Group (18–24 Years, 13–17 Years, 25–34 Years, 35–44 Years, 45+ Years), By End-User Industry (Media and Entertainment, Education and EduTech, Retail and Live Commerce, Travel and Hospitality, Others) |
| Regional Analysis | North America (US and Canada), Europe (Germany, France, The UK, Spain, Italy, and Rest of Europe), Asia Pacific (China, Japan, South Korea, India, Australia, and Rest of APAC), Latin America (Brazil, Mexico, and Rest of Latin America), Middle East and Africa (GCC, South Africa, and Rest of MEA) |
| Competitive Landscape | ByteDance Ltd. (TikTok / Douyin), Meta Platforms, Inc. (Instagram Reels / Facebook Reels), Alphabet Inc. (YouTube Shorts), Kuaishou Technology, Snap Inc. (Snapchat Spotlight), Tencent Holdings Ltd. (Weishi / Channels), Bigo Technology Pte. Ltd. (Likee), Pinterest Inc., Reddit Inc., Netflix Inc. (Fast Laughs), Triller Inc., Chingari App Pvt. Ltd., Xiaohongshu (Zhiliao Technology), JOYY Inc. (Bigo Live), ShareChat (MX TakaTak), Bilibili, Kwai Brasil Tecnologia Ltda. (Kwai), Beijing Wei Ran Internet Technology, Vimeo, Inc., Lemon8 (ByteDance) |
| Customization Scope | Customization for segments, region/country-level will be provided. Additional customization can be done based on requirements. |
| Purchase Options | We have three licenses to opt for: Single User License, Multi-User License (Up to 5 Users), Corporate Use License (Unlimited User and Printable PDF) |





































