Report Overview
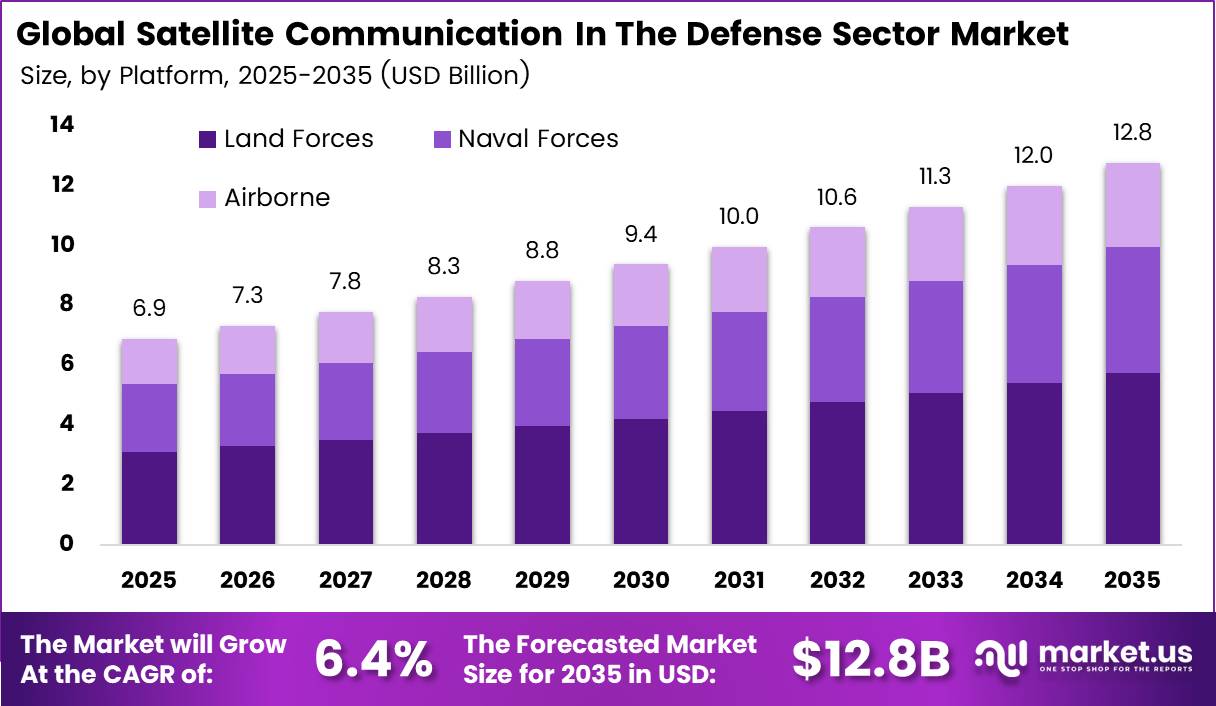
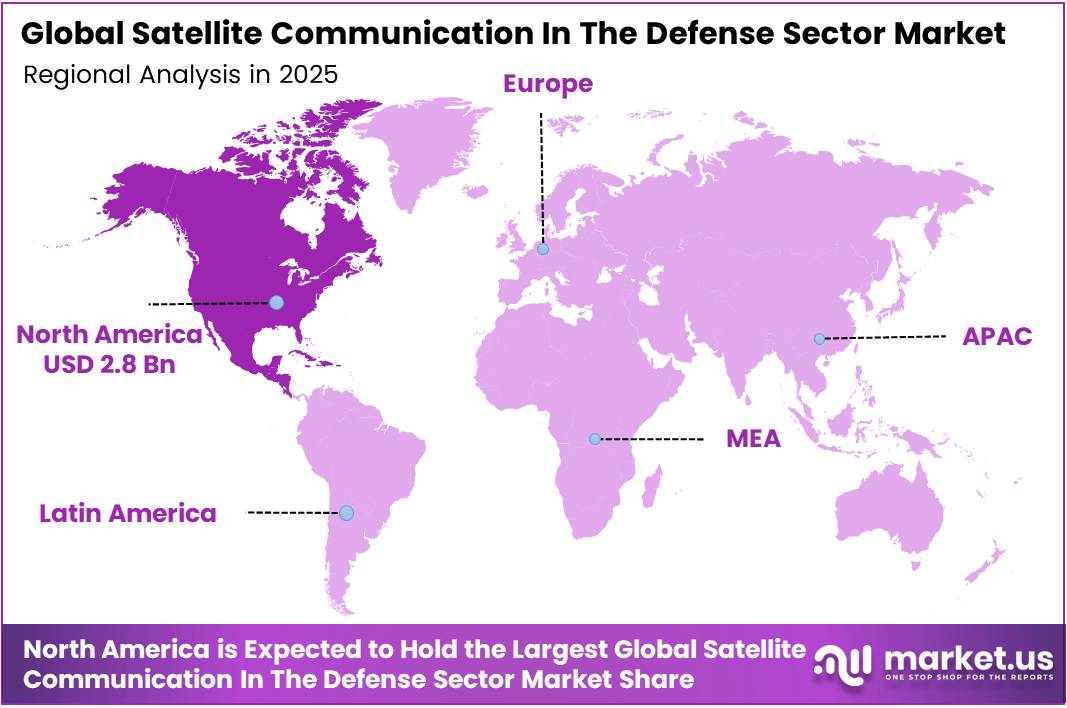
In 2025, the Global Satellite Communication In The Defense Sector Market was valued at USD 6.9 billion. The market is projected to grow at a CAGR of 6.4% during 2026–2035, reaching approximately USD 12.8 billion by 2035. North America dominated the global market in 2025, accounting for more than 40.2% of the total market share and generating approximately USD 2.8 billion in revenue.
Rising defense budgets drive this growth. According to SIPRI, world military spending rose by 2.9% in real terms to USD 2,887 billion in 2025. That marks the 11th straight year of growth. Global spending also climbed 41% over the decade from 2016 to 2025. Armed forces now spend 2.5% of world GDP on defense, up from 2.4% in 2024.
The United States anchors this lead. SIPRI data shows US military spending reached USD 954 billion in 2025, even after a 7.5% drop. The US remains the top spender among the 5 largest nations, which together hold 58% of global spending.
NATO members spent USD 1,581 billion, or 55% of the world total. The US Space Force also drives demand through large programs. These include a USD 2.3 billion award to SpaceX for the Space Data Network backbone prototype. Deep budgets and a strong space industrial base keep North America in front.
Key Takeaways
- The Satellite Communication In The Defense Sector Market stood at USD 6.9 billion in 2025 and will reach USD 12.8 billion by 2035. at a CAGR of 6.4% from 2026 to 2035.
- Ground Equipment leads the Type segment with a 63.2% share.
- Land Forces lead the Platform segment with a 41.2% share.
- Ku-band leads the Frequency segment with a 32.2% share.
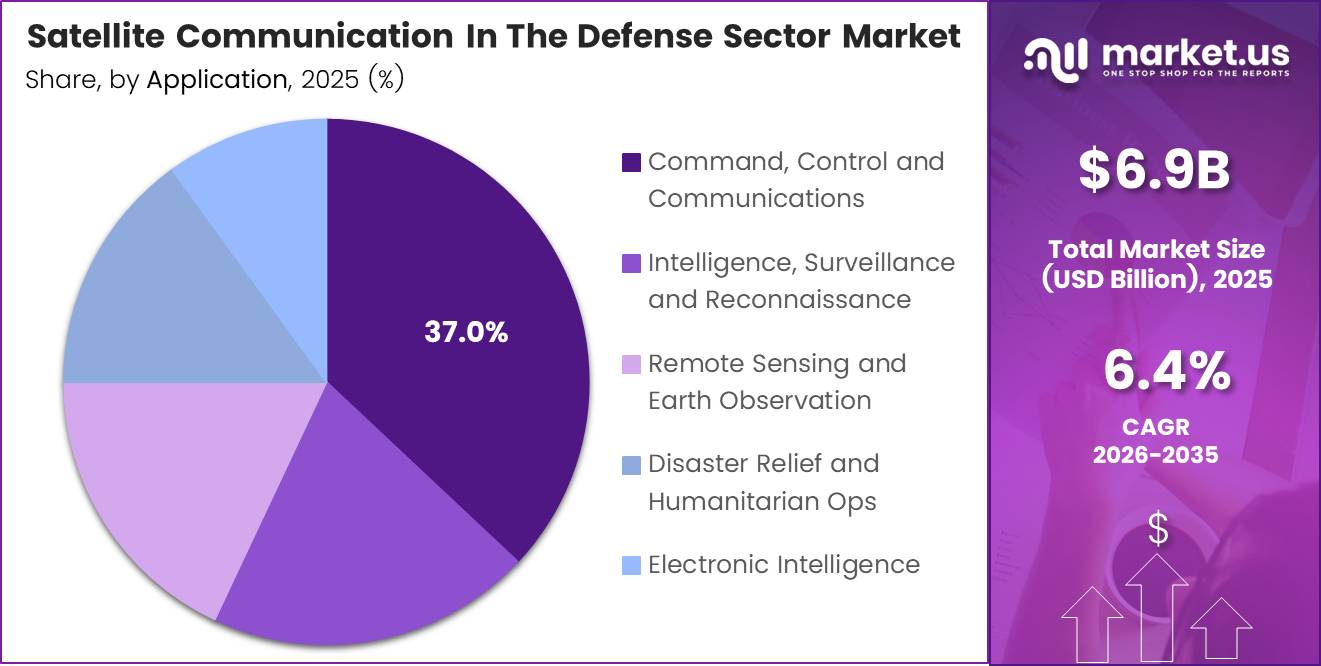
- Command, Control and Communications (C3) leads the Application segment with a 37.0% share.
- North America leads with a 40.2% share, worth USD 2.8 billion.
By Type
Ground Equipment dominates with 63.2% due to large-scale replacement of aging Army terminals.
Ground equipment leads because every satellite link needs hardware on the ground: antennas, modems, and terminals. In its FY2025 budget, the US Army set aside $43.897 million to buy 17 E-model terminals, plus spares, testing, fielding, and training.
The same budget gives $10.242 million for 14 new satellite terminal systems for 5 Army units. These systems replace terminals that are close to 20 years old. Old fleets like this keep hardware spending high, because forces must swap out whole units rather than just upgrade software.
Services are growing fastest because defense buyers now prefer to pay for managed bandwidth instead of owning every asset. Viasat earned $795.0 million from government satcom services in FY2026, up from $596.8 million in FY2024. That is a rise of about 33% in two years. Managed contracts move upgrade risk to the provider and cut upfront spending.
By Platform
Land Forces dominate with 41.2% due to portable multi-band terminals for soldiers.
Land forces hold the biggest share because armies run the most satellite users, spread across vehicles, bases, and foot patrols. The Army’s SCOUT-Small terminal supports 12 users over several networks, and 2 soldiers can set it up quickly.
The Army also offers dish sizes of 0.65 m and 0.95 m that pack into 3 hard-side cases and can be checked onto commercial flights. Light, tri-band kits like these let ground units order more terminals per brigade than any other service branch.
Airborne platforms are growing fastest because jets, drones and tankers now need beyond-line-of-sight data in real time. SDA’s Tranche 1 network plans 126 Transport Layer satellites that carry Link 16, the data link that fighter aircraft already use. Lockheed Martin alone is building 42 of these spacecraft. Once the network is live, aircraft can share target data far past the horizon.
By Frequency
Ku-band dominates with 32.2% due to wide commercial capacity and coverage.
Ku-band stays on top because defense users can rent large amounts of ready commercial capacity without waiting for military satellites to launch. Most Army transportable terminals, including the Deployable Ku/Ka/X-band Earth Terminals, work on Ku-band along with X-band and Ka-band.
Ka-band is growing fastest because new military constellations are built around it. SDA plans a Transport Layer of 300 to more than 500 satellites in orbits 750 km to 1,200 km high, all expected to run over Ka-band. When the full network is in place, 95% of locations on Earth will see at least two satellites at any time. Ka-band’s higher data rates and smaller beams suit video, sensor feeds, and jamming resistance.
By Application
Command, Control and Communications (C3) dominates with 37.0% due to the constant need for secure orders.
C3 leads because every mission starts with commanders sending orders and getting reports, whether in peacetime or in combat. That steady demand shows up in supplier revenue. The US Government made up about 16% of Viasat’s total revenue in FY2026.
Viasat’s defense and advanced technologies segment brought in $1,340.6 million that year, mostly from products such as tactical radios and secure links. Because forces never stop using C3, it gets a guaranteed share of each budget cycle.
ISR is growing fastest because modern warfare depends on finding and tracking targets within seconds. SDA’s Tranche 1 includes 28 Tracking Layer satellites within a 154-satellite operational constellation. The constellation spreads across 10 orbital planes for missile warning and targeting. Sensor satellites like these produce huge data streams that need fast relay links back to analysts and shooters.
Key Market Segments
By Type
- Ground Equipment
- Antennas
- Modems and Transceivers
- Terminals (Manpack, Fly-Away, Vehicular)
- Services
- Managed SATCOM Services
- Leasing, Integration and Maintenance
By Platform
- Land Forces
- Naval Forces
- Airborne
By Frequency
- L-band
- S-band
- C-band
- X-band
- Ku-band
- Ka-band
- Q/V and Optical
By Application
- Command, Control and Communications (C3)
- Intelligence, Surveillance and Reconnaissance (ISR)
- Remote Sensing and Earth Observation
- Disaster Relief and Humanitarian Ops
- Electronic Intelligence (ELINT and SIGINT)
Geopolitical Impact Analysis
Trade friction between the US and China directly hits SATCOM hardware costs. In 2025, the US raised tariffs on many Chinese electronic imports by up to 145% before cutting them back to about 30% under a temporary deal. The WTO warned that these moves could shrink US and China goods trade by up to 80%. Modems, RF boards and power amplifiers often use Asian parts, so terminal makers face higher costs and must redesign their supply chains.
Export controls on critical minerals add a second shock. China supplies about 98% of the world’s primary gallium, according to the IEA. China banned gallium and germanium exports to the US in December 2024. Gallium nitride chips power modern X-band and Ka-band amplifiers. Gallium prices outside China rose by more than 150% after the curbs, which pushes up antenna and transceiver prices.
Shipping risk in the Red Sea slows deliveries. UNCTAD reported that Suez Canal transits fell by more than 50% after attacks on ships. Rerouting around the Cape of Good Hope adds about 10 to 14 days to Asia-to-Europe voyages. Container freight rates more than doubled at their peak, which raised costs for shipping fly-away terminals and spare parts.
The war in Ukraine shows how useful SATCOM is in combat. Ukraine raised military spending by 20% to USD 84.1 billion, or 40% of GDP. Allies are now buying jam-resistant, multi-orbit terminals in larger numbers, and they favor suppliers from allied nations.
Regional Analysis
North America dominates the Satellite Communication In The Defense Sector Market, holding a 40.2% share and generating USD 2.8 billion in revenue. The US Department of Defense leads demand. It buys protected and commercial SATCOM for every service branch. The Space Force builds new layers such as the Space Data Network, and the Pentagon’s Golden Dome missile defense plan needs fast data links across many constellations.
In November 2026, Space Systems Command gave Viasat a contract with a USD 450 million ceiling and a USD 115 million first task order to run the network’s mission operations center. NASA also awarded USD 1.07 billion in total Ka-band relay contracts to US firms in the same month. The region hosts the main prime contractors, including Lockheed Martin, Northrop Grumman and L3Harris.
Asia Pacific is the fastest-growing region in the market. SIPRI data shows spending in Asia and Oceania rose by 8.1% to USD 681 billion in 2025. China raised its budget by 7.4% to an estimated USD 336 billion. India, Japan, South Korea and Australia now buy more sovereign SATCOM satellites and naval terminals.
Europe shows strong momentum. Military spending in Europe rose by 14% to USD 864 billion in 2025. European NATO members spent USD 559 billion, and 23 of the 32 NATO members met the 2.0% of GDP target. Germany, France, and the UK fund national SATCOM programs, while the EU funds IRIS² for secure links. Thales and Airbus lead regional supply.
Key Regions and Countries
North America
- US
- Canada
Europe
- Germany
- France
- The UK
- Spain
- Italy
- Rest of Europe
Asia Pacific
- China
- Japan
- South Korea
- India
- Australia
- Rest of APAC
Latin America
- Brazil
- Mexico
- Rest of Latin America
Middle East and Africa
- GCC
- South Africa
- Rest of MEA
Market Dynamics
Drivers
| Driver | (~) % Impact on CAGR Forecast | Geographic Relevance | Impact Timeline |
|---|---|---|---|
| Proliferated LEO Military Constellations | +1.8% | North America, Europe | Short term (2 years or less) |
| Rising Global Defense Budgets | +1.4% | Global | Short term (2 years or less) |
| Network-Centric & JADC2 Programs | +1.1% | North America, NATO Europe | Medium term (2 to 4 years) |
| Satcom-on-the-Move Terminal Adoption | +0.8% | Global | Short term (2 years or less) |
| Lessons From Ukraine Conflict | +0.7% | Europe, Asia-Pacific | Short term (2 years or less) |
| Sovereign Satcom Programs | +0.6% | Europe, Asia-Pacific, Middle East | Medium term (2 to 4 years) |
Proliferated LEO Military Constellations
Defense satcom procurement has moved away from a small number of exquisite GEO platforms built over 10 to 15 years. Militaries now buy proliferated low-earth-orbit layers and managed bandwidth services. According to the U.S. Space Development Agency’s tranche awards, Tranche 1 and Tranche 2 Transport Layer contracts cover more than 250 satellites on roughly 2-year refresh cycles, with launches starting in 2025.
Per U.S. Department of Defense budget justification documents, Space Force procurement and RDT&E requests have held near $29 billion annually. Per company annual reports and earnings calls of LEO operators, commercial constellations of more than 6,000 satellites now deliver latency below 50 ms, against more than 600 ms on GEO links.
That makes service-based “bandwidth-as-a-service” contracts the default model. Primes and terminal makers are responding by moving from one-time hardware sales to recurring service and subscription revenue, with gross margins on managed services potentially 8 to 12 percentage points above legacy fixed-price hardware programs.
Restraints
| Restraint | (~) % Impact on CAGR Forecast | Geographic Relevance | Impact Timeline |
|---|---|---|---|
| ITAR & Export Control Barriers | -1.2% | North America, Global Export Markets | Medium term (2 to 4 years) |
| High Program Acquisition Costs | -0.9% | Global | Medium term (2 to 4 years) |
| Budget Continuing Resolutions | -0.7% | North America | Short term (2 years or less) |
| Fiscal Constraints in Emerging Economies | -0.5% | Latin America, Africa, South Asia | Short term (2 years or less) |
| Spectrum Allocation Conflicts | -0.4% | Global | Long term (4 years or more) |
ITAR & Export Control Barriers
The root cause is the International Traffic in Arms Regulations, administered by the U.S. Department of State Directorate of Defense Trade Controls, together with Wassenaar Arrangement dual-use controls. Encrypted terminals, anti-jam modems, and military-grade payloads all fall under these rules.
Licensing reviews regularly run 60 to 120 days, and congressional notification is required above set thresholds such as $14 million for major defense equipment, per Arms Export Control Act provisions. As a result, roughly 15% to 20% of allied export bids miss procurement windows, a pattern European buyers increasingly cite to justify “ITAR-free” sourcing, per European Defence Agency capability statements.
The commercial cost is lost export revenue and duplicated compliance spending. Defense contractors report compliance overhead equal to 2% to 4% of program value in SEC 10-K filings, which compresses margins and delays CapEx on export-oriented production lines.
Challenges
| Challenge | (~) % CAGR Friction Drag | Geographic Relevance | Mitigation Horizon |
|---|---|---|---|
| Jamming & Cyber Threats | -0.9% | Global | Long term (4 years or more) |
| Radiation-Hardened Component Shortages | -0.6% | North America, Europe | Medium term (2 to 4 years) |
| Legacy Terminal Interoperability Gaps | -0.5% | NATO, Asia-Pacific | Medium term (2 to 4 years) |
| Orbital Congestion & Debris | -0.4% | Global | Long term (4 years or more) |
| Cleared Engineering Talent Deficit | -0.4% | North America, Europe | Medium term (2 to 4 years) |
Jamming & Cyber Threats
Satellite links are structurally exposed to electronic warfare because ground terminals and uplinks transmit predictable signals. The 2022 KA-SAT cyberattack disabled tens of thousands of modems across Europe, per EU Agency for Cybersecurity (ENISA) incident reporting.
GPS and satcom jamming in the Baltic region affected more than 1,000 flights per month during 2024, per EUROCONTROL interference monitoring. Answering this threat requires protected waveforms, anti-jam antennas, and zero-trust ground segments, which add an estimated 15% to 25% to terminal unit costs, per U.S. Space Force Protected Tactical SATCOM program documentation.
Opportunities
| Opportunity | (~) % Potential CAGR Upside | Geographic Relevance | Execution Window |
|---|---|---|---|
| Multi-Orbit Hybrid Network Services | +1.5% | North America, Europe, Asia-Pacific | Medium term (2 to 4 years) |
| Direct-to-Device Tactical Connectivity | +1.0% | Global | Long term (4 years or more) |
| Optical Inter-Satellite Laser Links | +0.8% | North America, Europe | Medium term (2 to 4 years) |
| AI-Driven Spectrum & Network Management | +0.6% | Global | Medium term (2 to 4 years) |
| Ground Segment M&A Consolidation | +0.5% | North America, Europe | Short term (2 years or less) |
Multi-Orbit Hybrid Network Services
Most defense users still contract GEO, MEO and LEO capacity separately, through separate terminals and separate contracts. A seamless, automatically switching multi-orbit managed service therefore remains largely untapped white space rather than an active driver.
U.S. Space Force Commercial Satellite Communications Office pilots under the PLEO contract vehicle, which carries a ceiling raised to $13 billion, show demand for unified services, but full multi-orbit orchestration is still in the pilot stage.
Per NATO Communications and Information Agency planning, allied forces want resilient path diversity across at least 3 orbital regimes. Providers able to bundle capacity through a single software-defined terminal could cut per-megabit costs by 30% to 40%, according to unit-cost disclosures in satellite operator investor presentations. Converting from transactional capacity leasing to multi-year managed service agreements could also lift EBITDA margins by 5 to 10 percentage points.
Key Players Analysis
Tier 1 leaders combine large revenues with deep space portfolios. Lockheed Martin reported net sales of USD 71.0 billion in 2024, and its Space segment brought in about USD 12.5 billion. Northrop Grumman posted sales of USD 41.0 billion, and its Space Systems unit delivered about USD 15 billion. L3Harris earned USD 21.3 billion in 2024 and continues to win tactical terminal orders.
European leaders hold strong sovereign positions. Thales reported sales of EUR 20.6 billion in 2024 and spent about EUR 4.4 billion on total R&D. Airbus Defence and Space generated about EUR 12.1 billion in revenue. It builds Skynet and other military communication satellites.
Tier 2 challengers grow through services and acquisitions. SES completed its Intelsat purchase for USD 2.6 billion in cash. The deal created a fleet of 120 satellites and pro forma revenue of EUR 3.7 billion. Viasat reported FY2025 revenue of about USD 4.5 billion and has a growing defense unit. Iridium earned about USD 830.7 million in 2024, backed by a USD 738.5 million US government airtime deal.
Niche players focus on terminals and modems. ST Engineering iDirect, Cobham, and Hughes supply ground hardware for land and naval platforms. Inmarsat, now part of Viasat, adds L-band and Global Xpress Ka-band capacity for mobile forces.
Top Key Players in the Market
- Thales Group
- Airbus Defence and Space
- Lockheed Martin Corp.
- Northrop Grumman Corp.
- L3Harris Technologies Inc.
- Inmarsat Communications
- ViaSat Inc.
- Iridium Communications Inc.
- SES Government Solutions
- Cobham PLC
- ST Engineering iDirect
- Hughes Network Systems (EchoStar)
Recent Developments
- In July 2025, SES completed its acquisition of Intelsat for USD 2.6 billion in cash, creating a fleet of about 90 GEO and nearly 30 MEO satellites that serve military Ka-band, X-band, and UHF users.
- In 2026, the US Department of Defense awarded SpaceX a USD 2.3 billion contract to deliver a fully working prototype of the Space Data Network backbone by the end of 2027.
- In November 2026, L3Harris Technologies received a USD 36 million US Army order for Hawkeye 4 Lite SATCOM terminals that support the C2NOW program.
- In November 2026, NASA awarded Viasat USD 460.9 million and SES Space and Defense USD 340.4 million for Ka-band space relay capability contracts.
- In November 2026, the US Space Force awarded Viasat a contract with a USD 450 million ceiling and a USD 115 million first task order to build the Space Data Network mission operations center.
Report Scope
| Report Features | Description |
|---|---|
| Market Value (2025) | USD 6.9 Billion |
| Forecast Revenue (2035) | USD 12.8 Billion |
| CAGR (2026-2035) | 6.4% |
| Base Year for Estimation | 2025 |
| Historic Period | 2020-2024 |
| Forecast Period | 2026-2035 |
| Report Coverage | Revenue Forecast, Market Dynamics, Competitive Landscape, Recent Developments |
| Segments Covered | By Type (Ground Equipment, Antennas, Modems and Transceivers, Terminals (Manpack, Fly-Away, Vehicular), Services, Managed SATCOM Services, Leasing, Integration and Maintenance); By Platform (Land Forces, Naval Forces, Airborne); By Frequency (L-band, S-band, C-band, X-band, Ku-band, Ka-band, Q/V and Optical); By Application (Command, Control and Communications (C3), Intelligence, Surveillance and Reconnaissance (ISR), Remote Sensing and Earth Observation, Disaster Relief and Humanitarian Ops, Electronic Intelligence (ELINT and SIGINT)) |
| Regional Analysis | North America – US, Canada; Europe – Germany, France, The UK, Spain, Italy, Rest of Europe; Asia Pacific – China, Japan, South Korea, India, Australia, Singapore, Rest of APAC; Latin America – Brazil, Mexico, Rest of Latin America; Middle East & Africa – GCC, South Africa, Rest of MEA |
| Competitive Landscape | Thales Group, Airbus Defence and Space, Lockheed Martin Corp., Northrop Grumman Corp., L3Harris Technologies Inc., Inmarsat Communications, ViaSat Inc., Iridium Communications Inc., SES Government Solutions, Cobham PLC, ST Engineering iDirect, Hughes Network Systems (EchoStar) |
| Customization Scope | Customization for segments and region/country-level will be provided. Additional customization can be done based on requirements. |
| Purchase Options | We have three licenses to opt for: Single User License, Multi-User License (Up to 5 Users), Corporate Use License (Unlimited Users and Printable PDF) |