


Report Overview
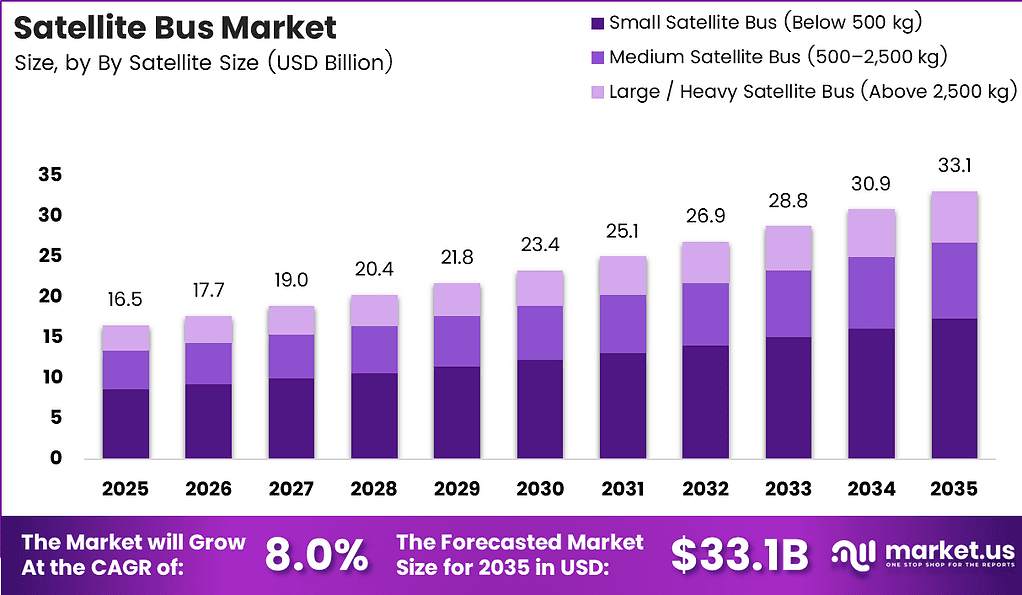
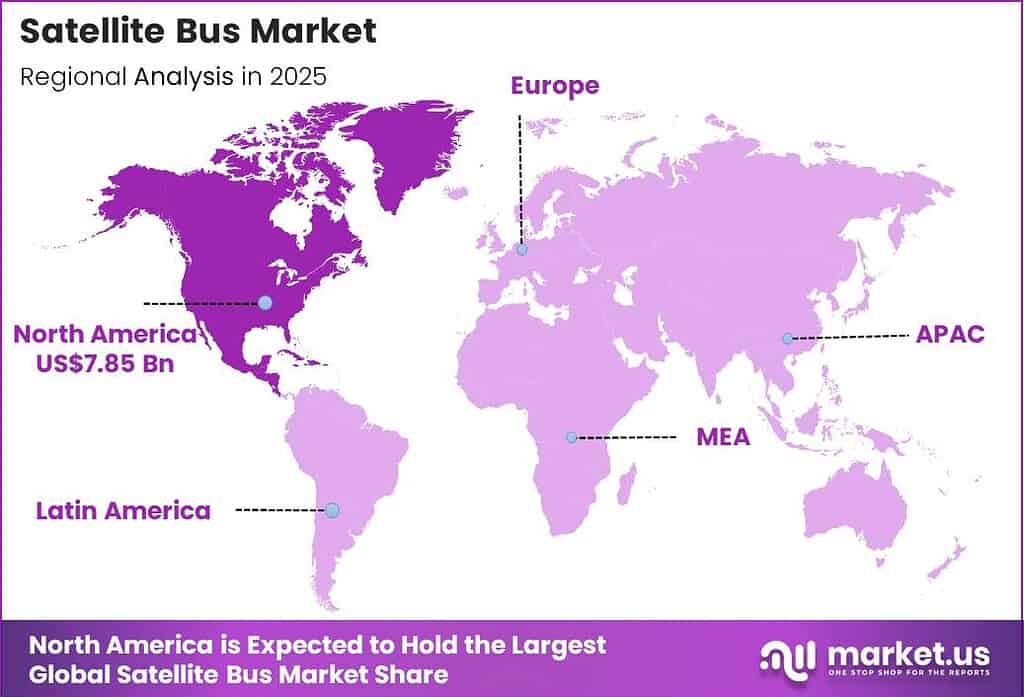
In 2025, the Global Satellite Bus Market was valued at US$16.5 billion, and between 2026 and 2035, it is projected to grow at a CAGR of 8.0%, reaching approximately US$33.1 billion by 2035. North America held a dominant market position, capturing more than a 47.50% share, holding USD 7.85 billion in revenue.
A satellite bus, also known as a spacecraft bus or satellite platform, is the core structure of a satellite that supports essential systems such as power, propulsion, thermal control, and telemetry. It acts as the main platform on which mission-specific payloads are integrated and operated across different orbital environments. The satellite bus market across the globe is expanding rapidly due to rising demands for communication, defense, navigation, and Earth observation satellites. The satellite bus can be described as the basic body of the satellite that holds important components like power, propulsion, temperature control, and telemetry system.
Key Takeaways
- The global satellite bus market was valued at US$16.5 billion in 2025.
- The global satellite bus market is projected to grow at a CAGR of 8.0%, reaching approximately US$33.1 billion by 2035.
- On the basis of satellite size/class, small satellite buses (below 500 kg) dominated the market, constituting 52.4% of the total market share.
- Based on orbit type, Low Earth Orbit (LEO) satellites held the largest share, accounting for 54.5% of the market.
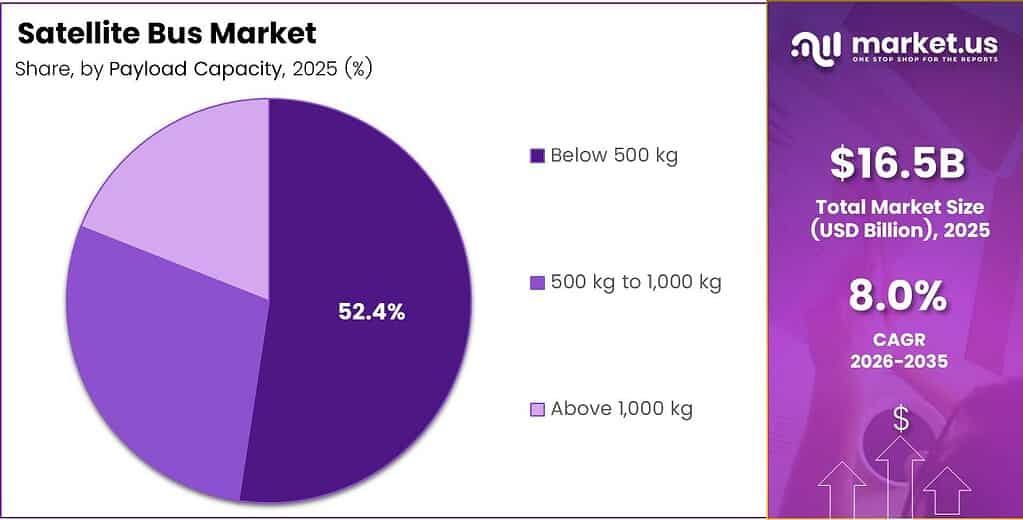
- Based on payload capacity, satellites below 500 kg led the market, comprising 52.4% of the total market.
- Among applications, communication satellites held a major share, 44.9% of the market.
- Among end users, commercial operators accounted for the largest share, with 42.5% of the market.
- In terms of propulsion technology, chemical propulsion was the most widely used, accounting for 48.5% of the market.
- In 2025, North America was the most dominant, representing 47.5% of the global market.
The growth in the market will be driven by record launch counts of satellites. According to the space tracking barometer published by Look Up in partnership with Le Point, global space object launches skyrocketed to 4,510 in 2025, breaking the previous record of 2,903 set in 2023. By October 2025, the total number of active satellites in orbit reached a record-breaking 13,026 marking a 23% year-on-year increase with SpaceX’s Starlink operating 8,366 of them, which accounts for 64% of the global total. The connectivity demands remain strong as there are 2.2 billion people who are offline according to the ITU 2025 report.
For instance, Amazon Leo spent over $10 billion on 92 launch missions deploying 302 satellites by April 2026. Investments in defense are also helping in promoting growth in the markets. In 2024, global government spending on space stood at $135 billion, out of which $73 billion was spent for defense purposes. Modular buses, artificial intelligence in the bus’s operating system, and electric propulsion technologies have increased flexibility, efficiency, and the life span of satellites. Due to PPP and mega-constellations, satellite buses will experience high demand in the future.
Satellite Size Analysis
Small satellite bus (below 500 kg) represents dominant segment in the market
The dominant segment is the Small Satellite Bus, below 500 kg, holding 52.40% of market share. Manufacturing repeatability, standardised interfaces, and rideshare launch compatibility make it the only financially viable architecture for constellation-scale deployment. Procurement doctrine has embedded this platform as the default across broadband, IoT relay, and Earth observation missions simultaneously — for instance, the US Space Development Agency’s Tranche 2 Transport Layer programme, delivering over 100 mesh-networked satellites through 2026, was designed exclusively around small bus platforms because disaggregated resilience cannot be achieved through any other architecture at operationally meaningful scale. As sovereign and commercial operators converge on this standard, per-unit manufacturing costs compress further, reinforcing the segment’s dominance with each successive constellation generation.
The fastest growing sub-class is the sub-100 kg nanosatellite and microsatellite category, where CubeSat-derived platforms are being procured in multi-unit batches by commercial IoT operators and sovereign defence agencies alike. ISRO’s PSLV-C60 mission in December 2025, deploying 58 small satellites in a single rideshare configuration, validated batch deployment under national launch infrastructure and established a sovereign launch-economics benchmark across Asia Pacific that is directly accelerating nanosatellite procurement among regional operators previously dependent on Western rideshare providers.
Orbit Type Analysis
Low Earth Orbit (LEO) a significant orbit type
Low Earth Orbit (LEO) is currently the most widely used satellite environment (54.50%), driven by its latency advantage of 20 to 40 milliseconds round-trip versus GEO’s 600-millisecond baseline — making it the only viable regime for broadband, real-time surveillance, and tactical military communications at scale. This advantage has been formalised at the sovereign policy level; for instance, the EU’s IRIS² constellation, with procurement contracts awarded to a European industrial consortium in 2025, was explicitly architected as LEO-dominant, reflecting institutional consensus that GEO can no longer serve as the default backbone for critical government communications. As deployment concentrates in LEO, ground infrastructure investment aligns to LEO-compatible configurations, deepening incumbent positional advantages with each new constellation wave.
The fastest growing orbital sub-segment is Sun-Synchronous Orbit, at 2.00%, experiencing the highest proportional expansion of any orbital class. SSO provides consistent solar illumination geometry essential for repeatable optical imaging demanded by Earth observation intelligence and climate monitoring programmes. ESA’s Copernicus Sentinel-6B, launched in November 2025 under the EU’s expanded ocean monitoring mandate, reinforced SSO’s strategic status. As defence intelligence contracts and climate finance verification mechanisms both mandate geometrically consistent imaging coverage, SSO’s growth is anchored in durable institutional demand rather than speculative commercial expansion.
Payload Capacity Analysis
Below 500 kg Payload Satellites Dominate the Market
The dominant payload class is sub-500 kg, holding 52.40% of market share — directly mirroring the small satellite bus distribution and reflecting the intrinsic relationship between platform mass and rideshare launch economics. Operators designing for batch deployment optimise payload mass to fit shared launch vehicle fairing configurations, and the sub-500 kg bracket represents the practical upper boundary for cost-efficient constellation-scale rideshare. For instance, Amazon’s Project Kuiper batch deployment in April 2025, placing 27 satellites aboard a single Vulcan Centaur rocket, was engineered around payload mass budgets specifically calibrated to maximise operational nodes per launch without exceeding fairing capacity constraints that govern rideshare economics — a discipline now standard across all major LEO constellation programmes.
The fastest growing bracket is 500–1,000 kg, at 28.60%, driven by missions requiring more capable power systems and larger antenna apertures than nanosatellite platforms can accommodate without justifying full GEO-class infrastructure overhead. High-throughput LEO communications satellites and medium-resolution SAR platforms are the primary growth drivers. Japan’s JAXA contracted with Mitsubishi Electric in 2025 for 700 kg-class radar observation satellites under the ASNARO-3 programme, targeting sub-one-metre SAR resolution for disaster response and maritime domain awareness — a mission profile that validates the medium payload class’s expanding utility across both sovereign and commercial procurement channels.
Application Analysis
Communication Satellites Lead in Volume While Earth Observation Emerges as Fastest-Growing Application
The dominant segment is Communication Satellites at 44.90%, sustained by the volume deployment of LEO broadband constellation satellites that collectively represent a deployment wave without historical precedent. The segment’s dominance is reinforced by structural integration of satellite communications into terrestrial mobile network architecture — for instance, the 2025 FCC spectrum-sharing agreement enabling T-Mobile’s Starlink-integrated rural coverage programme demonstrated at commercial scale that satellite communication nodes function as seamless extensions of terrestrial subscriber networks, transforming communication satellites from standalone capacity assets into distributed infrastructure components of the global mobile ecosystem. This integration logic is now being replicated across multiple operator pairs globally, embedding communication satellite demand directly into mobile network investment cycles.
The fastest growing segment is Earth Observation and Remote Sensing, propelled by intelligence-as-a-service procurement models now institutionalised across defence, insurance, and climate finance sectors. The transition from raw imagery sales to analytically processed geospatial intelligence products has restructured EO revenue models from episodic transactions toward recurring subscription contracts. The USGS Landsat Next programme, approved for accelerated procurement in the FY2026 appropriations cycle, is drawing in commercial data purchase commitments alongside sovereign investment, providing revenue visibility for commercial EO operators entering long-duration observation contracts and validating the segment’s expansion well beyond defence into mainstream institutional procurement.
End Use Analysis
Commercial Operators Dominate the Satellite Bus Market
The dominant category is Commercial Operators at 42.50%, driven by the simultaneous expansion of broadband, IoT, and Earth observation constellations at a deployment cadence that sovereign and academic programmes structurally cannot match. Commercial operators’ dominance is not simply a function of spending volume but of launch tempo and constellation scale — for instance, the batch launch economics validated by Project Kuiper’s April 2025 deployment established a commercial deployment rhythm of multiple launches per quarter across multiple operators that is reshaping the orbital environment and driving ground network, spectrum coordination, and insurance investment calibrated primarily to commercial operator requirements. This means that regulatory and operational frameworks being constructed now reflect commercial priorities that will define the industry’s architecture for the next decade.
The fastest growing end-user segment is Military and Defence, where the sustained conflict environment of 2026 is generating procurement acceleration across satellite communications, ISR, and space situational awareness domains simultaneously. The NATO Defence Investment Pledge’s 2025 revision, elevating space capabilities to a Tier 1 allied investment priority alongside conventional air and naval assets, has translated directly into increased national defence SATCOM and reconnaissance satellite procurement across member states — creating a sustained, multi-year demand signal that satellite manufacturers are now building dedicated production capacity to serve.
Propulsion Technology Analysis
Chemical Propulsion Technology holds the major preference in Propulsion Technology Segment
The dominant category is Chemical Propulsion at 48.50%, explained by its proven reliability, engineering predictability, and compatibility with rapid orbital insertion timelines that constellation operators require at batch deployment scale. For operators launching dozens of satellites on compressed schedules, the design certainty of chemical systems reduces programme risk in ways that more efficient alternatives cannot yet replicate at equivalent volumes — for instance, the Space Development Agency’s Tranche 2 satellite designs specified chemical propulsion for primary manoeuvring precisely because schedule risk in a defence procurement context carries direct operational consequences, being gaps in tactical data relay coverage that efficiency gains from alternative propulsion systems cannot offset. This prioritisation logic is replicated across virtually every time-constrained constellation programme regardless of operator type.
The fastest growing category is Electric and Ion Propulsion, driven by a durable regulatory rationale. As debris mitigation enforcement tightens globally, electric propulsion’s high specific impulse makes it substantially more mass-efficient for end-of-life deorbit manoeuvres than chemical alternatives. ESA’s Zero Debris Charter, operationalised with binding requirements for all ESA-funded missions in 2025, mandates disposal capability within five years of end-of-life — effectively requiring propulsion system selection to account for disposal performance alongside operational performance. This regulatory driver is pulling electric propulsion adoption forward across a wide range of mission types, creating sustained demand for ion thruster manufacturing and propellant supply chains previously sized for a far smaller addressable market.
Key Market Segments
By Satellite Size/Class
- Small Satellite Bus (Below 500 kg)
- Medium Satellite Bus (500–2,500 kg)
- Large / Heavy Satellite Bus (Above 2,500 kg)
By Orbit Type
- Low Earth Orbit (LEO)
- Medium Earth Orbit (MEO)
- Geostationary Orbit (GEO)
- Geosynchronous Orbit (GSO)
- Highly Elliptical Orbit (HEO)
- Sun-Synchronous Orbit (SSO)
By Payload Capacity
- Below 500 kg
- 500 kg to 1,000 kg
- Above 1,000 kg
By Application
- Communication Satellites
- Earth Observation & Remote Sensing
- Navigation & Positioning
- Scientific Research & Space Exploration
- Surveillance & Reconnaissance
- Technology Demonstration
By Propulsion Technology
- Chemical Propulsion
- Electric / Ion Propulsion
- Hybrid Propulsion
By End Use
- Commercial Operators
- Military & Defense
- Government & Space Agencies
- Academic & Research Institution
Drivers
Batch-Deployment Economics Restructuring Satellite Procurement Models
The economics of satellite deployment have been permanently altered by the industrialisation of small satellite manufacturing and the normalisation of batch launches. Where procurement once centred on a single GEO platform representing a decade-long capital commitment, the new model favours constellations of standardised bus platforms procured at volume and launched on shared or dedicated rideshare missions. Amazon’s Project Kuiper executed its first operational batch deployment of 27 satellites aboard a United Launch Alliance Vulcan Centaur rocket in April 2025, beginning a programme calling for over 3,200 satellites across multiple phases.
The commercial consequence is a complete restructuring of the satellite value chain: manufacturers capable of serial production at scale acquire pricing power, launch providers offering predictable and frequent deployment windows attract long-term contracts, and traditional single-satellite primes face margin compression unless they adapt production architectures accordingly. Procurement officers at institutional operators can no longer evaluate satellite acquisition on a per-unit basis — the relevant metric is now cost-per-active-node in a constellation under continuous replenishment, a fundamental shift that rewards vertical integration and manufacturing scale above all other competitive attributes and that is now embedded in how sovereign and commercial clients alike structure long-term satellite acquisition strategies.
Restraints
Spectrum Coordination Gridlock Capping LEO Constellation Scalability
The ITU’s spectrum coordination framework was architected for single-satellite GEO deployments and becomes operationally dysfunctional when applied to constellations of hundreds or thousands of satellites, creating multi-year delays between filing and authorisation that have no administrative remedy under current procedures. The 2025 World Radiocommunication Conference attempted resolution through provisional amendments to the Radio Regulations, but consensus-based decision-making left spectrum disputes between US-licensed and Chinese-licensed LEO broadband networks formally unresolved.
Operators are consequently entering operational phases without completed coordination, exposing them to interference claims, insurance restrictions, and regulatory action that cannot be quantified at the point of capital commitment. The FCC’s November 2025 order tightening five-year deployment milestone requirements compounded this problem — operators facing spectrum uncertainty now simultaneously face accelerated deployment obligations, creating a situation where regulatory pressure to launch faster conflicts directly with regulatory uncertainty about whether those launches will achieve protected operational status. Institutional investors must treat spectrum coordination status as a primary risk variable, not a compliance footnote, because unresolved coordination disputes can render a fully deployed constellation commercially non-viable if interference thresholds trigger regulatory intervention from competing national filing authorities with overlapping orbital and frequency claims across the same LEO shells.
Opportunity
AI-Enabled Geospatial Intelligence Replacing One-Off Imagery Sales
The transition from selling raw satellite imagery to delivering continuously updated, analytically processed geospatial intelligence has already occurred at the contract level, fundamentally restructuring revenue models for Earth observation operators. The US National Geospatial-Intelligence Agency’s ENVISAGE programme, announced in early 2025, established a multi-vendor commercial intelligence framework under which private satellite operators provide derived intelligence products — change detection alerts, movement pattern analysis, predictive infrastructure assessments — rather than pixel deliveries. This procurement shift means operators must now invest in on-board processing capabilities, ground-based AI inference pipelines, and data fusion architectures combining optical, SAR, and hyperspectral inputs into unified intelligence outputs.
The European Investment Bank’s 2025 Climate Resilience Facility reinforced this model in the civilian domain, mandating satellite observation data as the primary verification mechanism for parametric insurance payout triggers — creating durable subscription-structured revenue streams for operators delivering persistent geographic monitoring. Pixxel secured a multi-year data supply agreement under this framework in mid-2025, providing continuous hyperspectral analysis across six sovereign client territories. The commercial model of recurring revenue tied to verified geophysical events rather than ad hoc imagery purchases attracts institutional investors who value predictable cash flows, fundamentally repositioning Earth observation operators within capital markets away from hardware-defined valuations toward software-comparable revenue multiples.
Trends
Direct-to-Device Connectivity Collapsing the Boundary Between Satellite and Terrestrial Networks
Direct-to-device satellite connectivity — reaching a standard 4G or 5G handset directly from orbit without specialised terminal hardware — is transitioning from a technical demonstration to a baseline competitive expectation among mobile network operators globally. The 3GPP Release 17 and 18 standards, embedded in device chipsets shipping from 2025 onward, define the non-terrestrial network interface enabling seamless handoff between terrestrial and satellite coverage layers. T-Mobile’s Starlink-integrated rural coverage programme, extended under a 2025 FCC spectrum-sharing agreement, demonstrated commercially that hybrid terrestrial-orbital coverage reaches existing subscriber handsets without hardware upgrades — a proof-of-concept that has catalysed parallel operator agreements across Europe, Southeast Asia, and Latin America.
The commercial consequence is structural rather than incremental: satellite connectivity is no longer an alternative channel serving specialised users but a coverage layer that every mobile network operator must integrate or risk surrendering rural, maritime, and aeronautical subscribers to satellite-native competitors who face no legacy infrastructure constraints. For satellite manufacturers, this convergence creates a new specification regime — satellites must be designed to handshake with terrestrial RAN architectures, meet 3GPP interface standards, and deliver coverage continuity metrics that mobile subscribers measure against terrestrial network benchmarks rather than traditional satellite service level agreements.
Geopolitical Impact Analysis
Iran-Iraq Corridor Conflict Pressure Accelerating Satellite Surveillance and Communications Demand
The escalating military tension across the Iran-Iraq corridor throughout 2025 and into 2026 — marked by cross-border drone strikes, Iranian ballistic missile repositioning, and Iraqi militia activity targeting US and allied forward operating bases — has generated acute demand for persistent satellite surveillance, signals intelligence collection, and hardened communications relay capability across the region. US Central Command’s operational posture in Iraq depends heavily on satellite-based command and control architecture, and the demonstrated Iranian capability to conduct precision strikes against fixed ground infrastructure has accelerated Pentagon procurement decisions toward satellite-delivered communications that eliminate dependence on fixed terrestrial relay nodes vulnerable to missile interdiction.
The broader commercial consequence is visible in SAR constellation tasking patterns — operators with persistent coverage over the Persian Gulf, Iraqi airspace, and Iranian missile production facilities are receiving priority government tasking contracts that override commercial scheduling queues, effectively removing capacity from civilian markets and tightening supply for non-defence clients. Israel’s 2025 expansion of its Ofek reconnaissance satellite programme, accelerated in direct response to Iranian missile threat intelligence requirements, further validated the operational model of sovereign tactical satellite constellations as non-negotiable national security infrastructure in active conflict theatres rather than peacetime strategic assets.
Regional Analysis
North America Held the Largest Share of the Global Satellite Bus Market
North America commands the largest confirmed regional share at 47.50%, a position structurally anchored by the concentration of the world’s most capitalised constellation operators, the largest sovereign defence satellite procurement budget, and the deepest commercial launch infrastructure ecosystem operating at scale simultaneously. The United States Space Force’s FY2026 disaggregated resilience procurement policy, the Space Development Agency’s Tranche 2 Transport Layer programme, and the FCC’s active spectrum licensing and milestone enforcement framework collectively create a sovereign and commercial demand environment that no other region replicates in volume, cadence, or institutional depth.
For instance, the FCC’s November 2025 order tightening five-year deployment milestone requirements was itself a product of North America’s regulatory maturity — a jurisdiction confident enough in its operator base to impose accelerated deployment obligations that simultaneously filter undercapitalised entrants and reinforce the dominance of well-resourced incumbents headquartered overwhelmingly within the region.
In addition, the Asia-Pacific region is the market with the highest rate of expansion, fueled by collaborative ventures between government agencies and private companies aimed at developing indigenous navigation, broadband, and environmental observation satellite constellations. New market entrants are now establishing indigenous production lines for satellite buses and are setting up advanced satellite assembly, integration, and testing (AIT) facilities that can accommodate over 250 satellites annually.
Key Regions and Countries Covered in this Report
- North America
- The US
- Canada
- Europe
- Germany
- France
- The UK
- Spain
- Italy
- Russia & CIS
- Rest of Europe
- APAC
- China
- Japan
- South Korea
- India
- ASEAN
- Rest of APAC
- Latin America
- Brazil
- Mexico
- Rest of Latin America
- Middle East & Africa
- GCC
- South Africa
- Rest of MEA
The satellite industry in 2025–2026 is increasingly shaped by a shift away from standalone performance metrics like payload strength or orbital positioning, and toward full-stack control across launch, satellite manufacturing, operations, and data analytics. The real competitive advantage now comes from reducing the time between data capture in orbit and usable intelligence on the ground. This is pushing companies to integrate vertically, because depending on external suppliers for launch, hardware, or cloud processing introduces delays, higher costs, and operational uncertainty that becomes more damaging as satellite networks scale.
In this environment, Rocket Lab has built a tightly integrated small-satellite ecosystem by combining its launch services with its Photon satellite platform, allowing it to deliver end-to-end mission capability, particularly for government customers that prioritise reliability and responsiveness. Meanwhile, Exolaunch has evolved beyond being just a rideshare deployment service into a critical coordination layer for satellite launches, using its position in multi-payload missions to gain visibility over orbital deployment patterns and logistics flows.
A key emerging shift is the rise of autonomous constellation management, where AI systems handle satellite coordination, collision avoidance, and task scheduling across large fleets. As constellations grow into hundreds or thousands of satellites, manual control becomes inefficient, giving operators with advanced automation a compounding advantage. This creates a self-reinforcing cycle where more satellites generate more operational data, improving AI systems, which in turn enables even larger and more efficient constellations, making it increasingly difficult for late entrants to compete.
The following are some of the major players in the industry:
- Lockheed Martin Corporation
- Airbus Defence and Space SAS
- The Boeing Company
- Northrop Grumman Corporation
- Thales Alenia Space SAS
- Maxar Technologies Inc.
- Israel Aerospace Industries Ltd.
- Honeywell International Inc.
- Sierra Nevada Corporation
- Mitsubishi Electric Corporation
- China Aerospace Science and Technology Corporation (CASC)
- BAE Systems Space & Mission Systems Inc.
- UAB NanoAvionika
- NEC Corporation
- Space Exploration Technologies Corp
- Other Key Players
Report Scope
| Report Features | Description |
|---|---|
| Market Value (2025) | US$16.5 Bn |
| Forecast Revenue (2035) | US$33.1 Bn |
| CAGR (2026–2035) | 8.0% |
| Base Year for Estimation | 2025 |
| Historic Period | 2020–2024 |
| Forecast Period | 2026–2035 |
| Report Coverage | Revenue Forecast, Market Dynamics, Competitive Landscape, Recent Developments |
| Segments Covered | By Satellite Size/Class (Small Satellite, Medium Satellite, Large/Heavy Satellite), By Orbit Type (LEO, MEO, GEO, GSO, HEO, SSO), By Payload Capacity (Below 500 kg, 500–1,000 kg, Above 1,000 kg), By Application (Communication, Earth Observation & Remote Sensing, Navigation & Positioning, Scientific Research & Space Exploration, Surveillance & Reconnaissance, Technology Demonstration), By End User (Commercial Operators, Military & Defense, Government & Space Agencies, Academic & Research Institutions), By Propulsion Technology (Chemical, Electric/Ion, Hybrid) |
| Regional Analysis | North America – The US & Canada; Europe – Germany, France, The UK, Spain, Italy, Russia & CIS, Rest of Europe; APAC – China, Japan, South Korea, India, ASEAN & Rest of APAC; Latin America – Brazil, Mexico & Rest of Latin America; Middle East & Africa – GCC, South Africa, & Rest of MEA |
| Competitive Landscape | Lockheed Martin Corporation, Airbus Defence and Space SAS, The Boeing Company, Northrop Grumman Corporation, Thales Alenia Space SAS, Maxar Technologies Inc., Israel Aerospace Industries Ltd., Honeywell International Inc., Sierra Nevada Corporation, Mitsubishi Electric Corporation, China Aerospace Science and Technology Corporation (CASC), BAE Systems Space & Mission Systems Inc., UAB NanoAvionika, NEC Corporation, Space Exploration Technologies Corp, and Other Players. |
| Customization Scope | Customization for segments, region/country-level will be provided. Moreover, additional customization can be done based on the requirements. |
| Purchase Options | We have three licenses to opt for: Single User License, Multi-User License (Up to 5 Users), Corporate Use License (Unlimited Users and Printable PDF) |





































