


Report Overview
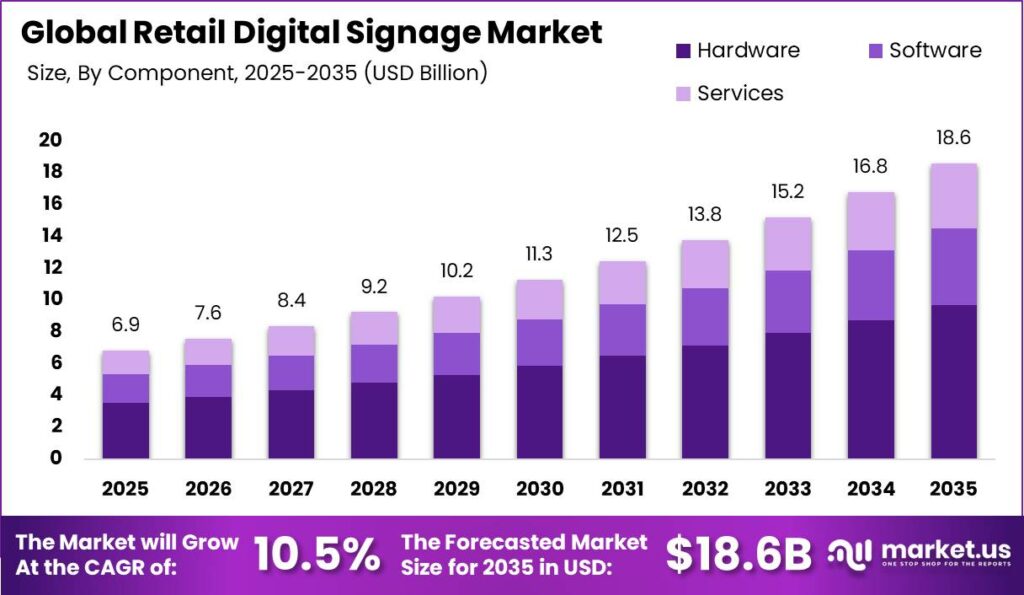
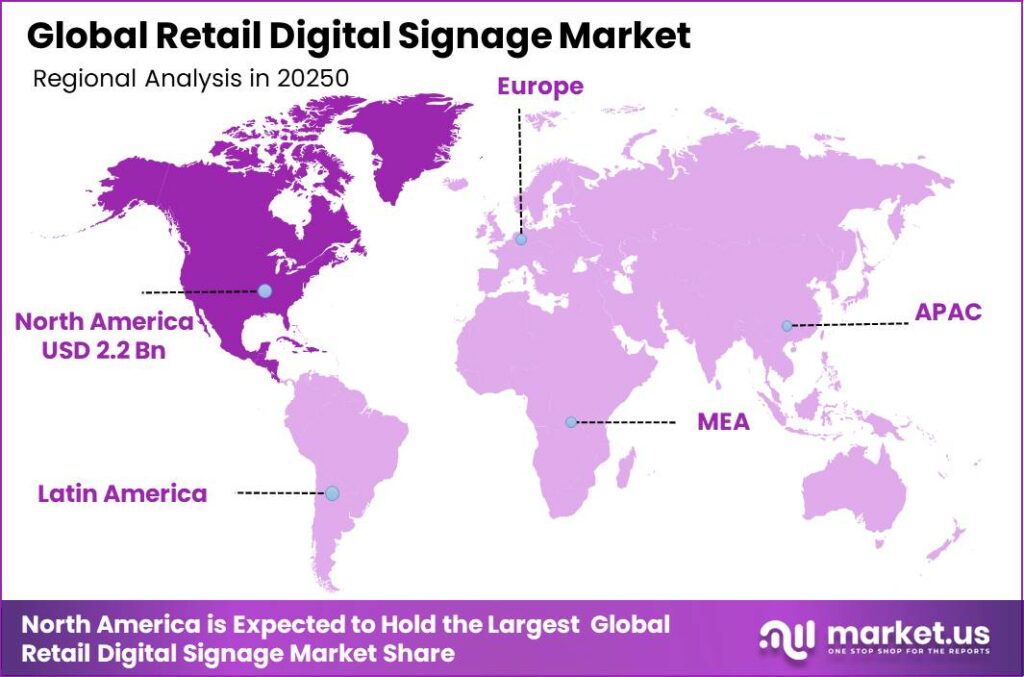
The Global Retail Digital Signage Market was valued at USD 6.9 billion in 2025 and is expected to grow at a CAGR of 10.5% from 2026 to 2035, reaching approximately USD 18.6 billion by 2035. North America dominated the market in 2025, holding over 32% share with revenue of nearly USD 2.2 billion. The growth of this market is closely linked to the expansion of the global retail industry and increasing demand for better customer engagement solutions.
According to the National Retail Federation (NRF), U.S. retail sales are projected to reach USD 5.6 trillion in 2026, growing 4.4% compared with 2025, while online and non-store sales are expected to reach USD 1.57–1.6 trillion. As retailers manage larger product portfolios and increasing competition, digital signage helps improve product visibility, deliver real-time promotions, support dynamic pricing, and enhance in-store experiences.
Rapid urbanization and the expansion of modern retail infrastructure are further supporting market growth. The United Nations World Urbanization Prospects 2025 indicates that 57.8% of the global population lives in urban areas, increasing demand for shopping centers, supermarkets, and branded retail spaces where digital displays are widely deployed.
Additionally, rising advertising investments are strengthening adoption, with the Out of Home Advertising Association of America (OAAA) reporting U.S. out-of-home advertising revenue of USD 1.98 billion in Q1 2025, reflecting strong demand for digital media in physical environments. These factors are driving continued adoption of retail digital signage solutions worldwide.
Key Takeaway
- The Global Retail Digital Signage Market was valued at USD 6.9 billion in 2025 and is projected to reach USD 18.6 billion by 2035, growing at a CAGR of 10.5% during 2026–2035.
- Hardware dominated the component segment with a 52.0% market share, driven by strong demand for digital displays and interactive retail solutions.
- LCD Displays led the display technology segment with a 44.0% share, owing to their affordability and widespread retail adoption.
- In-Store Advertising was the leading application segment with a 32.0% share, supported by increasing use of digital promotions and brand communication.
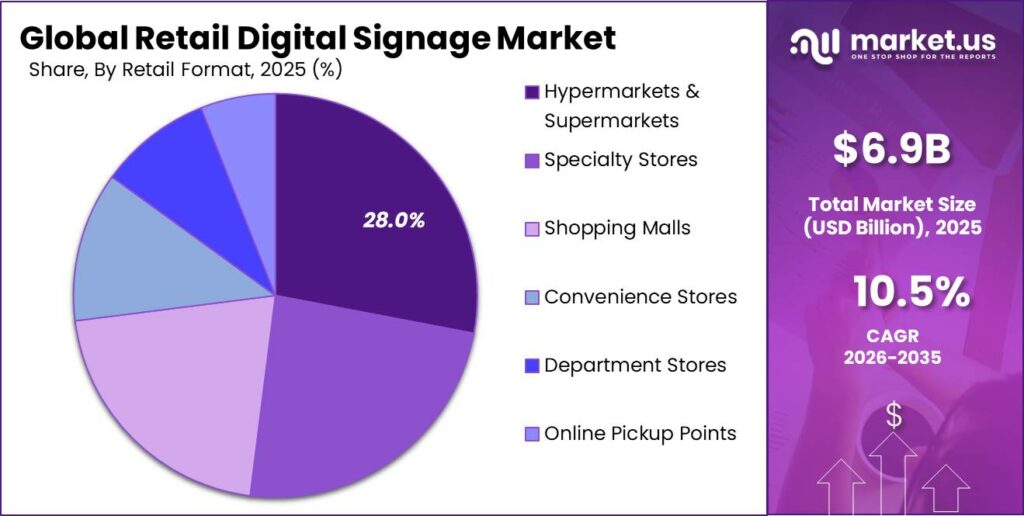
- Hypermarkets & Supermarkets dominated the retail format segment with a 28.0% share, due to extensive deployment of signage across large retail spaces.
- North America held the largest regional market share at 32.0% in 2025, supported by advanced retail infrastructure and higher digital signage adoption.
By Component
Hardware dominates the component segment with approximately 52% revenue share, driven by the high upfront investment required for displays, media players, mounts, and other physical infrastructure in retail digital signage deployments.
Broader digital signage trends show hardware accounting for nearly 58–60% of global component spending, with LCD/LED technologies contributing around 46% of the market, highlighting the importance of panels, drivers, and electronic components.
This hardware dominance is supported by global ICT supply chains, with UNCTAD reporting that ICT goods accounted for more than 12% of global merchandise exports in 2024, while nearly 80% of these hardware exports originated from Asia. Electronic components remain the largest ICT goods category by import share, reflecting strong global demand for chips, controllers, and modules used in signage systems.
By Display Technology
LCD Displays lead the display technology segment with approximately 44% share of global digital signage deployments, with LCD/LED technologies together accounting for around 45–47% of the market by 2025–2026, reinforcing their dominance in retail screen installations.
Indoor retail deployments, where LCD remains the preferred technology, contribute approximately 63–66% of total digital signage revenues, while retail accounts for more than 20% of end-use spending. Rising retail activity continues to support investment in digital displays for visual merchandising, promotions, and digital price communication.
LCDs’ cost efficiency and scalability further strengthen its market position. Hardware represents nearly 58–60% of digital signage spending, and LCDs in the 32–52-inch size range, commonly used for shelves, end-caps, and menu boards, capture approximately 44–45% of screen size demand.
By Application
In-store Advertising leads the application segment with approximately 32% revenue share, driven by its strong connection with physical retail environments and its ability to influence customers at the point of purchase.
UNCTAD and UN e-commerce assessments indicate that online retail sales increased from around 14–16% of global retail sales before the pandemic to approximately 17–19% in 2020, meaning more than 80% of purchases still occur in physical stores where digital signage can impact product visibility and promotional decisions.
UNCTAD estimates global e-commerce activity, including B2B and B2C transactions, reached USD 26.7 trillion in 2019, representing around 30% of global GDP, highlighting the scale of the broader retail ecosystem. Online retail sales in major economies also increased from approximately USD 2 trillion in 2019 to USD 2.9 trillion in 2021, expanding the overall retail market and increasing opportunities for in-store engagement.
By Retail Format
Hypermarkets and Supermarkets dominate the retail format segment with approximately 28% revenue share, supported by their high customer traffic, large store footprints, and extensive use of digital display networks. Food and beverages accounted for 8.3% of global merchandise exports in 2022, highlighting the scale of FMCG categories that depend on in-store promotions, pricing communication, and customer engagement.
Retail trade contributes around 5% of total value added in the EU economy, reflecting the importance of physical retail operations. These large-format stores deploy extensive digital signage solutions, including video walls, digital end-caps, menu boards, and electronic shelf labels across wide retail spaces, resulting in higher screen installations and advertising opportunities compared with smaller retail formats.
Key Market Segments
By Components
- Hardware
- LED / LCD Displays
- Indoor Displays
- Outdoor Displays
- Kiosks & Interactive Displays
- Self-Service Kiosks
- Touchscreen Displays
- Media Players
- LED / LCD Displays
- Software
- CMS Platforms
- Analytics & AI Software
- Services
- Managed Services
- Installation Services
By Display Technology
- LCD Displays
- LED Displays
- Direct-View LED
- LED Backlit LCD
- OLED Displays
- E-Paper / E-Ink
- Projection
By Application
- In-Store Advertising
- Promotional Displays
- Brand Storytelling
- Customer Engagement
- Wayfinding & Navigation
- Interactive Experience
- Price & Promotion Displays
- Queue Management
- Analytics & Audience Insight
By Retail Format
- Hypermarkets & Supermarkets
- Large-Format Supermarkets
- Discount Stores
- Specialty Stores
- Shopping Malls
- Convenience Stores
- Forecourt / Fuel Retail
- Urban Convenience Stores
- Department Stores
- Online Pickup Points
Geopolitical Impact Analysis
The Global Retail Digital Signage Market is facing increasing supply chain and cost challenges due to geopolitical tensions, trade restrictions, and logistics disruptions. The ongoing U.S.–China trade conflict has become a major risk factor, with U.S. import duties on Chinese electronics and electronic components reaching a peak of 145% before stabilizing at an effective average of approximately 57%. Semiconductors, which are essential for processing units and System-on-Chip (SoC) drivers used in digital signage displays, have faced tariffs of up to 50%.
China remains a critical supplier, accounting for more than 70% of global LCD panel capacity. Additionally, tariffs on rigid and flexible PCBs used in display signal processing range between 25% and 30%, reducing OEM margins by an estimated 15% or more on affected product lines.
China’s expanded rare-earth export controls in October 2025, covering nearly all 17 recognized rare-earth elements, have further increased supply risks, particularly for indium used in Indium Tin Oxide (ITO) conductive layers in LCD and LED-touch panels. The WTO has forecast a 0.2% decline in global merchandise trade in 2025, compared with an earlier projected 3.0% expansion, while warning that full U.S.–China trade decoupling could reduce global GDP by up to 7%.
Maritime disruptions from the Houthi conflict in the Red Sea are creating additional challenges for digital signage manufacturers and distributors. According to UNCTAD, the crisis affected 30% of global container trade and caused a 42% decline in trade volume through the impacted period. The World Bank recorded a 90% reduction in container ship transits through the Suez Canal between December 2023 and March 2024.
The IMF reported that rerouting vessels around the Cape of Good Hope increased average delivery times by 10 days or more, while the New Zealand Ministry of Foreign Affairs estimated that the alternative route adds approximately 40% more voyage distance and creates shipping delays of 2 to 5 weeks. Freight spot rates from Asia to Europe increased nearly 5 times on Suez-dependent routes, while China-to-U.S.
Regional Analysis
North America continues to maintain its leading position in the global Retail Digital Signage Market, supported by strong retail infrastructure, advanced advertising ecosystems, and high adoption of digital customer engagement technologies. The region’s digital signage market across all verticals accounted for approximately 35.6% revenue share in recent base years, reinforcing its strong position behind the retail-specific market share of 32.0% and revenue of approximately USD 2.2 billion in 2025.
Growth in North America is supported by widespread deployment of digital displays, interactive kiosks, and smart retail solutions across stores, shopping centers, and commercial spaces. Asia Pacific is emerging as the fastest-growing region in the digital signage industry, driven by rapid retail expansion, urbanization, and increasing adoption across retail, hospitality, and transportation sectors.
The region is expected to achieve the highest CAGR of approximately 9.2–9.8% in the overall digital signage market. Countries such as China and India are accelerating investments in digital retail infrastructure, creating significant growth opportunities for display technologies and connected signage solutions.
The Asia Pacific digital signage market was valued in the mid-single-digit billions, reaching approximately USD 6.6–7.5 billion in the early- to mid-2020s, and is projected to more than double by the early 2030s. Globally, retail remains one of the largest digital signage application areas, contributing approximately 19–20% of total spending, highlighting the importance of retail deployments in regional market expansion.
Key Regions and Countries Covered in this Report
North America
- The US
- Canada
Europe
- Germany
- France
- The UK
- Spain
- Italy
- Russia & CIS
- Rest of Europe
APAC
- China
- Japan
- South Korea
- India
- ASEAN
- Rest of APAC
Latin America
- Brazil
- Mexico
- Rest of Latin America
Middle East & Africa
- GCC
- South Africa
- Rest of MEA
Market Dynamics
Drivers
| Driver | (~) % CAGR | Geographic Relevance | Impact Timeline |
|---|---|---|---|
| AI-Powered Content Personalization and Audience Analytics | +2.8% | Global; led by North America and Western Europe | Short term (2 years or less) |
| Cloud-Based CMS Platform Adoption and SaaS Monetization Shift | +2.2% | Global; accelerating in Asia-Pacific and Latin America | Short term (2 years or less) |
| LED Display Cost Democratization Enabling SME Penetration | +1.8% | Asia-Pacific, South and Southeast Asia, MENA | Short term (2 years or less) |
| Omnichannel Retail Strategy Integration Driving In-Store Screen Deployment | +1.5% | Global; strongest in North America and Western Europe | Medium term (2 to 4 years) |
| Programmatic DOOH Advertising Revenue Monetization | +1.4% | North America, Western Europe, urban Asia-Pacific | Short term (2 years or less) |
| Retail Digital Transformation and Smart Store Rollouts | +0.8% | Global; emerging markets accelerating fastest | Medium term (2 to 4 years) |
AI-Powered Content Personalization and Audience Analytics
The transition from static broadcast scheduling to AI-driven, sensor-activated content delivery represents the most structurally significant business model shift in retail digital signage today. Retailers deploying computer-vision-enabled displays, which use anonymous audience detection to infer demographics, dwell time, and attention metrics, are unlocking a new tier of CPM-based monetization that was commercially unavailable before 2024.
In-store screens operating with AI personalization layers command media rate premiums of roughly 30 to 45% over non-personalized inventory, driven by the verifiable attribution data they generate for brand advertisers. The content management workflow itself has shifted: AI-assisted generation tools cut creative refresh lead times from days to under 4 hours, reducing per-campaign operating costs for network operators by an estimated 20 to 25%.
On the hardware side, edge-AI media players capable of local inference, avoiding cloud round-trip latency, entered commercial retail deployments at scale during 2024 and 2025, with per-unit compute costs falling below $200 for entry-tier configurations, removing a prior CapEx bottleneck for mid-market chains.
Platform vendors have responded by bundling analytics dashboards into SaaS subscriptions, converting a previously hardware-margin-dependent business into a recurring-revenue model where software ARR can reach 15 to 20% of total contract value for a multi-location deployment, compressing hardware-only competitor margins and raising platform switching costs simultaneously.
Restraints
| Restraint | (~) % CAGR | Geographic Relevance | Impact Timeline |
|---|---|---|---|
| High Upfront Hardware and Installation CapEx Blocking SME Conversion | -2.1% | Global; most acute in South Asia, Southeast Asia, Sub-Saharan Africa | Short term (2 years or less) |
| Elevated Interest Rates Compressing Retail CapEx Budgets | -1.4% | North America, Europe, Brazil | Short term (2 years or less) |
| Stringent EU Ecodesign and Energy-Labelling Compliance Costs | -0.9% | European Union and EEA export markets | Short term (2 years or less) |
| Data Privacy Legislation Restricting Audience-Analytics Deployments | -0.8% | EU (GDPR), California (CCPA), India (DPDP Act) | Medium term (2 to 4 years) |
| Fragmented Proprietary Standards Impeding Multi-Vendor Interoperability | -0.6% | Global | Medium term (2 to 4 years) |
High Upfront Hardware and Installation CapEx Blocking SME Conversion
Despite meaningful LED panel price compression over the preceding two years, inclusive of a 43 to 55 inch commercial display, a dedicated media player, mounting hardware, network provisioning, and first-year installation labor, continues to range between Rs. 90,000 and Rs. 2,50,000 per screen in the Indian subcontinent and equivalent mid-market emerging economies, representing between 6 and 18 months of net operating income for a standalone small-format retailer.
This upfront cost cliff freezes conversion among the segment that represents the largest volumetric growth pool: independent grocery, which collectively account for more than 60% of organized retail outlet count in South and Southeast Asia. An OECD survey of SME digitalisation barriers published in 2025 identified hardware costs as a top-three constraint for 32% of surveyed SMEs globally.
Vendors reliant on upfront hardware revenue are therefore exposed to a structural mix-shift problem: as enterprise refresh cycles extend from the historical 3- to 4-year cadence toward 5 to 6 years due to display durability improvements, they cannot easily offset the volume shortfall without a viable SME financing or device-as-a-service (DaaS) mechanism, which fewer than 15% of market participants currently offer at commercial scale.
Challenges
| Challenge | (~) % CAGR | Geographic Relevance | Mitigation Horizon |
|---|---|---|---|
| Content Operations Talent Deficit | -1.7% | Global; most severe in emerging markets | Medium term (2 to 4 years) |
| Cybersecurity and Network Vulnerability Exposure | -1.1% | Global; acute in retail-dense North America and Europe | Medium term (2 to 4 years) |
| Display Hardware Supply Chain Concentration | -0.9% | Global; sourcing concentrated in East Asia | Long term (4 years or more) |
| ROI Measurement Standardization Gap | -0.8% | Global; worst in fragmented mid-market segments | Medium term (2 to 4 years) |
| Legacy Infrastructure Integration Complexity | -0.6% | North America, Western Europe, Japan | Long term (4 years or more) |
Content Operations Talent Deficit
The structural mismatch between the accelerating complexity of dynamic digital signage content, now expected to incorporate real-time data feeds, AI-generated creative variants, daypart scheduling logic, and audience-triggered conditional playback, and the available pool of professionals trained to design, operate, and optimize such systems represents the most persistent ceiling on market velocity.
Retail operators deploying networks of more than 50 screens typically require a dedicated content operations function encompassing UX-aware creative design, CMS platform management, analytics interpretation, and integration with POS and inventory systems.
The WEF Future of Jobs Report 2025 identifies skill gaps as the single largest barrier to business transformation for 63% of global employers, and retail digital signage networks are disproportionately exposed because the role sits at an uncommon intersection of retail operations, media production, and software platform management.
Opportunities
| Opportunity | (~) % CAGR | Geographic Relevance | Execution Window |
|---|---|---|---|
| In-Store Retail Media Network (RMN) Monetization | +3.2% | Global; highest immediate yield in North America and Western Europe | Short term (2 years or less) |
| Device-as-a-Service (DaaS) and Hardware Subscription Models for SMEs | +2.0% | South Asia, Southeast Asia, Sub-Saharan Africa, MENA | Medium term (2 to 4 years) |
| Transparent and Flexible Display Format Adoption in Premium Retail | +1.5% | Global; luxury and premium retail concentrated in East Asia, Europe, Middle East | Medium term (2 to 4 years) |
| AR-Integrated Interactive Kiosk Deployment | +1.2% | North America, East Asia, Western Europe | Medium term (2 to 4 years) |
| Tier-2 and Tier-3 City Retail Digitalization in Emerging Economies | +1.0% | India, Indonesia, Vietnam, Nigeria, Mexico | Long term (4 years or more) |
| Sustainability-Branded Low-Energy Display Premiumization | +0.6% | EU, UK, Australia, Canada | Medium term (2 to 4 years) |
In-Store Retail Media Network (RMN) Monetization
The transformation of retailer-owned digital signage infrastructure from a cost center into a direct advertising revenue asset remains substantially underexploited, representing the largest single white-space opportunity available to market participants today: DSP/SSP connectivity, audience data packaging, and brand advertiser sales capability that fewer than 20% of mid-market retail digital signage operators have activated as of 2026.
Global retail media advertising revenue is estimated to approach $153 billion by 2026 across all channels, yet in-store physical digital screens capture a disproportionately small fraction of that pool relative to the volume of brand advertising spend seeking proximity-to-purchase placements; the structural monetization gap exists because most in-store screen networks lack the programmatic plumbing.
Closing this gap unlocks a unit-economics step-change for network operators: a screen generating only static own-brand promotional content carries an effective CPM contribution of near zero, while the same screen integrated into a programmatic RMN and sold to FMCG brand advertisers can generate net media revenue of $8 to $20 CPM per measured impression, with operating margins on the media revenue component exceeding 60 to 70% once the fixed CMS and hardware costs are already amortized.
Early movers, primarily large-format grocery chains and hypermarket operators in North America and Western Europe, validated this model between 2023 and 2025, demonstrating sales lift of 15 to 32% for brand-sponsored product categories on RMN-connected screens.
Key Players Analysis
Samsung Electronics leads the global commercial display market, ranking No. 1 for 17 consecutive years with a 35.2% market share by unit sales in 2025 and shipping 2.5 million commercial display units.
The company reported KRW 300.9 trillion (USD 221 billion) in FY2024 revenue, invested KRW 28.3 trillion (USD 20.7 billion) in R&D, and spent KRW 53.6 trillion (USD 39.2 billion) on capital expenditures. Its Visual Display (VD) division, covering Smart Signage, LFDs, video walls, and outdoor displays, remains a key growth driver, supported by AI-enabled platforms, MicroLED solutions, and cloud-based content management.
LG Electronics is the leading Tier-1 challenger, generating KRW 89.2 trillion (~USD 65.4 billion) in FY2025 revenue, with B2B revenue reaching KRW 24.1 trillion (~USD 17.7 billion), up 3% year-on-year. Its OLED signage portfolio is strengthened by LG Display, which recorded KRW 25.8 trillion FY2025 revenue, with OLED products contributing 61% of total revenue.
Tier-2 players include Sharp NEC Display Solutions, Panasonic Connect, and Daktronics. Sharp NEC generated approximately USD 1.25 billion in digital signage revenue in 2024 with an estimated 5–7% global unit share.
Panasonic Connect reported JPY 1,380.3 billion (~USD 9.1 billion) FY2026 sales, while Daktronics recorded USD 756.5 million FY2025 net sales. The market remains moderately fragmented, with the top five vendors accounting for approximately 35–42% of combined revenue share, while Chinese LED specialists expand through cost-competitive technologies.
Top Key Players in the Market
- Samsung Electronics
- LG Electronics
- NEC Display Solutions
- Scala (STRATACACHE)
- BrightSign LLC
- Planar Systems
- Sony Corporation
- Philips Professional
- Mvix Inc.
- NoviSign Digital
- Omnivex Corporation
- Signagelive
Recent Developments
- In January 2026, Samsung Electronics Co., Ltd. announced a KRW 450 billion (approximately USD 350 million) investment to expand production capacity for retail-focused large-format LED digital signage at its Asan and Suwon display facilities, adding 120,000 square meters of floor space and increasing annual output by an estimated 220,000 commercial display units dedicated to retail environments across North America and EMEA.
- In March 2026, LG Electronics Inc. disclosed in a corporate filing that it will invest KRW 310 billion (around USD 240 million) to upgrade and expand its Paju OLED signage production line, targeting retail applications. The project adds 85,000 square meters of cleanroom capacity and is expected to raise annual retail digital signage panel output by 180,000 units starting in Q4 2026.
- In May 2026, Sony Group Corporation announced the acquisition of a majority stake (70%) in BrightSign LLC, a leading digital signage media player and CMS provider heavily deployed in retail, in a cash-and-stock deal valued at USD 420 million. Sony cited retail digital signage as a core vertical, with BrightSign’s installed base exceeding 1.8 million players globally and over 45% deployed in retail use cases.
Report Scope
| Report Features | Description |
|---|---|
| Market Value (2025) | USD 6.9 Billion |
| Forecast Revenue (2035) | USD 18.6 Billion |
| CAGR (2026-2035) | 10.5% |
| Base Year for Estimation | 2025 |
| Historic Period | 2020-2024 |
| Forecast Period | 2026-2035 |
| Report Coverage | Revenue Forecast, Market Dynamics, Competitive Landscape, Recent Developments |
| Segments Covered | By Component (Hardware, Software, Services), By Display Technology (LCD Displays, LED Displays, OLED Displays, E-Paper / E-Ink, Projection), By Application (In-Store Advertising, Customer Engagement, Price & Promotion Displays, Queue Management, Analytics & Audience Insight), By Retail Format (Hypermarkets & Supermarkets, Specialty Stores, Shopping Malls, Convenience Stores, Department Stores, Online Pickup Points) |
| Regional Analysis | North America – US, Canada; Europe – Germany, France, The UK, Spain, Italy, Rest of Europe; Asia Pacific – China, Japan, South Korea, India, Australia, Singapore, Rest of APAC; Latin America – Brazil, Mexico, Rest of Latin America; Middle East & Africa – GCC, South Africa, Rest of MEA |
| Competitive Landscape | Samsung Electronics, LG Electronics, NEC Display Solutions, Scala (STRATACACHE), BrightSign LLC, Planar Systems, Sony Corporation, Philips Professional, Mvix Inc., NoviSign Digital, Omnivex Corporation, Signagelive |
| Customization Scope | Customization for segments and region/country-level will be provided. Moreover, additional customization can be done based on the requirements. |
| Purchase Options | We have three licenses to opt for: Single User License, Multi-User License (Up to 5 Users), Corporate Use License (Unlimited Users and Printable PDF) |





































