Report Overview
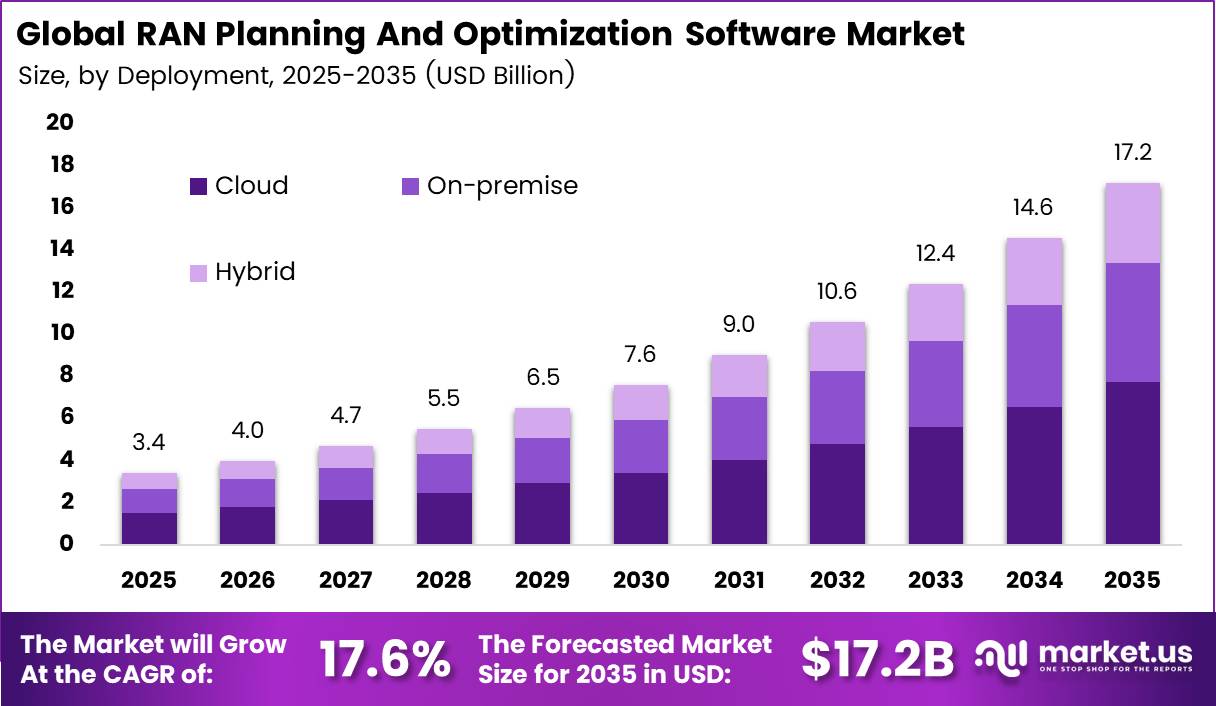
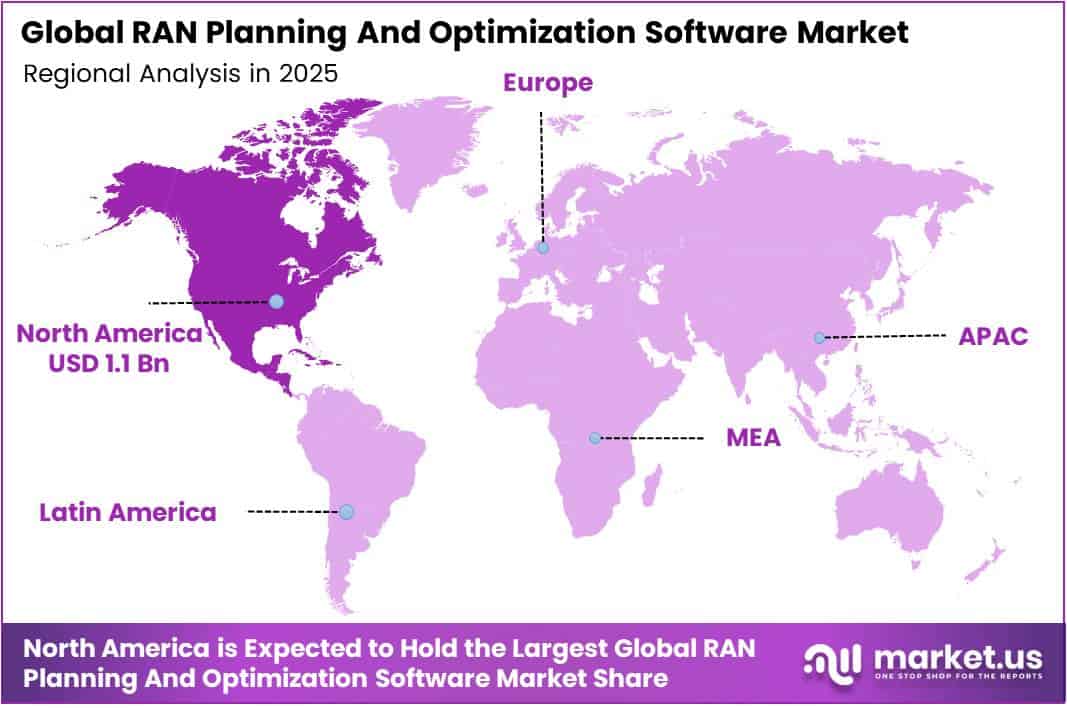
In 2025, the Global RAN Planning And Optimization Software Market was valued at USD 3.4 billion. The market is projected to grow at a CAGR of 17.6% during 2026–2035, reaching approximately USD 17.2 billion by 2035. North America dominated the global market in 2025, accounting for more than 31.3% of the total market share and generating approximately USD 1.1 billion in revenue.
The main driver is the fast spread of 5G networks. The Ericsson Mobility Report shows that 5G subscriptions rose from 2.28 billion in 2024 to 2.94 billion in 2025. They will reach 6.4 billion by 2031. Operators added about 660 million 5G subscriptions in 2025 alone.
5G networks also carried 48% of all mobile data traffic at the end of 2025, and this share will rise to 85% by 2031. Each new 5G cell, band, and standalone core adds work for planning teams. So operators need software to model coverage, tune capacity, and cut interference at scale.
The North America region has the most mature 5G user base in the world. The Ericsson Mobility Report shows that North America reached 79% 5G subscription penetration at the end of 2025, the highest of any region. The region had about 370 million 5G subscriptions that year, and its penetration will reach 92% by 2031. Dense networks like these need constant tuning.
Key Takeaways
- The RAN Planning and Optimization Software Market was valued at USD 3.4 billion in 2025 and will reach USD 17.2 billion by 2035. At a CAGR of 17.6% from 2026 to 2035.
- By component, Software leads with a 65.5% share.
- By function, RAN Optimization leads with a 23.4% share.
- By deployment, On-premises leads with a 42.1% share.
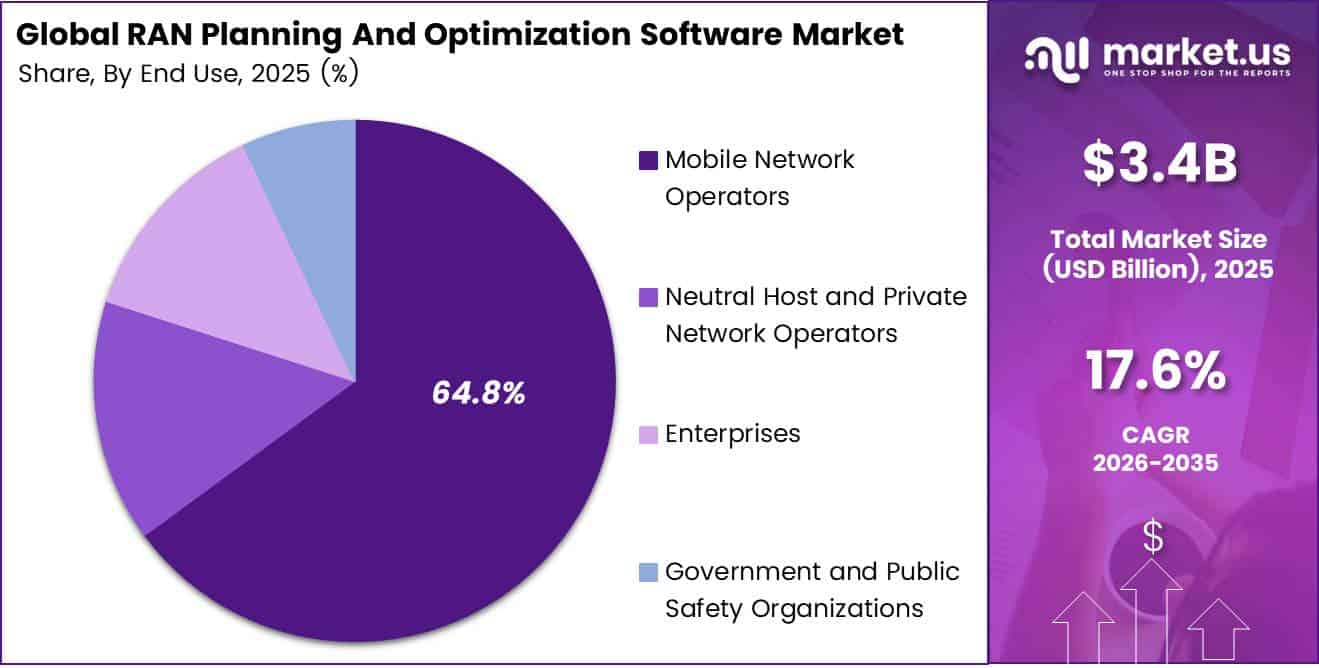
- By end user, Mobile Network Operators lead with a 64.8% share.
- North America leads with a 31.3% share and USD 1.1 billion in revenue.
By Component
Software dominates with 65.5% due to large-scale automated radio site modeling.
Software leads this market because mobile operators need digital tools to model sites, predict coverage, and tune thousands of radio cells at once. GSMA expects operators worldwide to spend $1.3 trillion in capex between 2024 and 2030, and every new radio site needs planning software before crews build it.
Large vendors also put software at the core of each rollout. Nokia’s Mobile Networks unit posted EUR 7.8 billion in net sales in 2025. In 2024, the same unit added 18,000 base station sites on a net basis. Each added site creates new demand for planning licenses, drive-test analytics, and optimization modules.
Services grow fastest because many operators do not have enough skilled radio engineers to run complex 5G, Open RAN, and AI tools in-house. Energy takes about 20% of operator operating costs, according to GSMA, so operators hire expert teams to cut power use and fine-tune live networks.
By Function
RAN Optimization dominates with 23.4% due to constant traffic growth demanding live tuning.
RAN Optimization holds the top share because operators must tune live networks every day to keep speeds high and dropped calls low. Ericsson reports that 5G networks carried 35% of global mobile traffic by the end of 2024. It expects that figure to pass 80% by 2030.
This shift puts a heavy load on existing cells. Ericsson also projects that global mobile data traffic will grow almost 200% between 2024 and 2030. Operators cannot add new towers fast enough to keep up, so they rely on optimization tools to adjust antenna tilt, power levels, and handover settings on sites they already own.
RAN Planning and Design grows fastest because most of the 5G build-out is still ahead. Nokia estimates that operators outside China have deployed only about 30% of potential mid-band 5G high-capacity base stations. The remaining 70% must go through site selection, link budgets, and coverage modeling before construction starts.
By Deployment
On-premise dominates with 42.1% due to strict network data control rules.
On-premise deployment leads because mobile operators treat radio network data as critical national infrastructure. Many regulators require operators to keep subscriber and network records within their own borders and data centers.
Cloud deployment grows fastest because operators now build cloud-native cores and want their RAN tools to match. Nokia ended 2024 with 123 5G Standalone Core customers, the highest count in the industry. Ericsson forecasts that 5G Standalone subscriptions will reach around 3.9 billion in 2031, about 60% of all 5G subscriptions.
By End User
Mobile Network Operators dominate with 64.8% due to large nationwide networks needing constant tuning.
Mobile Network Operators hold the largest share because they own and run the world’s public radio networks. GSMA counts 5.8 billion unique mobile subscribers in 2024, and operators must plan and tune every cell that serves them. Ericsson reports that operators added around 660 million 5G subscriptions in 2025 alone, which means constant capacity checks and coverage fixes.
Operators also control the biggest RAN budgets and the deepest engineering teams. They buy full suites of planning, optimization, and performance tools under long-term vendor contracts. Their scale, often tens of thousands of sites per operator, keeps demand steady.
Neutral Host and Private Network Operators grow fastest as factories, ports, mines, stadiums, and campuses build their own wireless networks. Nokia served 850 private wireless customers at the end of 2024, including 182 on 5G, and passed 1,000 customers by the end of 2025. Neutral hosts share one network across several operators inside malls, airports, and office towers, which cuts costs for everyone.
Key Market Segments
By Component
- Software
- Services
By Function
- RAN Optimization
- RAN Planning and Design
- Performance Management
- Capacity Planning
- Coverage and Propagation Analysis
- Interference Management
- Other
By Deployment
- On-premise
- Cloud
- Hybrid
By End User
- Mobile Network Operators
- Neutral Host and Private Network Operators
- Enterprises
- Government and Public Safety Organizations
- Network Equipment Vendors and System Integrators
Geopolitical Impact Analysis
Trade tensions shape the hardware layer that RAN software runs on. The WTO reported that world merchandise trade volume grew 4.6% in 2025. Firms rushed imports ahead of new US tariffs, which stayed suspended until August. AI-enabling goods trade jumped 21.9% to USD 4.18 trillion. These goods include the chips, servers, and data transmission gear that cloud RAN tools need.
Tariff rules have also become harder to plan around. The WTO estimates that the share of world trade under MFN terms fell from 80% in 2024 to about 72% by early 2026. Software vendors that bundle drive test kits, scanners, and edge servers now face more complex landed costs. Many shift pricing toward subscriptions so customers avoid large upfront hardware bills.
Shipping problems add delays. UNCTAD reported that Suez Canal tonnage transits stayed about 70% below the 2023 average by early May 2025. Ships that once crossed the Red Sea in days now sail for weeks around the Cape of Good Hope. Seaborne ton-miles rose a record 5.9% in 2024. This slows delivery of radio test gear and site hardware, which pushes back field rollouts and planning jobs.
Demand still holds firm. The WTO raised its 2026 merchandise trade forecast to 3.9% from 1.9% because AI spending stayed strong. It expects Asia’s import volume to grow 9.5% in 2026. That demand supports cloud and AI-based RAN tools in Asia, while vendors move some supply chains away from conflict routes.
Regional Analysis
North America dominates the RAN Planning and Optimization Software Market, holding a 31.3% share and generating USD 1.1 billion in revenue. The US drives most of this demand. Canada adds steady spending as its operators expand 5G across wide rural areas. The Ericsson Mobility Report expects regional 5G subscriptions to reach about 460 million by 2031, a CAGR of about 3% from 2025.
Asia Pacific is the fastest-growing region in the market. China leads in scale. Mainland China reached 1.2 billion 5G subscriptions at the end of 2025, and 5G networks carried about 70% of its mobile data traffic. India adds the most new growth. Its 5G base will rise from 430 million in 2025 to about 1.1 billion by 2031. South East Asia and Oceania will grow from 160 million to about 670 million 5G subscriptions.
Europe holds a solid position with growing demand. Western Europe reached about 300 million 5G subscriptions in 2025, equal to 54% penetration. It will reach about 540 million and 95% penetration by 2031. Central and Eastern Europe will grow from 80 million to 380 million 5G subscriptions at a 30% CAGR.
Latin America shows strong upside from a small base. The region had about 110 million 5G subscriptions in 2025. This will rise to about 550 million by 2031, a CAGR of 32%. Brazil and Mexico lead deployments and planning demand. Operators in the region need cost-efficient coverage planning because populations are spread across both dense cities and wide rural areas.
Key Regions and Countries
North America
- US
- Canada
Europe
- Germany
- France
- The UK
- Spain
- Italy
- Rest of Europe
Asia Pacific
- China
- Japan
- South Korea
- India
- Australia
- Rest of APAC
Latin America
- Brazil
- Mexico
- Rest of Latin America
Middle East and Africa
- GCC
- South Africa
- Rest of MEA
Market Dynamics
Drivers
| Driver | (~) % Impact on CAGR Forecast | Geographic Relevance | Impact Timeline |
|---|---|---|---|
| 5G Standalone Densification | +3.2% | Global, led by Asia Pacific and North America | Short term (2 years or less) |
| AI-Native SON and RIC Adoption | +2.6% | North America, Europe, Japan, South Korea | Medium term (2 to 4 years) |
| Open RAN Multi-Vendor Integration | +1.9% | North America, Europe, India | Medium term (2 to 4 years) |
| Operator Energy-Efficiency Mandates | +1.4% | Europe, China, Middle East | Short term (2 years or less) |
| Cloud-Native OSS Migration | +1.2% | Global | Medium term (2 to 4 years) |
5G Standalone Densification
The move from non-standalone to standalone 5G cores is the main structural trigger. Mid-band (3.5 GHz) and small-cell rollouts need roughly 3x to 5x the site density of LTE grids, which multiplies the parameters that planning tools must model per cluster.
GSMA Intelligence operator tracking shows more than 60 commercial 5G SA networks were live by 2025, and Ericsson Mobility Report data projects 5G subscriptions passing 2.9 billion through 2025. Over that period, Reliance Jio and Bharti Airtel annual reports describe India’s 400,000+ 5G base-station deployments.
The commercial result is a move away from perpetual per-seat planning licenses toward per-cell or per-site SaaS subscriptions. That shift typically raises vendor recurring revenue share by 15 to 25 percentage points. It also cuts operator drive-test OpEx by an estimated 30% to 40%, because geolocated crowdsourced MDT data replaces physical surveys.
Restraints
| Restraint | (~) % Impact on CAGR Forecast | Geographic Relevance | Impact Timeline |
|---|---|---|---|
| Telecom CapEx Contraction Cycle | -2.4% | Global, acute in North America and Europe | Short term (2 years or less) |
| High-Risk Vendor Bans | -1.3% | United States, European Union, United Kingdom | Short term (2 years or less) |
| Data Localization Restrictions | -0.9% | China, India, Russia, Gulf states | Medium term (2 to 4 years) |
| Bundled Equipment-Vendor Tooling | -0.8% | Global | Medium term (2 to 4 years) |
| Low ARPU in Emerging Markets | -0.6% | Africa, South Asia, Latin America | Long term (4 years or more) |
Telecom CapEx Contraction Cycle
The root cause is a post-peak 5G spending correction. Nokia and Ericsson annual reports show mobile-network sales falling by about 20% or more in 2023–2024, with North American RAN orders dropping the most. Operators are also stuck with high borrowing costs: Federal Reserve and ECB policy-rate data show benchmark rates above 4% through much of 2024.
Because many operators carry leverage of 2.5x to 3x net debt-to-EBITDA, per carrier investor disclosures, this squeezes free cash flow. The bottleneck shows up as capital intensity falling from about 20% toward 15% of revenue, according to GSMA operator financial benchmarks.
Discretionary software lines like planning and optimization licenses get cut or pushed back first. Vendors see this as procurement cycles stretching by 6 to 9 months and price concessions of 10% to 15% on renewals, which compresses gross margins on enterprise contracts.
Challenges
| Challenge | (~) % CAGR Friction Drag | Geographic Relevance | Mitigation Horizon |
|---|---|---|---|
| RF and AI Talent Shortage | -1.5% | North America, Europe, Southeast Asia | Long term (4 years or more) |
| Multi-Vendor Data Interoperability | -1.1% | Global | Medium term (2 to 4 years) |
| AI Model Explainability Gaps | -0.7% | European Union, North America | Medium term (2 to 4 years) |
| Network Cybersecurity Exposure | -0.6% | Global | Short term (2 years or less) |
| Legacy Network Coexistence Complexity | -0.5% | Europe, Latin America, Africa | Medium term (2 to 4 years) |
RF and AI Talent Shortage
The structural weakness is a shrinking pool of RF engineers who also have machine-learning and cloud-native skills. US Bureau of Labor Statistics occupational data shows telecom engineering headcount staying flat while demand for data-science roles grows above 30% per decade.
In Europe, Eurostat ICT specialist statistics point to a deficit of more than 1 million specialists against the EU Digital Decade target of 20 million by 2030. The friction appears as deployment timelines for AI-driven optimization stretch by 20% to 35%.
Fully loaded costs for specialist engineers also rise 8% to 12% a year, according to IEEE workforce surveys. Over the long term, vendors will have to build no-code automation layers, run certification academies with operators, and use nearshore delivery centres. All of these push up operating costs by an estimated 2 to 4 percentage points of revenue.
Opportunities
| Opportunity | (~) % Potential CAGR Upside | Geographic Relevance | Execution Window |
|---|---|---|---|
| Private 5G Enterprise Planning | +2.1% | North America, Germany, Japan, Gulf states | Medium term (2 to 4 years) |
| Non-Terrestrial Network Integration | +1.6% | Global, led by North America and Europe | Long term (4 years or more) |
| 6G and ISAC Pre-Planning Tools | +1.0% | South Korea, Japan, China, United States | Long term (4 years or more) |
| rApp Marketplace Monetization | +0.9% | Europe, North America | Medium term (2 to 4 years) |
| Digital Twin Roll-Up Acquisitions | +0.7% | Global | Short term (2 years or less) |
Private 5G Enterprise Planning
This is still white space. Current planning tools are built for public carrier grids, while factories, ports, mines, and campuses mostly lack in-house RF capability. FCC CBRS licensing records show more than 200,000 CBRS devices deployed in the United States.
Germany’s Bundesnetzagentur has granted over 400 local 3.7–3.8 GHz licences, yet Ericsson and Nokia investor disclosures put private wireless customers at only about 1,000 to 2,500 each. That leaves a large share of enterprise demand untapped. Vendors that package simplified, per-site SaaS planning for systems integrators could lift gross margins from roughly 60% on carrier contracts to 75% to 80% on self-serve tiers.
Customer-acquisition cost per site could fall 40% to 50% through channel partners. Indoor design costs per square metre could also drop by an estimated 25% through automated digital-twin propagation modelling, as reflected in 3GPP Release 18 positioning enhancements.
Key Players Analysis
Tier 1 leaders include Ericsson, Nokia, Huawei, and ZTE. These firms bundle planning and optimization software with their radio equipment. Ericsson reported full-year 2025 net sales of SEK 236.7 billion. Its adjusted EBITA margin rose to 18.1% from 11.0%. Adjusted gross income grew to SEK 113.9 billion, despite a SEK 7.2 billion currency headwind.
Nokia reported 2025 net sales of EUR 19,889 million, up 3%. Its Mobile Networks unit earned EUR 7,806 million with a 2.8% segment operating margin. Nokia invested EUR 4,855 million in R&D in 2025, up 8% from EUR 4,512 million. It also posted free cash flow of EUR 1.5 billion.
Tier 2 challengers lead in test, assurance, and niche planning. Keysight and VIAVI grew their test portfolios through deals. VIAVI funded part of its Spirent business purchase with a new USD 600 million term loan due in 2032. In its SEC filing, VIAVI recorded USD 314.2 million of acquired intangible assets and USD 111.5 million of goodwill from the deal. Amdocs, TEOCO, Comarch, and Anritsu compete in OSS, analytics, and measurement.
Infovista, Forsk, Ranplan Wireless, and iBwave lead specialist RF planning and indoor design. These firms are privately held and do not publish segment revenue. Instead, they compete on propagation accuracy, indoor modeling, and cloud delivery for neutral host and private network buyers.
Top Key Players in the Market
- Telefonaktiebolaget LM Ericsson
- Nokia Corporation
- Huawei Technologies Co., Ltd.
- ZTE Corporation
- Infovista SAS
- TEOCO Corporation
- Forsk SAS
- Keysight Technologies, Inc.
- VIAVI Solutions Inc.
- Amdocs Limited
- Comarch S.A.
- Anritsu Corporation
- Ranplan Wireless Network Design Ltd.
- iBwave Solutions Inc.
Recent Developments
- In March 2025, VIAVI Solutions signed a deal to buy Spirent’s high-speed Ethernet and network security business from Keysight for USD 410 million in base cash plus USD 15 million in contingent cash.
- In August 2025, Ericsson completed the sale of iconectiv to Koch Equity Development, gaining a net cash benefit of about SEK 9.9 billion (USD 1.0 billion) and a one-off EBIT gain of about SEK 7.6 billion.
- In October 2025, Keysight Technologies completed its purchase of Spirent Communications for about GBP 1.16 billion (around USD 1.46 billion), paying 202.5 pence per share.
- In October 2025, NVIDIA agreed to invest USD 1 billion in Nokia at USD 6.01 per share to speed up AI-RAN products, and the deal closed in November 2025.
Report Scope
| Report Features | Description |
|---|---|
| Market Value (2025) | USD 3.4 Billion |
| Forecast Revenue (2035) | USD 17.2 Billion |
| CAGR (2026-2035) | 17.6% |
| Base Year for Estimation | 2025 |
| Historic Period | 2020-2024 |
| Forecast Period | 2026-2035 |
| Report Coverage | Revenue Forecast, Market Dynamics, Competitive Landscape, Recent Developments |
| Segments Covered | By Component (Software, Services); By Function (RAN Optimization, RAN Planning and Design, Performance Management, Capacity Planning, Coverage and Propagation Analysis, Interference Management, Other); By Deployment (On-premises, Cloud, Hybrid); By End User (Mobile Network Operators, Neutral Host and Private Network Operators, Enterprises, Government and Public Safety Organizations, Network Equipment Vendors and System Integrators) |
| Regional Analysis | North America – US, Canada; Europe – Germany, France, The UK, Spain, Italy, Rest of Europe; Asia Pacific – China, Japan, South Korea, India, Australia, Singapore, Rest of APAC; Latin America – Brazil, Mexico, Rest of Latin America; Middle East & Africa – GCC, South Africa, Rest of MEA |
| Competitive Landscape | Telefonaktiebolaget LM Ericsson, Nokia Corporation, Huawei Technologies Co., Ltd., ZTE Corporation, Infovista SAS, TEOCO Corporation, Forsk SAS, Keysight Technologies, Inc., VIAVI Solutions Inc., Amdocs Limited, Comarch S.A., Anritsu Corporation, Ranplan Wireless Network Design Ltd., iBwave Solutions Inc. |
| Customization Scope | Customization for segments and region/country-level will be provided. Moreover, additional customization can be done based on the requirements. |
| Purchase Options | We have three licenses to opt for: Single User License, Multi-User License (Up to 5 Users), Corporate Use License (Unlimited Users and Printable PDF) |