Report Overview
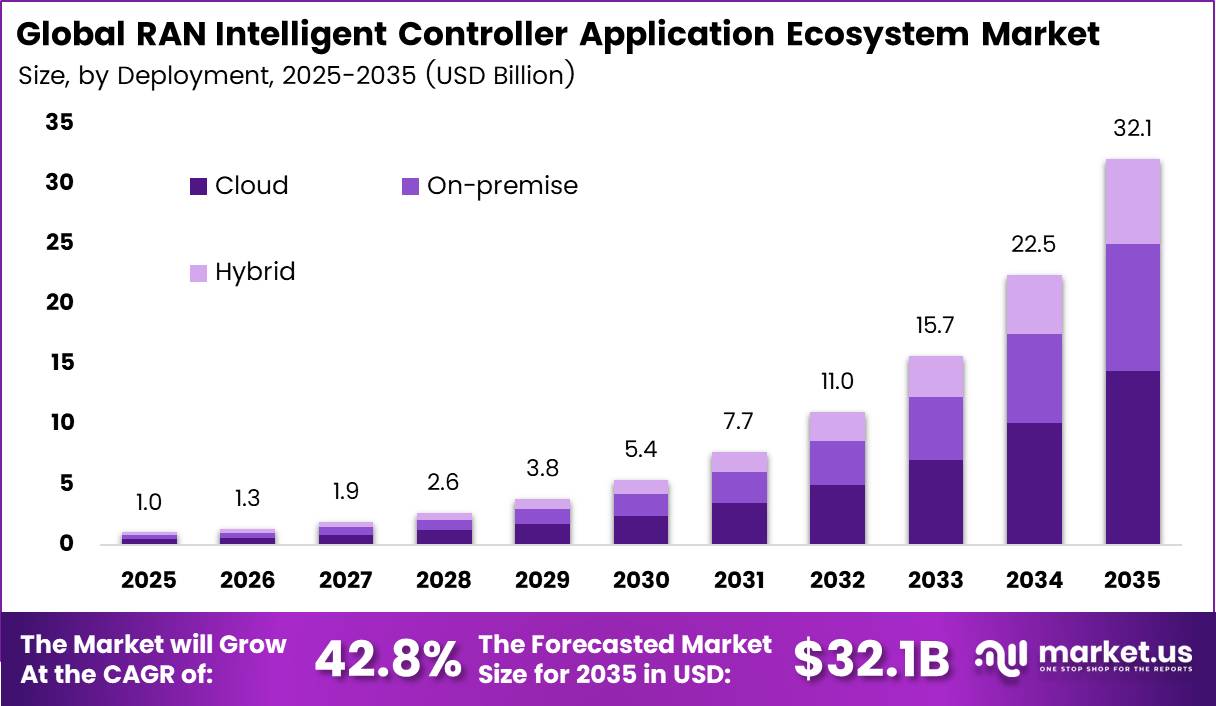
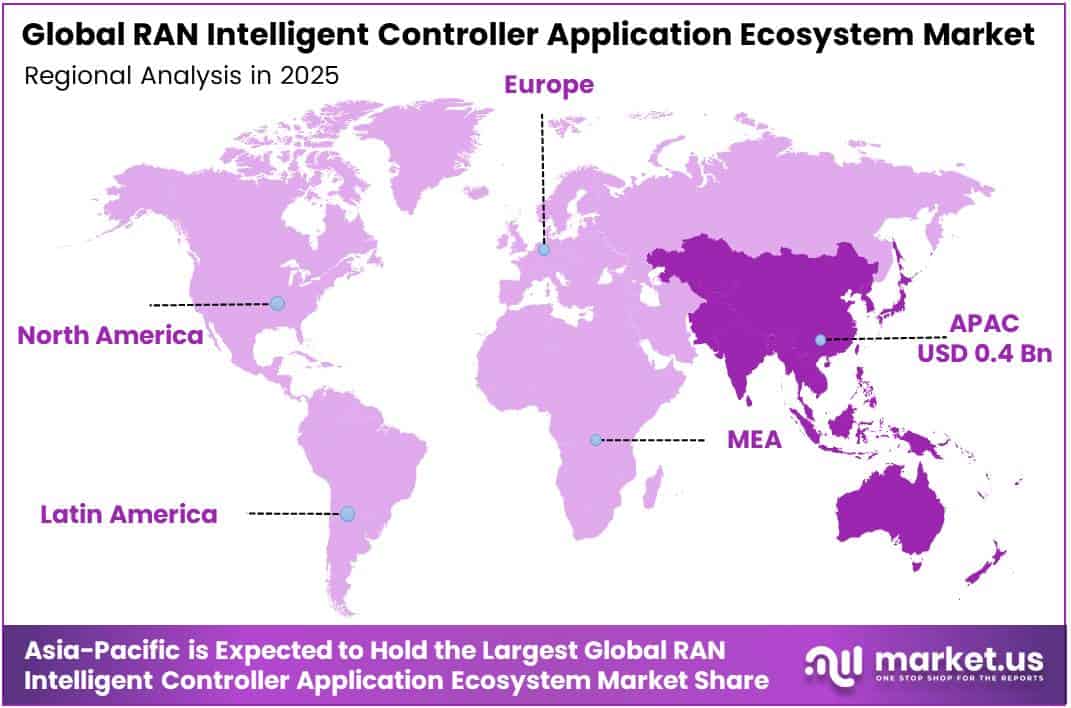
In 2025, the Global RAN Intelligent Controller Application Ecosystem Market was valued at USD 1.0 billion. The market is projected to grow at a CAGR of 42.8% during 2026–2035, reaching approximately USD 32.1 billion by 2035. North America dominated the global market in 2025, accounting for more than 37.9% of the total market share and generating approximately USD 0.4 billion in revenue.
Mobile operators drive this demand as they move from closed radio networks to open, software-led networks. The Ericsson Mobility Report shows that global 5G subscriptions came close to 2.9 billion at the end of 2025, after a gain of about 600 million in a single year.
Ericsson expects this base to reach 6.4 billion by 2031, which is about two-thirds of all mobile subscriptions, with 4.1 billion on 5G standalone. Standalone 5G needs smart, automated control of radio resources. RIC platforms host rApps and xApps that tune traffic, cut energy use, and predict faults across thousands of cell sites.
The Asia-Pacific region has the largest mobile user base in the world and adopts 5G quickly. Ericsson data shows that India alone had 430 million 5G subscriptions at the end of 2025, or 35% of its mobile base, and is expected to reach 1.1 billion by 2031. North East Asia reached 60% 5G penetration in 2025. Japanese operators run some of the largest open and virtual RAN builds in the world.
Key Takeaways
- The RAN Intelligent Controller Application Ecosystem Market stood at USD 1.0 billion in 2025 and will reach USD 32.1 billion by 2035. at a 42.8% CAGR from 2026 to 2035.
- By Component, Platforms lead with a 66.5% share.
- By Function, Non-real Time RIC leads with a 73.6% share.
- By Technology, 5G leads with a 76.9% share and is also the fastest-growing sub-segment.
- By Deployment, Cloud leads with a 45.9% share.
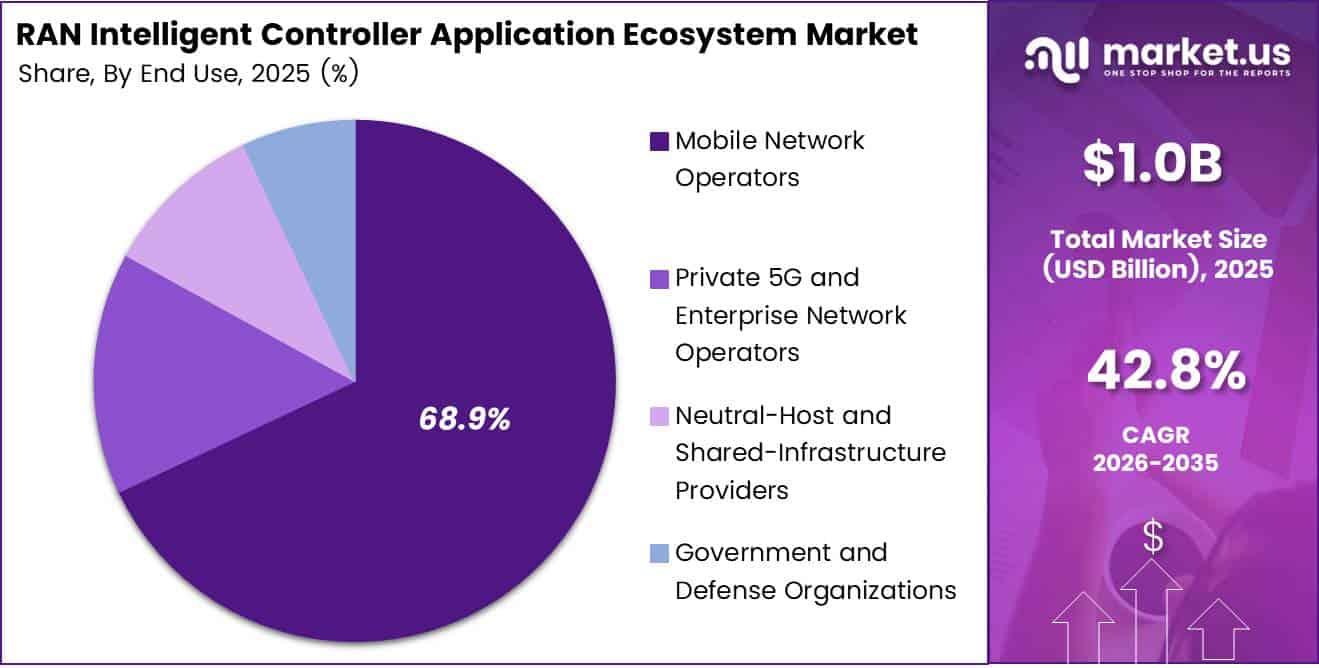
- By End User, Mobile Network Operators lead with a 68.9% share.
- Asia-Pacific leads with a 37.9% share and USD 0.4 billion in revenue.
By Component
Platforms dominate with 66.5% due to their essential role as the base for app hosting.
Platforms lead the market because every operator needs a stable base before it can run any rApp or xApp. A platform hosts the apps, links them to the radio network, and manages network data in one place. Ericsson counts 79 service providers with commercial 5G standalone networks.
Services grow fastest because operators are moving from small trials to live networks. Ericsson studied over 300 service providers across 134 markets and found a sharp rise in new commercial launches. Each launch needs help with app testing, system setup, and staff training. Many operators lack in-house AI skills, so they hire partners to design, deploy, and run apps.
By Function
Non-real-time RIC dominates with 73.6% due to policy control and AI training.
Non-real-time RIC holds the top share because it handles the big-picture work of running a network. It works on control loops longer than 1 second, so it can study past data, train AI models, and set network rules. Operators find this layer easier to adopt first, because it sits inside their existing management systems and causes little risk to live traffic.
Near-real-time RIC grows fastest because operators now want quicker, sharper control at the cell level. It works on loops between 10 milliseconds and 1 second, which lets xApps manage traffic steering, interference, and user handovers almost as they happen. The same O-RAN release added 1 new RAN Control xApp for end-to-end traffic steering.
By Technology
5G dominates with 76.9% due to rapid global standalone network rollouts.
5G leads the market because RIC apps work best on new, software-based networks. Global 5G subscriptions now stand close to 3.3 billion, and 5G carries about half of all mobile data traffic. Operators building these networks choose open, programmable designs from day one, which creates a natural home for rApps and xApps.
4G still serves many users, but its role is shrinking. In India, 4G subscriptions will fall from about 570 million in 2025 to nearly 160 million by 2031 as users move to 5G. Operators therefore put little new money into smart controls for older networks.
5G is also the fastest-growing segment, because user growth keeps pushing traffic and complexity higher. Ericsson expects 5G subscriptions to more than double to 6.4 billion by the end of 2031. More users, more devices, and more traffic mean that manual network tuning no longer works.
By Deployment
Cloud dominates with 45.9% due to scalable compute for AI workloads.
Cloud deployment leads because RIC apps need large, flexible computing power to train and run AI models. Mobile network data traffic rose 23% between Q2 2025 and Q2 2026. Cloud setups let operators add capacity quickly as this traffic grows, without buying new hardware for every site.
Cloud also fits the way operators now build their core networks. Ericsson forecasts that about 4.1 billion 5G subscriptions, or roughly 65% of the total, will run on standalone networks by 2031. These networks are cloud-native, so cloud-hosted RIC platforms plug into them easily.
Hybrid deployment grows fastest because operators want both cloud scale and local control. Time-sensitive xApps need to sit close to radio sites, while heavy AI training works better in central clouds. Hybrid models split the work between the two. New services drive this shift: around 70% of fixed wireless access providers now offer the service over 5G, and these services need low delay at the edge and smart planning in the cloud.
By End User
Mobile Network Operators dominate with 68.9% due to large national radio network ownership.
Mobile network operators hold the biggest share because they own and run the largest radio networks. They face the highest costs for energy, site tuning, and fault repair, so they gain the most from automation. Ericsson reports that operators added about 660 million 5G subscriptions worldwide in 2025 alone.
Mature markets show this clearly. North America reached 79% 5G subscription penetration, and its operators are among the earliest buyers of RIC platforms.
Private 5G and enterprise network operators grow fastest because factories, ports, and campuses now want networks tailored to their own needs. Ericsson found 57 business-to-business network slicing cases worldwide, led by public safety, logistics, defense, and general enterprise use. Of all tracked slicing offerings, 65 are already commercially available.
Key Market Segments
By Component
- Platforms
- Services
By Function
- Non-real Time RIC
- Near-real Time RIC
By Technology
- 4G
- 5G
- Others
By Deployment
- Cloud
- On-premise
- Hybrid
By End User
- Mobile Network Operators
- Private 5G and Enterprise Network Operators
- Neutral-Host and Shared-Infrastructure Providers
- Government and Defense Organizations
Geopolitical Impact Analysis
Trade tensions between the US and China now shape the cost of RIC hardware. RIC platforms run on servers, accelerators, and memory chips, and most of these parts come from Asian supply chains. The US raised Section 301 tariffs on Chinese semiconductors from 25% to 50% in 2025. This tariff increase pushes up the cost of edge servers and network cards used to host near-real-time RIC apps.
Shipping routes add more pressure. UNCTAD reported that tonnage through the Suez Canal was still 70% below 2023 levels in May 2025. Vessel rerouting pushed ton-miles up by a record 6% in 2024. Ships that go around the Cape of Good Hope add about 10 to 14 days to Asia-to-Europe transit. These delays slow the delivery of radio units and servers to European operators that are rolling out open RAN sites.
Global trade growth has also slowed. UNCTAD expects maritime trade to grow just 0.5% in 2025, down from 2.2% in 2024. UNCTAD also flags the Strait of Hormuz, which carries 11% of global trade, as a source of disruption risk. Higher freight and energy costs raise the landed cost of cell site hardware in the Gulf and South Asia.
Component prices remain volatile. Contract prices for DRAM and NAND flash rose 44% and 53% quarter-on-quarter in 2026, driven by demand from AI data centers. RIC vendors that rely on accelerated computing pay more for each server. At the same time, security bans on high-risk vendors push operators toward open, multi-vendor RAN, which raises demand for RIC software.
Regional Analysis
Asia Pacific dominates the RAN Intelligent Controller Application Ecosystem Market, holding a 37.9% share and generating USD 0.4 billion in revenue. The region combines large subscriber bases with early open RAN adoption. Japan leads in open, cloud-native networks. Rakuten Mobile had 10.75 million subscribers as of June 2026 on a fully virtualized network.
North America is the fastest-growing region in the RAN Intelligent Controller Application Ecosystem Market. The region had the highest 5G penetration in the world at 79% at the end of 2025. AT&T leads open RAN adoption in the US. The operator plans for 70% of its wireless traffic to run on open-capable platforms by late 2026.
AT&T may spend about USD 14 billion over the 5-year term of its contract with Ericsson. T-Mobile US plans AI-RAN field trials in 2026. Canada follows US trends, with operators testing automation apps across national networks.
Europe holds a strong position in the market, supported by operator alliances and policy work on open networks. Western Europe reached 54% 5G penetration at the end of 2025. Vodafone is looking at an open RAN overhaul across about 100,000 sites. Orange plans to expand its vRAN and open RAN sites with Samsung in 2026 after pilots that began in 2023.
Key Regions and Countries
North America
- US
- Canada
Europe
- Germany
- France
- The UK
- Spain
- Italy
- Rest of Europe
Asia Pacific
- China
- Japan
- South Korea
- India
- Australia
- Rest of APAC
Latin America
- Brazil
- Mexico
- Rest of Latin America
Middle East and Africa
- GCC
- South Africa
- Rest of MEA
Market Dynamics
Drivers
| Driver | (~) % Impact on CAGR Forecast | Geographic Relevance | Impact Timeline |
|---|---|---|---|
| Tier-1 Operator Open RAN Brownfield Rollouts | +4.2% | North America, Europe | Short term (2 years or less) |
| AI/ML-Driven RAN Energy Savings Apps | +3.1% | Europe, Asia Pacific | Short term (2 years or less) |
| O-RAN ALLIANCE Specification Maturity | +2.4% | Global | Medium term (2 to 4 years) |
| Government Vendor-Diversity Funding | +1.9% | United States, United Kingdom, Japan | Short term (2 years or less) |
| SMO Platform Adoption by Operators | +1.6% | North America, Asia Pacific | Medium term (2 to 4 years) |
| Cloud-Native vRAN Densification | +1.2% | Asia Pacific, Middle East | Medium term (2 to 4 years) |
Tier-1 Operator Open RAN Brownfield Rollouts
The biggest driver is the move by Tier-1 operators from small Open RAN trials to full brownfield contracts. AT&T’s disclosed program targets 70% of its wireless traffic running on open-capable platforms by late 2026, per AT&T investor communications.
The commercial milestone came in 2024, when AT&T awarded a multi-year contract worth about $14 billion, per AT&T and Ericsson corporate disclosures. Ericsson’s annual reports say the deal requires third-party rApp support on its SMO and Non-RT RIC stack. Deutsche Telekom, Vodafone and Telefónica back this through the O-RAN ALLIANCE and the operator MoU signed in 2021.
Vodafone’s investor materials target about 30% of its European sites for open sourcing by 2030. This changes how RAN software is sold. Revenue used to come bundled inside hardware licences. Now rApps and xApps are bought on their own as per-site or per-cell software subscriptions.
GSMA Intelligence operator surveys put RAN optimization opex savings at roughly 10% to 15%. That gives independent software vendors a low-cost way to sell, by certifying their apps on an incumbent’s SMO marketplace instead of signing direct operator contracts.
Restraints
| Restraint | (~) % Impact on CAGR Forecast | Geographic Relevance | Impact Timeline |
|---|---|---|---|
| Operator RAN CapEx Contraction | -3.6% | Global | Short term (2 years or less) |
| Single-Vendor Lock-In of Incumbent RAN | -2.7% | Europe, Asia Pacific | Medium term (2 to 4 years) |
| Restricted xApp Access to Near-RT Control Loops | -1.8% | Global | Medium term (2 to 4 years) |
| Elevated Cost of Capital for ISVs | -1.4% | North America, Europe | Short term (2 years or less) |
| National Security Procurement Exclusions | -1.1% | China, United States, EU | Long term (4 years or more) |
Operator RAN CapEx Contraction
The biggest restraint is that operators are cutting RAN spending now that 5G coverage builds are finished. Global RAN equipment revenue fell by about 20% in 2023 and declined again in 2024, according to Ericsson and Nokia annual reports.
Nokia’s filings show its Mobile Networks net sales fell about 23% year on year in 2024 on a constant-currency basis. Operator capital intensity has dropped toward 15% to 17% of revenue, per GSMA mobile economy data. Average returns on invested capital are still below the cost of capital, as reflected in OECD telecom sector indicators.
Challenges
| Challenge | (~) % CAGR Friction Drag | Geographic Relevance | Mitigation Horizon |
|---|---|---|---|
| Multi-Vendor Integration and Testing Burden | -2.9% | Global | Medium term (2 to 4 years) |
| xApp Conflict Management Complexity | -1.7% | Global | Medium term (2 to 4 years) |
| RAN-AI Talent Shortage | -1.5% | North America, Europe, India | Long term (4 years or more) |
| Expanded Open Interface Attack Surface | -1.2% | United States, EU | Medium term (2 to 4 years) |
| Unproven rApp ROI Benchmarks | -0.9% | Global | Short term (2 years or less) |
Multi-Vendor Integration and Testing Burden
The biggest challenge is integration. A multi-vendor RIC deployment needs the O1, A1, and E2 interfaces to work across separate radio, DU/CU, and SMO suppliers, and the E2 service models are still changing between O-RAN ALLIANCE releases.
Integration and system-testing labour can account for 25% to 35% of total Open RAN deployment cost, according to European Commission and BEREC Open RAN assessments. That compares with 10% or less for single-vendor RAN. The O-RAN ALLIANCE itself has recognized only around 20 Open Testing and Integration Centres worldwide.
Each xApp needs regression testing against every new RAN software drop, which adds 3 to 6 months to certification cycles, per NTIA Public Wireless Supply Chain Innovation Fund program disclosures. Over the long term, vendors will need to invest in continuous-integration testbeds, automated conformance tooling and pre-certified app bundles. These raise R&D intensity toward 20% of revenue for smaller vendors.
Opportunities
| Opportunity | (~) % Potential CAGR Upside | Geographic Relevance | Execution Window |
|---|---|---|---|
| Private 5G and Enterprise RIC Apps | +2.8% | North America, Europe, Japan | Medium term (2 to 4 years) |
| Network Slicing Monetization rApps | +2.1% | Global | Medium term (2 to 4 years) |
| 6G AI-Native RAN Pre-Positioning | +1.6% | Asia Pacific, North America | Long term (4 years or more) |
| Emerging-Market Greenfield Open RAN | +1.3% | India, Southeast Asia, Africa | Long term (4 years or more) |
| ISV Consolidation and App Store Roll-Ups | +0.9% | North America, Europe | Short term (2 years or less) |
Private 5G and Enterprise RIC Apps
The biggest opportunity is private 5G networks for enterprises. This is still white space: today’s RIC revenue comes almost entirely from public-network operators, and private 5G sites run monolithic small-cell stacks with little programmable control. Industrial wireless adoption is growing in manufacturing, ports and mining, per 5G-ACIA and GSA private network tracking.
Germany’s BNetzA has allocated over 300 local 3.7–3.8 GHz licences, according to regulator records. The FCC’s CBRS framework has enabled hundreds of thousands of registered devices, per FCC and WInnForum data. Selling RIC apps for deterministic latency, interference control and uplink-heavy video analytics would add an enterprise layer billed per site or per use case.
Enterprise software gross margins of about 75% to 80%, typical in software-company annual reports, could replace operator contracts with margins near 55%. Bundled apps could also cut enterprise network operating cost per site by an estimated 15% to 20%.
Key Players Analysis
Tier 1 leaders include Ericsson, Nokia, and Samsung, which combine RAN hardware, software, and global operator ties. Ericsson reported net sales of SEK 236.7 billion in FY2025 and spent about SEK 48.2 billion on R&D, or roughly 20.4% of revenue. Its net income rose to SEK 28.7 billion, and its Cloud Software and Services sales grew 12% in the fourth quarter.
Nokia posted FY2025 net sales of EUR 19.9 billion and raised R&D spending by 8% to EUR 4.9 billion. The company delivered a comparable operating profit of EUR 2.0 billion and free cash flow of EUR 1.5 billion. Mobile Networks sales stayed flat for the year but grew 6% in the fourth quarter.
Samsung Electronics spent a record KRW 37.7 trillion (about USD 25.7 billion) on R&D in 2025, up 7.8% from the prior year. Its network sales fell to about KRW 400 billion (USD 300 million) in the third quarter of 2026, down from about KRW 600 billion a year earlier. NEC and Fujitsu also hold Tier 1 positions through radio supply for Japanese and US open RAN builds.
Tier 2 challengers focus on software and niche markets. Mavenir serves more than 300 operators in over 120 countries, reaching more than 50% of the world’s subscribers. Rakuten Symphony has tested and deployed across 22 hardware types in fully multi-vendor networks. Parallel Wireless, Airspan, JMA Wireless, Radisys, and Celona target private 5G and neutral-host networks, but they publish limited financial data.
Top Key Players in the Market
- Mavenir Systems, Inc.
- Parallel Wireless, Inc.
- Rakuten Symphony, Inc.
- Samsung Electronics Co., Ltd.
- Nokia Corporation
- Telefonaktiebolaget LM Ericsson
- NEC Corporation
- Fujitsu Limited
- Airspan Networks Inc.
- JMA Wireless, Inc.
- Radisys Corporation
- Celona Inc.
Recent Developments
- In January 2025, Samsung Electronics disclosed planned capital expenditure of about KRW 52.7 trillion for 2025, including KRW 47.5 trillion for its Device Solutions division to upgrade lines and move to advanced processes.
- In February 2025, Nokia Corporation completed its acquisition of Infinera at USD 6.65 per share, an enterprise value of about USD 2.3 billion, and targets over EUR 200 million in operating profit synergies by 2027.
- In July 2025, Mavenir Systems completed a recapitalization that eliminated more than USD 1.3 billion of debt and secured USD 300 million of new senior financing to focus on 4G and 5G open RAN software.
- In October 2025, NVIDIA agreed to invest USD 1 billion in Nokia Corporation at USD 6.01 per share for a 2.9% stake to speed up AI-RAN products for 5G-Advanced and 6G.
- In July 2026, Rakuten Symphony received a subsidy of up to JPY 350 million (USD 2.14 million) from Japan’s METI for a JPY 710 million virtualized open RAN project in Ukraine.
Report Scope
| Report Features | Description |
|---|---|
| Market Value (2025) | USD 1.0 Billion |
| Forecast Revenue (2035) | USD 32.1 Billion |
| CAGR (2026-2035) | 42.8% |
| Base Year for Estimation | 2025 |
| Historic Period | 2020-2024 |
| Forecast Period | 2026-2035 |
| Report Coverage | Revenue Forecast, Market Dynamics, Competitive Landscape, Recent Developments |
| Segments Covered | By Component (Platforms, Services); By Function (Non-real Time RIC, Near-real Time RIC); By Technology (4G, 5G, Others); By Deployment (Cloud, On-premises, Hybrid); By End User (Mobile Network Operators, Private 5G and Enterprise Network Operators, Neutral-Host and Shared-Infrastructure Providers, Government and Defense Organizations) |
| Regional Analysis | North America – US, Canada; Europe – Germany, France, The UK, Spain, Italy, Rest of Europe; Asia Pacific – China, Japan, South Korea, India, Australia, Singapore, Rest of APAC; Latin America – Brazil, Mexico, Rest of Latin America; Middle East & Africa – GCC, South Africa, Rest of MEA |
| Competitive Landscape | Mavenir Systems, Inc., Parallel Wireless, Inc., Rakuten Symphony, Inc., Samsung Electronics Co., Ltd., Nokia Corporation, Telefonaktiebolaget LM Ericsson, NEC Corporation, Fujitsu Limited, Airspan Networks Inc., JMA Wireless, Inc., Radisys Corporation, Celona Inc. |
| Customization Scope | Customization for segments, region/country-level will be provided. Moreover, additional customization can be done based on the requirements. |
| Purchase Options | We have three licenses to opt for: Single User License, Multi-User License (Up to 5 Users), Corporate Use License (Unlimited Users and Printable PDF) |