
Quick Navigation
Report Overview
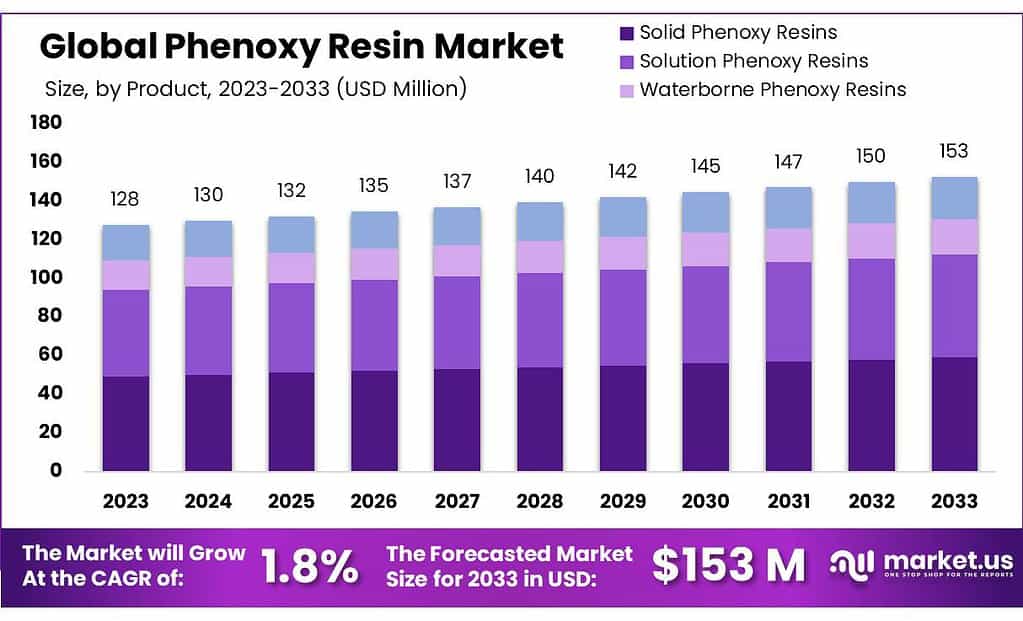
The global Phenoxy Resin market size is expected to be worth around USD 153 Million by 2033, from USD 128 Million in 2023, growing at a CAGR of 1.8% during the forecast period from 2023 to 2033.
The Phenoxy Resin market encompasses the global industry and commerce surrounding the production, distribution, and application of Phenoxy Resins, a class of thermoplastic polymers renowned for their ductility, high tensile strength, and resistance to chemicals and moisture. These properties render Phenoxy resin ideal for a wide array of applications, including protective coatings, adhesives, and composites across industries such as automotive, aerospace, electronics, and consumer goods.
The market is characterized by its size, which is quantified by revenue and volume and is influenced by factors such as technological advancements, regulatory environments, and shifts in demand across different sectors. Market analysis typically includes insights into growth trends, segmentation by product type and application, competitive landscape, and regional dynamics. Understanding the Phenoxy Resin market is crucial for stakeholders involved in manufacturing, distributing, or utilizing these polymers, as it provides a comprehensive overview of the market’s current state and prospects.
Key Takeaways
- Market Growth: Phenoxy Resin market is projected to reach USD 153 million by 2033, with a CAGR of 1.8% from 2023.
- Leading Segment: Solid Phenoxy Resins dominate with 41.5% market share in 2024, favored for coatings and adhesives.
- Major End-Use: Automotive sector holds over 45.4% market share in 2024, driven by demand for durable coatings.
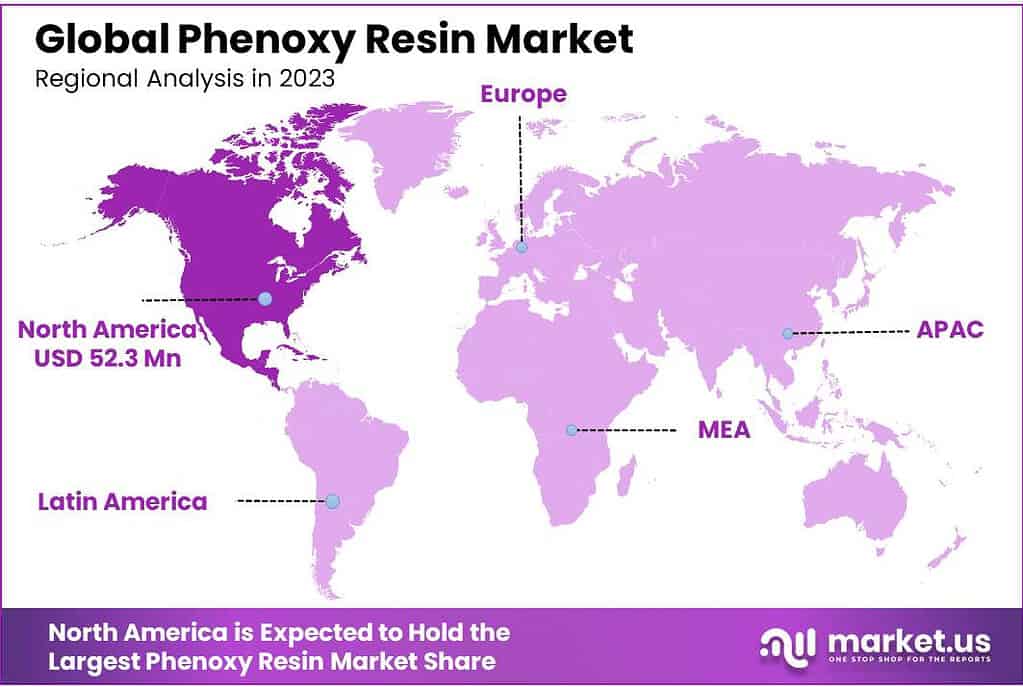
- Regional Dominance: North America leads globally, commanding a significant 38.4% market share in 2024.
- Phenoxy resins can have a limiting oxygen index (LOI) of 25-30%, indicating good flame resistance.
- Phenoxy resins can have a melt viscosity range of 1000 to 10,000 Pa·s at processing temperatures.
By Type
In 2024, Solid Phenoxy Resins held a dominant market position, capturing more than a 41.5% share. Solid phenoxy resins are widely used in coatings, adhesives, and sealants due to their excellent mechanical properties, chemical resistance, and adhesion characteristics. They are preferred for applications requiring high-performance coatings with enhanced durability and weather resistance.
Solution Phenoxy Resins, another significant segment, accounted for a substantial market share. These resins are typically dissolved in solvents to form clear, high-gloss coatings and are commonly used in applications such as printing inks, varnishes, and wood coatings.
Waterborne Phenoxy Resins, on the other hand, are gaining traction due to their environmentally friendly nature and low volatile organic compound (VOC) content, making them suitable for coatings and adhesives in industries with strict environmental regulations. Other segments may include specialty formulations tailored to specific applications, although they hold a smaller market share compared to Solid, Solution, and Waterborne Phenoxy Resins.
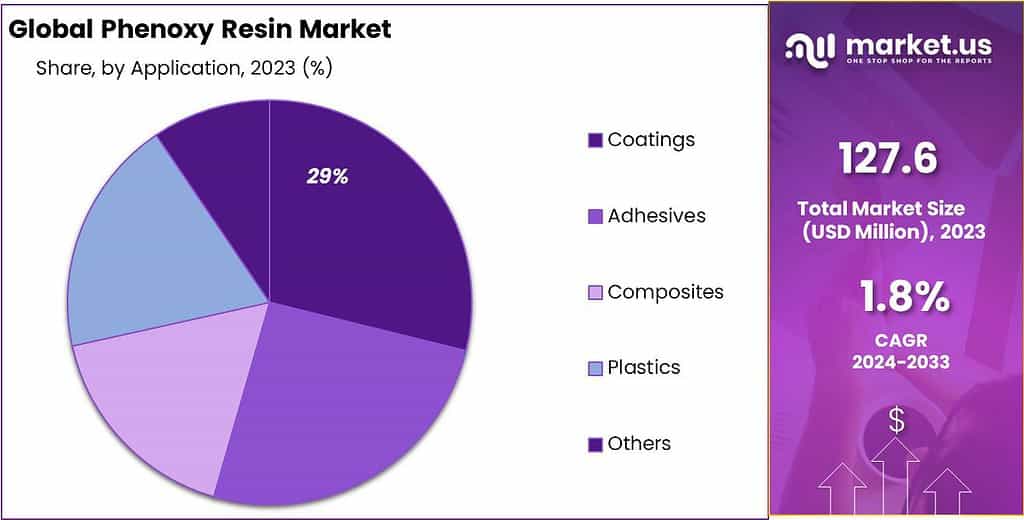
By Application
In 2024, Solid Coatings held a dominant market position, capturing more than a 30.4% share. Solid coatings made with phenoxy resin are extensively used in various industries for their excellent adhesion, chemical resistance, and durability. They are commonly applied in automotive, aerospace, and marine sectors for protective coatings on metal surfaces.
Adhesives emerged as another significant segment, accounting for a substantial market share. Phenoxy resin-based adhesives offer strong bonding properties and are widely utilized in construction, woodworking, and electronics assembly applications. Composites, which include reinforced materials such as fiberglass or carbon fiber embedded in a phenoxy resin matrix, are gaining popularity in industries like aerospace and sports equipment manufacturing due to their lightweight and high-strength characteristics.
Plastics, although a smaller segment, utilize phenoxy resin as a toughening agent or modifier to enhance impact resistance and flexibility in various plastic products. Other applications of phenoxy resin include printing inks, textiles, and electrical insulation materials, catering to specific industry needs and requirements.
By End-Use Industry
In 2024, Automotive held a dominant market position, capturing more than a 45.4% share. Phenoxy resins are extensively utilized in automotive applications for their exceptional properties such as impact resistance, chemical resistance, and adhesion. They are commonly used in coatings for automotive body panels, adhesives for bonding components, and composites for lightweight structural parts.
Electronics emerged as another significant segment, accounting for a substantial market share. Phenoxy resins are employed in electronic encapsulation, potting compounds, and conformal coatings due to their excellent electrical insulation properties and thermal stability. Construction is also a significant end-use industry for phenoxy resins, which they are used in coatings for architectural surfaces, adhesives for bonding construction materials, and sealants for waterproofing applications.
Aerospace is another key segment, where phenoxy resins are utilized in composite materials for aircraft components, adhesives for structural bonding, and coatings for aerospace surfaces. Other industries such as marine, medical, and consumer goods also utilize phenoxy resins for various applications, highlighting the versatility and wide-ranging applicability of these materials.
Key Market Segments
By Type
- Solid Phenoxy Resins
- Solution Phenoxy Resins
- Waterborne Phenoxy Resins
- Others
By Application
- Coatings
- Adhesives
- Composites
- Plastics
- Others
By End-Use Industry
- Automotive
- Electronics
- Construction
- Aerospace
- Others
Driving Factors
Increasing Demand for High-Performance Coatings and Adhesives Drives Phenoxy Resin Market Growth
The growing demand for high-performance coatings and adhesives emerges as a significant driver propelling the Phenoxy Resin Market forward. Phenoxy resins, known for their excellent adhesion, chemical resistance, and durability, have become indispensable in various industries where stringent performance requirements are essential.
One major driver fueling the demand for phenoxy resins is the expanding construction industry. As urbanization accelerates worldwide, there is a rising need for durable coatings and adhesives to protect and enhance architectural structures. Phenoxy resin-based coatings offer superior weather resistance, corrosion protection, and aesthetic appeal, making them ideal for applications such as architectural paints, concrete sealers, and waterproofing membranes.
Additionally, the automotive sector plays a crucial role in driving the demand for phenoxy resins. With the automotive industry continually innovating to meet consumer demands for safer, lighter, and more fuel-efficient vehicles, there is a growing need for advanced materials that can withstand harsh environmental conditions and provide superior performance.
Phenoxy resin-based coatings and adhesives are widely used in automotive manufacturing for applications such as automotive body coatings, structural adhesives, and composite materials. These materials offer excellent impact resistance, chemical resistance, and adhesion properties, contributing to the durability and longevity of automotive components.
Furthermore, the electronics industry represents another significant driver for the Phenoxy Resin Market. With the proliferation of electronic devices and advancements in technology, there is a growing demand for high-performance materials that can provide electrical insulation, thermal stability, and protection against moisture and contaminants.
Phenoxy resins are commonly used in electronic encapsulation, potting compounds, and conformal coatings due to their excellent dielectric properties and resistance to heat and chemicals. As the demand for electronic devices continues to rise, fueled by trends such as IoT (Internet of Things) and smart devices, the demand for phenoxy resin-based materials is expected to increase significantly.
Restraining Factors
Environmental Regulations and Concerns Pose Challenges for Phenoxy Resin Market Growth
One major restraining factor impacting the Phenoxy Resin Market is the stringent environmental regulations and growing environmental concerns. As governments worldwide intensify efforts to combat climate change and reduce environmental pollution, industries are facing increased pressure to adopt sustainable practices and minimize their environmental footprint. Phenoxy resins, like many chemical compounds, can pose environmental risks during production, use, and disposal, raising concerns among regulators and environmental advocates.
One significant challenge for the Phenoxy Resin Market is the regulation of volatile organic compounds (VOCs), which are emitted during the manufacturing and application of coatings and adhesives. VOCs contribute to air pollution and can have harmful effects on human health and the environment.
As a result, regulatory agencies impose strict limits on VOC emissions, forcing manufacturers to develop low-VOC or VOC-free formulations for coatings and adhesives. While some phenoxy resin-based products meet these regulatory requirements, the development of environmentally friendly formulations often entails increased production costs and may compromise certain performance characteristics, posing challenges for market growth.
Additionally, concerns regarding the environmental impact of chemical waste generated during the production and disposal of phenoxy resin-based products present another restraining factor for the market. The disposal of unused or waste phenoxy resin products can lead to contamination of soil, water, and ecosystems, posing risks to wildlife and human health.
Moreover, the energy-intensive manufacturing processes involved in producing phenoxy resins may contribute to greenhouse gas emissions and other environmental impacts, further exacerbating sustainability concerns.
Opportunity
Increasing Demand for Waterborne Phenoxy Resins Presents Growth Opportunity for Phenoxy Resin Market
One major opportunity for the Phenoxy Resin Market lies in the increasing demand for waterborne phenoxy resins. Waterborne coatings and adhesives have gained traction in recent years due to their environmental friendliness, low VOC emissions, and ease of application. Waterborne phenoxy resins offer similar performance characteristics as solvent-based counterparts but with the added benefits of reduced environmental impact and improved workplace safety.
The growing awareness of environmental issues and tightening regulations on VOC emissions have led to a shift towards water-based formulations across various industries, including coatings, adhesives, and sealants. As a result, there is a rising demand for waterborne alternatives to traditional solvent-based phenoxy resins. Manufacturers are increasingly focusing on developing innovative waterborne formulations that meet performance requirements while addressing environmental concerns, creating new growth opportunities in the Phenoxy Resin Market.
One significant advantage of waterborne phenoxy resins is their versatility and compatibility with a wide range of substrates and additives, making them suitable for diverse applications. They can be used in architectural coatings, automotive coatings, industrial coatings, wood coatings, and adhesives, among others. Additionally, waterborne phenoxy resins offer excellent adhesion, chemical resistance, and durability, making them ideal for demanding applications where performance is critical.
Furthermore, the adoption of waterborne phenoxy resins aligns with the growing trend towards sustainable and eco-friendly products in the market. Manufacturers and end-users are increasingly prioritizing sustainability and seeking alternatives to traditional solvent-based coatings and adhesives. Waterborne phenoxy resins offer a sustainable solution by reducing VOC emissions, minimizing environmental impact, and improving indoor air quality, thereby meeting the growing demand for environmentally friendly materials.
Trending Factors
Growing Adoption of Phenoxy Resins in 3D Printing Industry Drives Market Growth
One major trending factor influencing the Phenoxy Resin Market is the growing adoption of phenoxy resins in the 3D printing industry. 3D printing, also known as additive manufacturing, has witnessed rapid growth in recent years across various sectors, including aerospace, automotive, healthcare, and consumer goods. Phenoxy resins, with their excellent mechanical properties, chemical resistance, and thermal stability, have emerged as promising materials for 3D printing applications, particularly in the production of functional prototypes, tooling, and end-use parts.
One key driver behind the increasing use of phenoxy resins in 3D printing is their ability to produce high-quality parts with intricate geometries and fine details. Phenoxy resins exhibit low shrinkage and excellent dimensional stability during the printing process, resulting in precise and accurate parts with smooth surface finishes. This makes them suitable for applications requiring tight tolerances and intricate designs, such as aerospace components, medical devices, and consumer electronics.
Moreover, phenoxy resins offer superior mechanical properties compared to traditional 3D printing materials such as thermoplastics and photopolymers. They possess high tensile strength, impact resistance, and thermal stability, making them ideal for applications that require durable and robust parts. Additionally, phenoxy resins can be formulated to exhibit specific properties, such as flexibility, hardness, or transparency, to meet the diverse requirements of different applications in the 3D printing industry.
Another factor driving the adoption of phenoxy resins in 3D printing is their compatibility with a variety of printing technologies, including stereolithography (SLA), digital light processing (DLP), and inkjet printing. Phenoxy resins can be formulated to cure rapidly under UV light or other curing methods used in these printing processes, enabling efficient and high-speed production of 3D printed parts. Furthermore, advancements in additive manufacturing technologies, such as improved printing resolutions, faster printing speeds, and expanded material capabilities, have further facilitated the use of phenoxy resins in 3D printing applications.
The 3D printing industry’s shift towards using phenoxy resins aligns with the growing demand for functional and production-grade parts with superior performance characteristics. As industries continue to adopt 3D printing for prototyping, rapid manufacturing, and customization, the demand for high-performance materials like phenoxy resins is expected to surge. Manufacturers of phenoxy resins are investing in research and development to further enhance their formulations and cater to the evolving needs of the 3D printing market, thereby driving growth and innovation in the Phenoxy Resin Market.
Regional Analysis
North America stands out as the leading market globally for Phenoxy Resin supplements.
In 2024, North America commanded a significant share of 38.4% in the global Phenoxy Resin supplement market. This dominance is primarily attributed to the widespread ownership of pets in North America, particularly in the United States, which drives substantial demand for pet-related products, including supplements.
Moreover, North America boasts a substantial network of veterinarians and pet healthcare facilities. This extensive infrastructure provides pet owners with ample opportunities to seek professional advice regarding suitable supplements for their pets’ needs. Consequently, companies specializing in Phenoxy Resin supplements for pets in North America dedicate considerable resources to research and development endeavors. Their goal is to ensure the formulation and production of high-quality, effective products tailored to meet the specific requirements of pet health and wellness.
The emphasis on research and development underscores a commitment to innovation and product excellence in the North American market. As a result, consumers can trust the reliability and efficacy of Phenoxy Resin supplements for their pets, driving sustained demand and market growth in the region.
Key Regions and Countries
- North America
- The US
- Canada
- Europe
- Germany
- France
- The UK
- Spain
- Italy
- Russia & CIS
- Rest of Europe
- APAC
- China
- Japan
- South Korea
- India
- ASEAN
- Rest of APAC
- Latin America
- Brazil
- Mexico
- Rest of Latin America
- Middle East & Africa
- GCC
- South Africa
- Rest of MEA
Key Players Analysis
The Phenoxy Resin Market is characterized by the presence of several key players who contribute significantly to its growth and development. Among these players, notable companies include Mitsubishi Chemical Corporation, Gabriel Performance Products, DIC Corporation, Shin-A Chemical, and InChem Corporation.
Market Key Players
- DIC
- Gabriel Performance Products
- Georgia-Pacific (GP) Chemicals
- Hexion
- KUKDO Chemical (Kunshan) Co.Ltd.
- Merck & Co.Inc.
- Mitsubishi Chemical
- Nippon Steel & Sumitomo Metal Corporation
- SHIN-A T&C
Recent Developments
- In 2023, DIC announced the development of a new range of sustainable phenoxy resin formulations aimed at reducing environmental impact while maintaining high performance standards.
- In 2024, Hexion launched a new line of waterborne phenoxy resin formulations tailored for environmentally friendly coatings and adhesives applications, aligning with the industry’s sustainability goals.
Report Scope
| Report Features | Description |
|---|---|
| Market Value (2023) | USD 128 Mn |
| Forecast Revenue (2033) | USD 153 Mn |
| CAGR (2023-2033) | 1.8% |
| Base Year for Estimation | 2023 |
| Historic Period | 2018-2023 |
| Forecast Period | 2024-2033 |
| Report Coverage | Revenue Forecast, Market Dynamics, COVID-19 Impact, Competitive Landscape, Recent Developments |
| Segments Covered | By Type(Solid Phenoxy Resins, Solution Phenoxy Resins, Waterborne Phenoxy Resins, Others), By Application(Coatings, Adhesives, Composites, Plastics, Others), By End-Use Industry(Automotive, Electronics, Construction, Aerospace, Others) |
| Regional Analysis | North America – The US & Canada; Europe – Germany, France, The UK, Spain, Italy, Russia & CIS, Rest of Europe; APAC– China, Japan, South Korea, India, ASEAN & Rest of APAC; Latin America– Brazil, Mexico & Rest of Latin America; Middle East & Africa– GCC, South Africa, & Rest of MEA |
| Competitive Landscape | DIC, Gabriel Performance Products, Georgia-Pacific (GP) Chemicals, Hexion, KUKDO Chemical (Kunshan) Co.Ltd., Merck & Co.Inc., Mitsubishi Chemical, Nippon Steel & Sumitomo Metal Corporation, SHIN-A T&C |
| Customization Scope | Customization for segments, region/country-level will be provided. Moreover, additional customization can be done based on the requirements. |
| Purchase Options | We have three licenses to opt for Single User License, Multi-User License (Up to 5 Users), Corporate Use License (Unlimited User and Printable PDF) |
Frequently Asked Questions (FAQ)
Phenoxy Resin market size is expected to be worth around USD 153 Million by 2033, from USD 128 Million in 2023
DIC, Gabriel Performance Products, Georgia-Pacific (GP) Chemicals, Hexion, KUKDO Chemical (Kunshan) Co.Ltd., Merck & Co.Inc., Mitsubishi Chemical, Nippon Steel & Sumitomo Metal Corporation, SHIN-A T&C


