


Report Overview
In 2024, the Global Pay Television and Internet Protocol Television Services Market was valued at USD 264.8 billion. The market is projected to grow at a CAGR of 3.9% during 2024–2034, reaching approximately USD 388.2 billion by 2034. Asia Pacific dominated the global market in 2024, accounting for 38.6% of the total market share and generating approximately USD 102.2 billion in revenue.
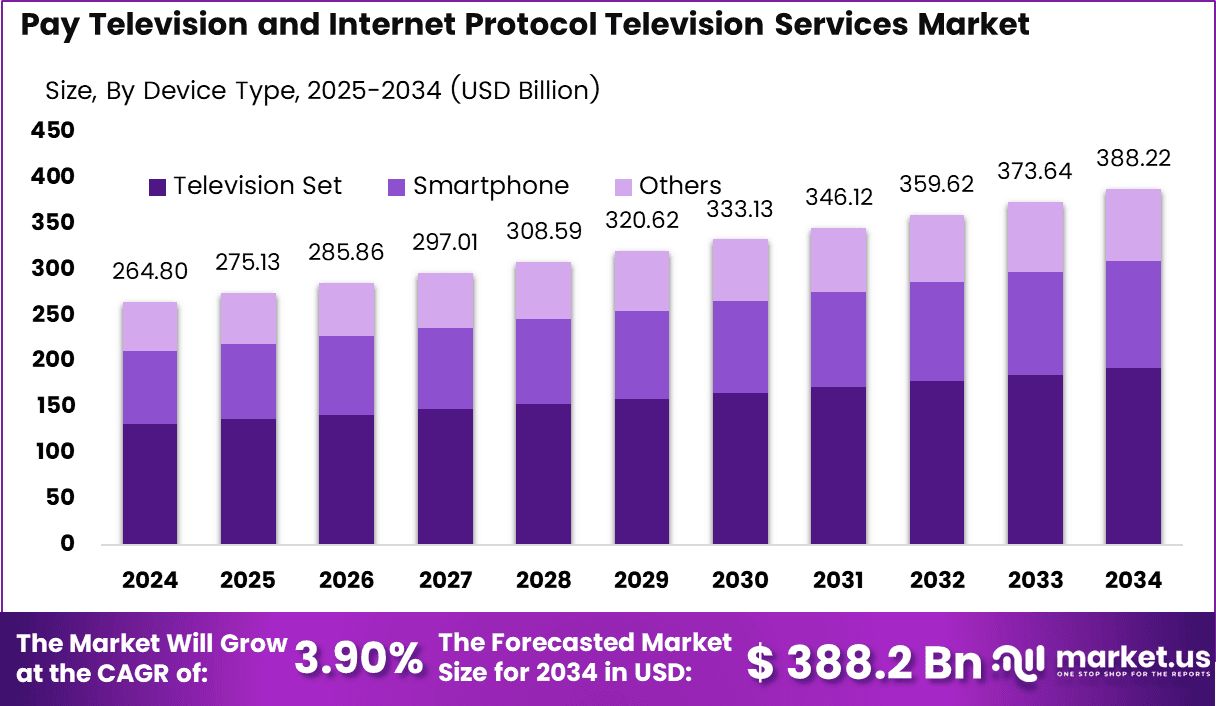
This rise is supported by rapid expansion of internet access: for example, India’s Ministry of Communications reports broadband connections increasing from 61 million in 2014 to roughly 949 million in 2024, a more than 14‑times jump, showing how many more homes and businesses can now receive digital TV and IPTV services.
The OECD notes that leading economies, including the U.S. and Canada, exceed 35 fixed broadband subscriptions per 100 people and over 100 mobile broadband subscriptions per 100 people, which means most households have multiple connected screens. As networks upgrade to fiber and 5G, operators can offer HD and 4K channels, cloud DVR, and on‑demand libraries, lifting average revenue per user and supporting steady global market expansion in both Pay TV and IPTV.
North America holds the largest regional IPTV share globally, with around 42–43% of the market in 2023–2025, supported by high broadband penetration and advanced digital infrastructure. This combination of high‑speed networks, strong OTT and content ecosystems, and willingness to pay for bundled TV–internet packages and exclusive sports and movie rights directly drives higher adoption of Pay TV and IPTV services, explaining why North America leads and why global revenues are set to increase by over USD 120 billion between 2024 and 2034.
Key Takeaways
- The Global Pay Television and Internet Protocol Television Services Market was valued at USD 264.8 billion in 2024.
- The global Pay Television and Internet Protocol Television Services Market is projected to grow at a CAGR of 3.9% and is estimated to reach USD 388.2 billion by 2034.
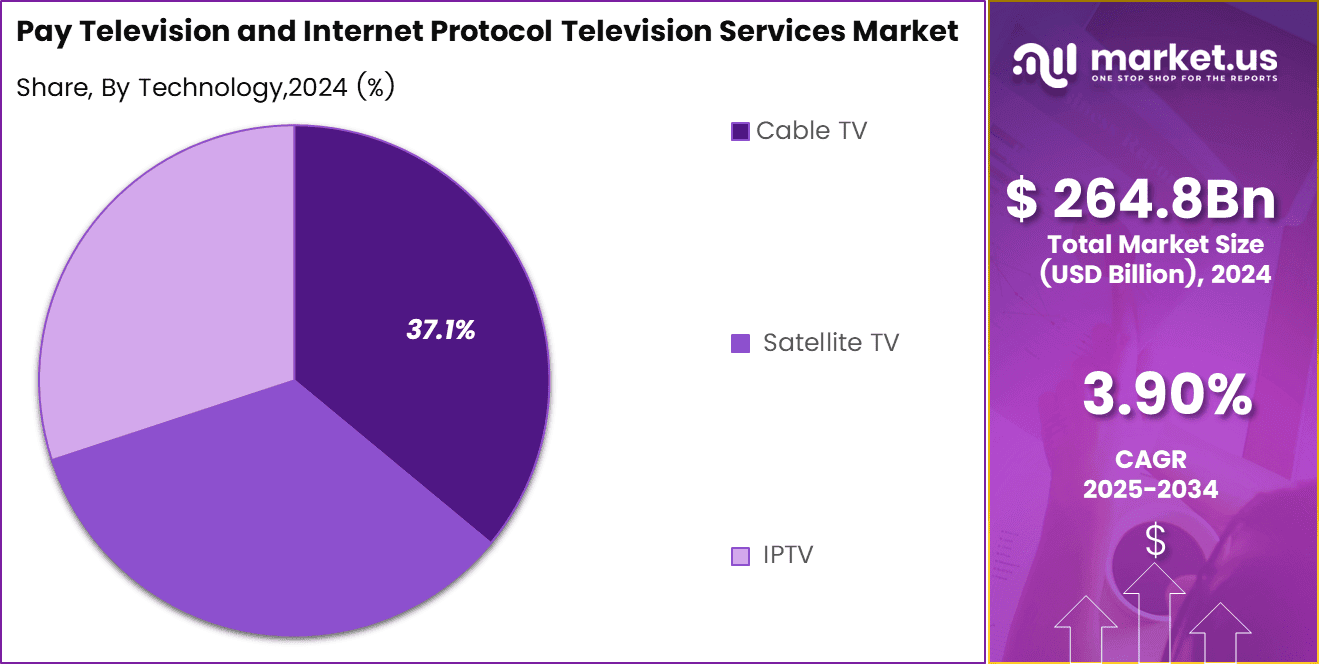
- On the basis of technology, the Cable TV segment dominated the market, accounting for 37.14% of the total market share.
- Based on device type, the Television Set segment dominated the market, accounting for 49.7% of the total market share.
- By application, the Residential segment dominated the market, accounting for 82.7% of the total market share.
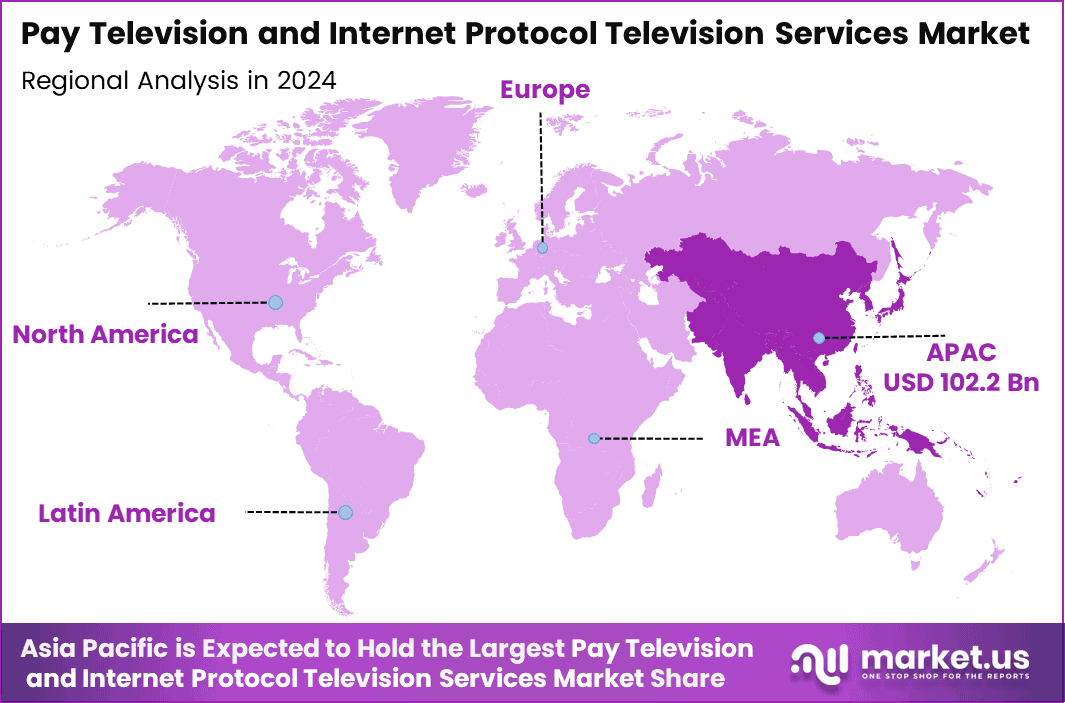
- In 2024, Asia Pacific was the most dominant region in the Pay Television and Internet Protocol Television Services Market, accounting for 38.6% of the total market share, equivalent to approximately USD 102.2 billion.
By Technology
Cable TV holds a significant share in the Pay Television and Internet Protocol Television Services Market, accounting for 37.14%. This technology continues to be popular due to its reliable service and extensive reach, especially in regions with established infrastructure.
Additionally, IPTV follows closely with a share of approximately 30.7%, reflecting the growing demand for internet-based television services that offer on-demand content and interactive features. Satellite TV, while still a major player, captures a smaller portion of the market at around 25.5%, as consumers increasingly opt for more flexible and internet-driven viewing solutions. These technologies are expected to evolve alongside digital transformation trends.
By Device Type
Television sets dominate the Pay Television and Internet Protocol Television Services Market, accounting for 49.7% of the market share. This continues to be the preferred device for consumers due to the larger screen size and immersive viewing experience it offers.
Smartphones follow closely with a significant share of approximately 35.2%, driven by the increasing trend of mobile content consumption, particularly for on-the-go streaming. Other devices, such as tablets and laptops, make up a smaller portion of the market, contributing around 15.1%. These devices are gaining traction as secondary options for content consumption, especially among younger audiences and digital natives.
By Application
The Residential sector dominates the Pay Television and Internet Protocol Television Services Market, capturing 82.7% of the market share. This is primarily driven by the increasing demand for home entertainment and on-demand content, with more consumers subscribing to IPTV and cable services for personal use.
The commercial sector, while still significant, accounts for a smaller share of approximately 17.3%. This segment includes businesses such as hotels, restaurants, and other commercial establishments that offer television services to their customers. However, the residential market remains the largest and continues to see substantial growth due to the rise in streaming services and smart home technologies.
Key Market Segment
By Technology
- Cable TV
- Satellite TV
- IPTV
By Device Type
- Television Set
- Smartphone
- Others
By Application
- Commercial
- Residential
Investment and Business Benefits
Investment in the Pay Television and IPTV sector involves allocating resources to technologies, infrastructure, and content to drive future growth. Investing in 5G technology, AI-driven content personalization, or expanding content libraries requires high upfront costs but offers long-term returns.
These investments typically result in a 10-20% increase in customer acquisition, market share, and engagement. By enhancing content delivery and customer experiences, businesses can boost customer loyalty and attract new subscribers.
Business benefits, on the other hand, refer to the tangible and intangible advantages a company gains from these investments or ongoing operations. In the IPTV sector, business benefits include improvements in customer loyalty, enhanced content delivery, cost reductions, and higher engagement.
For instance, after investing in AI tools for content recommendations, a company might see a 15% increase in subscriber retention and a 20% reduction in operational costs. These benefits help a company strengthen its competitive position, increase profitability, and ultimately ensure sustained success.
Regional Analysis
The global pay television and Internet Protocol Television (IPTV) services market is characterized by marked regional disparities in adoption, technology readiness, and revenue contribution. Asia Pacific emerges as both the dominating and fastest-growing region, accounting for approximately 38.6% of global market share, with an estimated market value of USD 102.2 billion.
This leadership is underpinned by rapid urbanization, expanding middle-class populations, and strong growth in broadband and fiber-to-the-home (FTTH) infrastructure across key markets such as China, India, Japan, and Southeast Asia.
Asia Pacific operators are aggressively leveraging IPTV platforms, localized content, multi-language libraries, and convergence of mobile and fixed networks to capture first-time digital TV subscribers and migrate analog households to digital and IP-based services.
China Market Size
The China Pay Television and Internet Protocol Television Services Market is projected to grow steadily from USD 32.7 billion in 2024 to USD 50.9 billion by 2034, with a CAGR of 4.52%. Reflecting robust demand for both traditional and internet-based television services in the region.
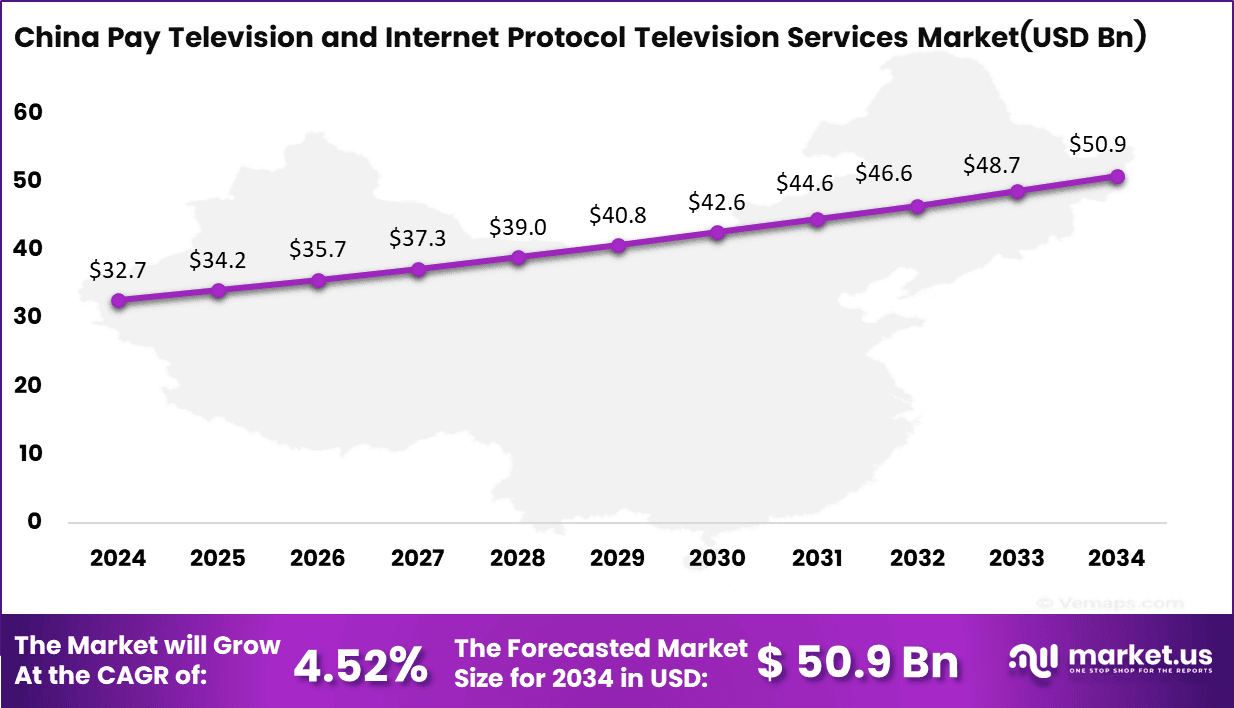
This growth is attributed to increasing internet penetration, rising disposable incomes, and the growing demand for high-quality on-demand streaming services. Additionally, advancements in 5G technology and the increasing adoption of smart devices contribute to enhanced viewing experiences, fueling market expansion.
Key Regions and Countries
- North America
- US
- Canada
- Europe
- Germany
- France
- The UK
- Spain
- Italy
- Rest of Europe
- Asia Pacific
- China
- Japan
- South Korea
- India
- Australia
- Rest of APAC
- Latin America
- Brazil
- Mexico
- Rest of Latin America
- Middle East & Africa
- GCC
- South Africa
- Rest of MEA
Drivers
| Driver | (~) % Impact on CAGR Forecast | Geographic Relevance | Impact Timeline |
|---|---|---|---|
| IPTV subscriber migration from legacy cable/satellite | +2.0% | Europe, North America, East Asia | Short term (≤ 2 years) |
| Bundled broadband–pay TV/IPTV offers | +1.0% | Asia-Pacific, Latin America, Middle East | Medium term (2–4 years) |
| Premium live sports and news rights | +0.8% | Global urban markets | Short term (≤ 2 years) |
| Network upgrades to fiber and high-speed access | +0.7% | Europe, North America, China, Gulf states | Medium term (2–4 years) |
| Regulatory support for platform parity in select markets | +0.4% | Taiwan, selected EU member states | Medium term (2–4 years) |
| Growth in HD/4K device penetration | +0.3% | Global, with concentration in developed markets | Long term (≥ 4 years) |
IPTV subscriber migration from legacy cable/satellite
The root driver is the steady shift of households from traditional cable and satellite packages into managed IPTV and hybrid pay-television offerings, with global IPTV subscriptions crossing approximately 300 million by 2024 and displacing a mid-single-digit percentage of legacy pay TV lines annually in markets such as Europe and East Asia.
This migration translates quantitatively into a stabilizing effect on total pay TV/IPTV revenues, as IPTV ARPU often remains within 5–15% of legacy bundles while churn rates improve by 2–3 percentage points due to on-demand features and multi-screen access, adding roughly +2.0% to the blended market CAGR versus a scenario of unmitigated cord-cutting.
Strategically, operators are re-architecting business models away from pure linear channel licensing towards vertically integrated IPTV platforms, reallocating content and technology opex so that software, CDN, and customer-premises equipment together form more than 40% of service delivery cost, while leveraging converged billing and Wi‑Fi router bundling to lower customer acquisition cost per household by around 10–20% compared with stand‑alone TV offers.
Restraints
| Restraint | (~) % Impact on CAGR Forecast | Geographic Relevance | Impact Timeline |
|---|---|---|---|
| Accelerating cord-cutting and linear subscriber erosion | -2.2% | North America, Western Europe | Short term (≤ 2 years) |
| High content rights inflation for premium channels | -1.1% | Global, concentrated in sports-heavy markets | Medium term (2–4 years) |
| Elevated interest rates constraining infrastructure CapEx | -0.7% | Emerging markets with FX and debt constraints | Short term (≤ 2 years) |
| Regulatory caps on tariff flexibility in select jurisdictions | -0.6% | India, selected regulated Asian markets | Short term (≤ 2 years) |
| Household budget reallocation to pure OTT streaming | -0.5% | Urban middle-income households globally | Medium term (2–4 years) |
Accelerating cord-cutting and linear subscriber erosion
The primary restraint is the structural decline in traditional linear pay TV households, with some mature markets reporting year-on-year subscriber drops of about 5–6% between 2023 and 2024, directly shrinking the base on which affiliate fees and advertising revenues are calculated.
Quantitatively, every 1% reduction in linear subscribers can erase roughly 1–1.5% of segment revenue when combined with lower linear viewing minutes, creating an effective drag of around -2.2% on the overall pay TV/IPTV CAGR relative to the 3.9% baseline, and pushing operating margins down by an estimated 2–4 percentage points as fixed network costs are spread over fewer video customers.
Strategically, this forces operators to delay or scale back video-specific CapEx (for example deferring upgrades to next-generation set-top boxes by 12–24 months or reducing channel line-ups by 10–20%), renegotiate minimum guarantees in carriage contracts, and pivot budget from linear programming to digital ad-tech and OTT aggregation, in some cases cutting linear content spend per household by more than 20% to defend free cash flow.
Challenges
| Challenge | (~) % CAGR Friction Drag | Geographic Relevance | Mitigation Horizon |
|---|---|---|---|
| Rising multi-platform content cost | -1.3% | Global, especially major media hubs | Medium term (2–4 years) |
| Complex content licensing across linear and IP | -1.0% | North America, Europe, advanced Asian markets | Medium term (2–4 years) |
| Talent and skills gap in cloud-native video operations | -0.8% | Global operators transitioning to IP delivery | Long term (≥ 4 years) |
| Fragmented device ecosystem and QoS management | -0.7% | Global, with higher impact in emerging markets | Medium term (2–4 years) |
| Advertising yield pressure amid audience shift | -0.6% | Markets with high brand advertising reliance | Short term (≤ 2 years) |
Rising multi-platform content cost
The structural vulnerability lies in the need to fund high-quality programming simultaneously for linear channels, IPTV services, and companion streaming platforms, with major media groups collectively committing around USD 120–130 billion annually to content creation by 2024, of which roughly 40–45% is original production that must be monetized across multiple windows.
This multi-platform spend drives quantitative friction because content amortization per subscriber rises as linear audiences decline and IP audiences fragment, pushing content cost per pay TV/IPTV household up by an estimated 10–20% over the 2022–2024 period and compressing EBITDA margins by around 2–3 percentage points, translating into a growth drag of about -1.3% on the market’s maximum attainable CAGR even where top-line revenues remain broadly stable.
Long term, operators must adjust corporate structures by centralizing rights management, renegotiating output deals to include cross-platform rights, and shifting scheduling and recommendation engines so that each additional dollar of content spend yields higher completion rates and lower churn; recommendation algorithms and cross-platform promotion can collectively account for more than 10% of total content-related opex to restore scalable growth without overextending balance sheets.
Opportunities
| Opportunity | (~) % Potential CAGR Upside | Geographic Relevance | Execution Window |
|---|---|---|---|
| Transition to super-aggregator IPTV platforms | +1.6% | Europe, North America, advanced Asia | Medium term (2–4 years) |
| Targeted advertising and data-driven monetization on IPTV | +1.3% | Global, especially markets with mature ad ecosystems | Short term (≤ 2 years) |
| Expansion into underserved rural broadband-TV bundles | +1.1% | Emerging markets, selected developed rural regions | Long term (≥ 4 years) |
| Cloud-based wholesale IPTV platforms for smaller ISPs | +0.9% | Global, with early traction in Europe and Asia | Medium term (2–4 years) |
| Hybrid broadcast–IP delivery for spectrum-efficient live events | +0.8% | Markets with strong terrestrial or satellite coverage | Long term (≥ 4 years) |
Transition to super-aggregator IPTV platforms
This upside is untapped because most pay TV/IPTV operators still distribute channels and a limited set of apps, rather than acting as full super-aggregators of multiple streaming and niche services within a unified interface, billing layer, and discovery engine, even though IP delivery and device penetration already support such models.
Quantitatively, moving to super-aggregation can raise average revenue per user by around 5–10% through incremental app subscriptions and transactional video while lowering effective customer acquisition cost per service by 15–25% via shared marketing and single sign-on, which together could add roughly +1.6% upside to the market CAGR above the 3.9% baseline if adopted at scale across major regions.
Strategically, this shifts unit economics: operators can aim for ad-supported tiers with video advertising margins in the 30–40% range, lower churn by 2–4 percentage points through personalized bundles, and reallocate up to 10–15% of legacy set-top and network CapEx into cloud-based aggregation platforms and recommendation systems, expanding contribution margin per household without materially increasing total capital intensity and capturing a meaningful portion of currently external OTT subscription spend.
Key Player Analysis
The pay television and IPTV market is led by U.S.-based companies, which control an estimated 45–50% of global managed pay TV/IPTV revenues. North America accounts for roughly 33–40% of global pay TV value in 2025. Comcast, Charter, AT&T/DIRECTV, and Verizon serve more than 70 million video subscriptions, while DIRECTV and DISH together capture about 50% of global satellite TV revenues.
Tier-1 operators including Comcast, Charter, AT&T/DIRECTV, DISH, Rostelecom, Foxtel, and Tata Play represent an estimated 55–65% of global pay TV/IPTV revenue. The global pay TV market was approximately $196–199 billion in 2025, while IPTV exceeded $56–58 billion, driven by managed IP platforms, cloud DVR, and OTT bundles.
Tier-2 players such as YouTube TV, fuboTV, Sling TV, Hulu + Live TV, and regional DTH operators are gaining share through flexible pricing, sports content, and streaming bundles. IPTV is projected to exceed $66 billion in 2026, with subscriptions accounting for more than 71% of IP video revenues.
Top Key Players
- Verizon
- Altice USANewparaCox Communications
- DAZN
- AT
- ESPN+
- YouTube TV
- Discovery+
- FuboTV
- Sling TV
- Dish Network
- Charter Communications
- Comcast
- beIN SPORTS
- Hulu
Recent Development
- In September 2024, DirecTV announced the acquisition of DISH Network and Sling TV from EchoStar through a debt-exchange transaction involving USD 1 cash plus assumed debt, creating a platform serving more than 20 million U.S. video subscribers.
- In April 2024, Comcast expanded its IP-video and broadband network, passing more than 60 million homes and businesses and supporting 32.3 million residential broadband customers. With annual capex of approximately USD 9–10 billion, the company increased network capacity and DOCSIS 4.0 deployment for IPTV, streaming, and cloud DVR services.
Report Scope
| Report Features | Description |
|---|---|
| Market Value (2024) | USD 264.8 Bn |
| Forecast Revenue (2034) | USD 388.2 Bn |
| CAGR(2025-2034) | 3.9% |
| Base Year for Estimation | 2024 |
| Historic Period | 2020-2023 |
| Forecast Period | 2025-2034 |
| Report Coverage | Revenue forecast, AI impact on Market trends, Share Insights, Company ranking, competitive landscape, Recent Developments, Market Dynamics, and Emerging Trends |
| Segments Covered | By Technology (Cable TV, Satellite TV, IPTV), By Device Type (Television Set, Smartphone, Others), By Application (Commercial, Residential) |
| Regional Analysis | North America – US, Canada; Europe – Germany, France, The UK, Spain, Italy, Russia, Netherlands, Rest of Europe; Asia Pacific – China, Japan, South Korea, India, New Zealand, Singapore, Thailand, Vietnam, Rest of Latin America; Latin America – Brazil, Mexico, Rest of Latin America; Middle East & Africa – South Africa, Saudi Arabia, UAE, Rest of MEA |
| Competitive Landscape | Verizon, Altice USANewparaCox Communications, DAZN, AT, ESPN+, YouTube TV, Discovery+, FuboTV, Sling TV, Dish Network, Charter Communications, Comcast, beIN SPORTS, Hulu, Others |
| Customization Scope | Customization for segments, region/country-level will be provided. Moreover, additional customization can be done based on the requirements. |
| Purchase Options | We have three licenses to choose from: Single User License, Multi-User License (Up to 5 Users), Corporate Use License (Unlimited Users, Printable PDF) |





























