
Quick Navigation
Report Overview
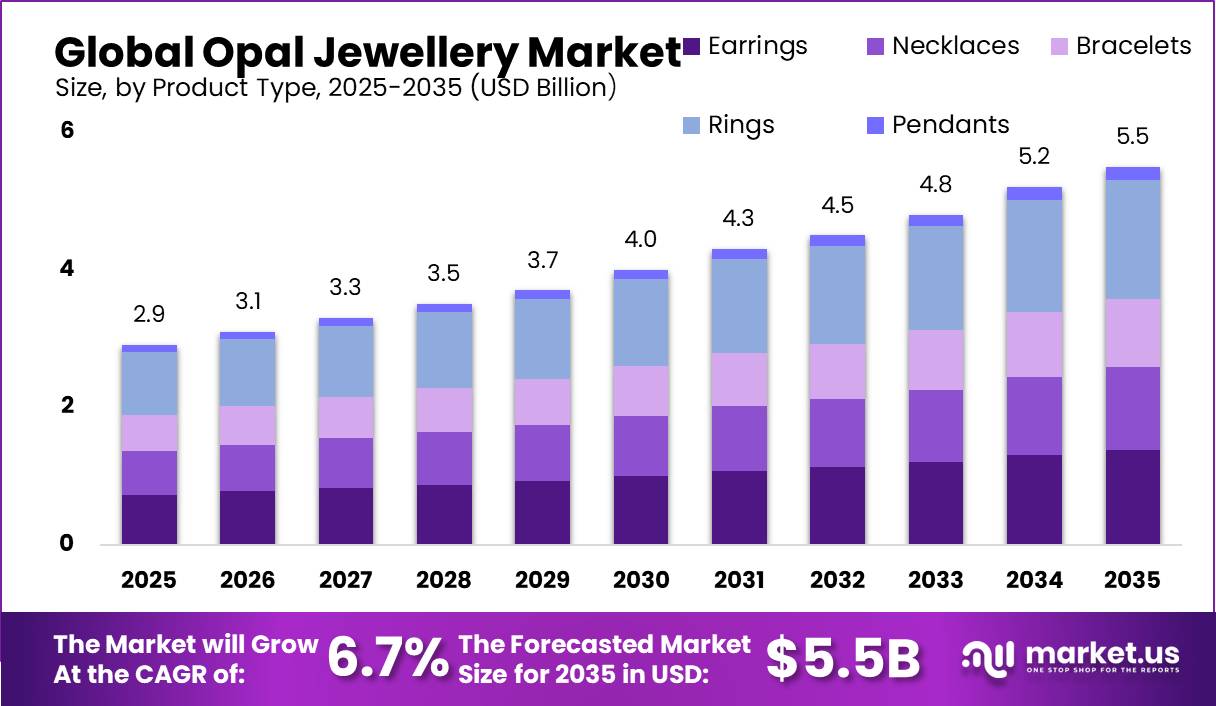
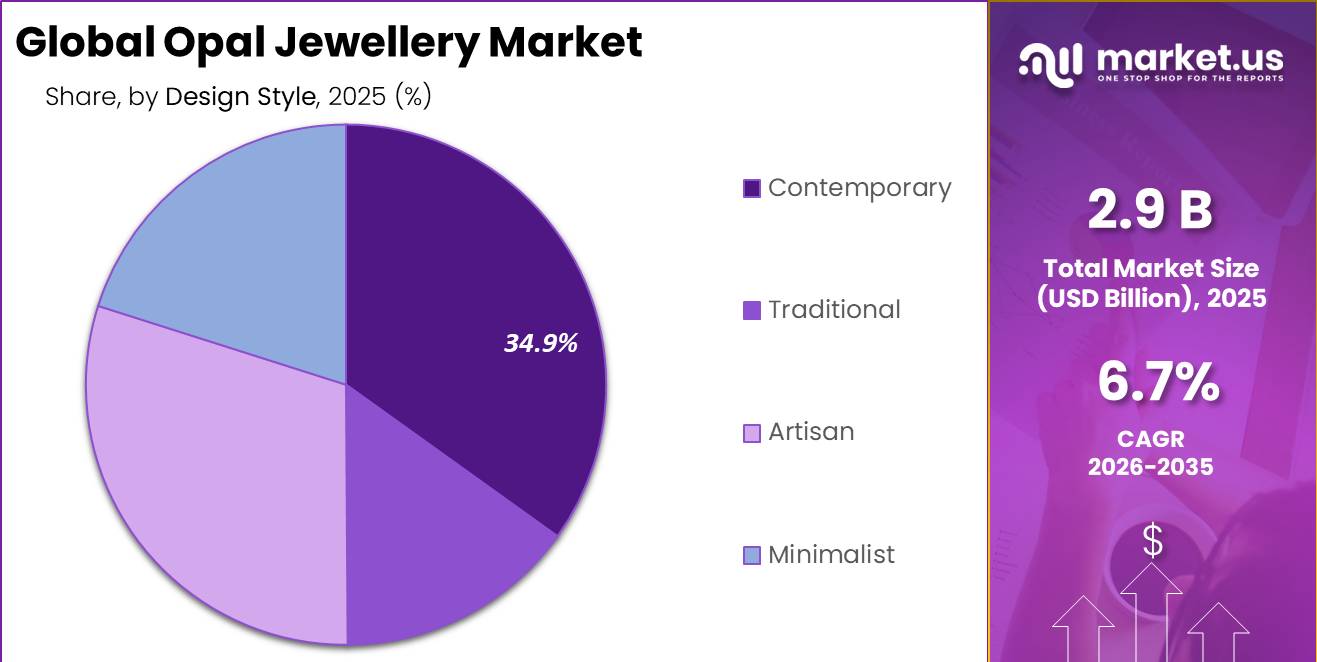
Global Opal Jewelry Market size is expected to be worth around USD 5.5 Billion by 2035 from USD 2.9 Billion in 2025, growing at a CAGR of 6.70% during the forecast period 2026 to 2035. This pace reflects a steady, supply constrained category rather than a fast scaling one. Investors should weigh production limits alongside demand growth when assessing this market.
This market covers opal based jewelry sold across earrings, necklaces, bracelets, rings, and pendants, crafted from natural, synthetic, doublet, or triplet opal. Products span contemporary, traditional, artisan, and minimalist design styles aimed at men, women, and unisex buyers. The structure ties closely to gemstone origin, since opal supply concentration shapes pricing and availability across every category.
Key Takeaways
- Global Opal Jewelry Market size is valued at USD 2.9 Billion in 2025 and is projected to reach USD 5.5 Billion by 2035.
- The market is expected to grow at a CAGR of 6.70% between 2026 and 2035.
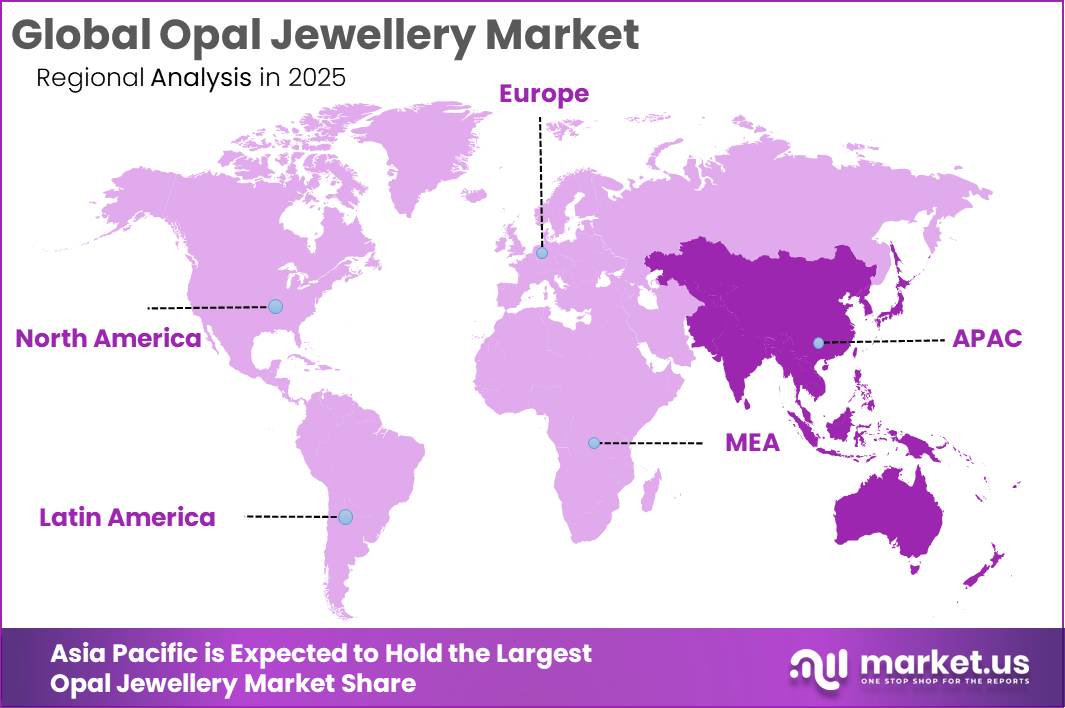
- Asia-Pacific dominates the market with a 37.40% share.
- Rings lead the By Product Type segment with a 31.60% share.
- Natural Opal dominates the By Material segment with a 48.50% share.
- Contemporary designs lead the By Design Style segment with a 34.90% share.
- Women hold the dominant position in the By Customer Type segment with a 69.30% share.
This reflects a market where category leadership is already concentrated across product, material, style, and buyer type. Therefore, challengers must differentiate through design, sourcing transparency, or underserved buyer segments rather than competing head on with dominant categories.
Supply origin remains central to this market’s structure and pricing power. Data from Geoscience Australia shows Australia produces approximately 95% of the world’s precious opal, making it the dominant source for global jewelry manufacturing. This concentration means any disruption to Australian output carries outsized pricing consequences across the entire downstream jewelry trade.
Seasonal gifting demand continues to support category level revenue beyond everyday purchases. According to NRF, US consumers were expected to spend USD 7.5 Billion on jewelry for Mother’s Day 2026, reflecting strong demand for gemstone gifting occasions. As a result, opal jewelry brands that align product launches with gifting calendars can capture seasonal demand spikes more effectively than year round positioning alone.
Product Type Analysis
Rings dominate with 31.60% due to strong bridal and gifting purchase occasions.
In 2025, Rings held a dominant market position in the By Product Type segment of Opal Jewelry Market, with a 31.60% share. Rings benefit from consistent demand tied to milestone gifting occasions rather than seasonal trend cycles alone. This consistency makes rings the most reliable revenue anchor across the product type segment.
Earrings serve buyers seeking lower price entry points into opal jewelry compared to rings or bracelets. These purchases often function as a trial format before buyers commit to higher value pieces. Consequently, earrings act as an acquisition category that feeds future purchases in other product types.
Necklaces attract buyers focused on statement pieces worn as a primary jewelry item rather than layered accessories. This positioning supports higher average price points within the necklace category specifically. Therefore, brands can use necklaces to anchor premium collections without competing directly against ring pricing.
Material Analysis
Natural Opal dominates with 48.50% due to provenance driven buyer preference.
In 2025, Natural Opal held a dominant market position in the By Material segment of Opal Jewelry Market, with a 48.50% share. Buyers in this segment prioritize authenticity and origin over lower price alternatives. This preference reinforces premium pricing power for brands able to verify natural opal sourcing.
Synthetic Opal serves cost conscious buyers seeking the visual appeal of opal without natural stone pricing. This category appeals most to entry level and fashion focused purchases rather than investment grade jewelry. As a result, synthetic options expand the addressable buyer base beyond natural opal’s premium positioning.
Doublet Opal offers a middle tier option combining a thin natural opal layer with a backing material for affordability. This structure lets buyers access a natural opal appearance at a reduced price point. However, doublet products require clear disclosure to maintain buyer trust against natural stone claims.
Design Style Analysis
Contemporary designs lead with 34.90% due to alignment with current jewelry trends.
In 2025, Contemporary held a dominant market position in the By Design Style segment of Opal Jewelry Market, with a 34.90% share. Contemporary pieces align closely with current fashion cycles and social media driven discovery. In June 2026, Tiffany & Co. debuted its Blue Book 2026 Hidden Garden High Jewelry Collection, reinforcing demand for design forward opal pieces among luxury buyers.
Traditional designs appeal to buyers seeking heritage craftsmanship and classic settings over trend driven aesthetics. This category tends to attract older buyers purchasing for long term wear rather than seasonal styling. Therefore, traditional collections perform best when marketed around durability and timeless value.
Artisan designs target buyers prioritizing handcrafted detail and unique, non mass produced pieces. This positioning supports premium pricing for small scale and independent jewelry makers. As a result, artisan products compete less on volume and more on individuality and maker story.
Customer Type Analysis
Women dominate with 69.30% due to broader category purchase frequency.
Men represent a smaller share of opal jewelry purchases, typically favoring simpler settings over elaborate designs. This category remains underdeveloped relative to women’s purchase volume across most product types. Consequently, dedicated men’s collections face limited but growing demand as a distinct vertical.
In 2025, Women held a dominant market position in the By Customer Type segment of Opal Jewelry Market, with a 69.30% share. Women purchase across the widest span of product types, styles, and materials within this category. This breadth makes women the primary audience for cross category marketing and gifting campaigns.
Unisex jewelry serves buyers seeking designs not marketed around traditional gender categories. This approach appeals to buyers prioritizing minimalist or artisan aesthetics over conventional positioning. However, the segment remains the smallest of the three, limiting its near term revenue contribution.
Key Market Segments
By Product Type
- Earrings
- Necklaces
- Bracelets
- Rings
- Pendants
By Material
- Natural Opal
- Synthetic Opal
- Doublet Opal
- Triplet Opal
By Design Style
- Contemporary
- Traditional
- Artisan
- Minimalist
By Customer Type
- Men
- Women
- Unisex
Drivers
Australia’s near monopoly in global opal supply is facing structural geological depletion across its legacy mining fields. The GIA has documented that black opal production has fallen so low that assembling a matched suite today would be impossible. The boulder opal belt is mined by no more than 25 active operators at any given time, tightening gem quality inventory across the value chain.
Price appreciation is already visible across categories, with industry data showing annual increases of up to 25% for boulder opal and 15% for white, crystal, and black opal. High quality opal cut within Australia can increase in value four to five times relative to rough stone. Therefore, jewelers must shift from volume procurement toward exclusivity agreements and provenance led retail narratives.
| Driver | (~) % Impact on CAGR Forecast | Geographic Relevance | Impact Timeline |
|---|---|---|---|
| Supply Scarcity Premium: Geological depletion of legacy Australian mining fields tightening gem-quality opal inventory, driving per-carat appreciation | +1.4% | Australia (source), North America & EU (consumption core), Japan | Long term (≥ 4 years) |
| Social Commerce & Digital Discovery: TikTok/Instagram-driven product discovery converting Gen Z and millennial audiences into opal jewelry buyers via shoppable content | +1.1% | North America core, EU, APAC corridors (India, South Korea, SEA) | Short term (≤ 2 years) |
| Ethical Sourcing & Blockchain Traceability: Consumer-led and regulatory demand for mine-to-market transparency creating a certified premium tier for Australian opals | +0.9% | EU (regulatory pressure core), North America, Australia | Medium term (2–4 years) |
| India–EU FTA & APAC Trade Liberalization: Removal of EU jewelry import duties from India (up to 4%) unlocking new export corridors; APAC HNI demand expansion | +0.8% | APAC corridors (India, EU), South America spill-over | Medium term (2–4 years) |
| Jewelry Self-Purchasing & Self-Expression Shift: Rising self-gift buying (up 58% since 2021) and personal expression-driven purchases widening opal’s addressable consumer base | +0.7% | North America core, EU, APAC | Short term (≤ 2 years) |
| Wellness, Crystal Healing & Astrological Jewelry Trend: Mainstream adoption of gemstone wellness narratives positioning opal as a spiritually resonant accessory via D2C and lifestyle channels | +0.5% | North America, South Asia (India), EU lifestyle corridors | Short term (≤ 2 years) |
Restraints
Australia accounts for more than 95% of global precious opal production, creating a single point of failure risk across the supply chain. Fields are operated almost entirely by small scale, sole trader miners using conventional tools with no large scale extraction infrastructure. This makes supply volumes vulnerable to weather shocks and gradual deposit depletion alike.
A 20% output contraction at Coober Pedy alone can compress global white opal supply by approximately 10%, squeezing manufacturer gross margins by 200 to 400 basis points per collection cycle. Ethiopian artisanal operations add further uncertainty, with mine collapses and a lack of certified documentation creating 6 to 10 week supply lead time gaps. This prevents manufacturers from building reliable forward pricing contracts.
| estraint | (~) % Impact on CAGR Forecast | Geographic Relevance | Impact Timeline |
|---|---|---|---|
| Supply Concentration & Artisanal Mining Fragility | ~−1.2% | Australia core (Lightning Ridge, Coober Pedy); Sub-Saharan Africa (Ethiopia) | Long term (≥ 4 years) |
| US Trade Tariff Escalation on Gems & Jewelry | ~−1.0% | North America core; India–US export corridor | Short term (≤ 2 years) |
| Synthetic/Lab-Grown Opal Substitution Pressure | ~−0.9% | North America, EU, APAC corridors | Medium term (2–4 years) |
| Ethiopia Gemstone Smuggling & ECX Transition Disruption | ~−0.7% | Sub-Saharan Africa (origin); EU, Middle East (trade routes) | Medium term (2–4 years) |
| Physical Durability Limitations & Consumer Awareness Deficit | ~−0.6% | North America, EU, APAC mass-market retail | Long term (≥ 4 years) |
| EU CSDDD & ESG Traceability Compliance Burden | ~−0.5% | EU core (compliance mandate); Australia, India (supply-side burden) | Medium term (2–4 years) |
Challenges
Ethiopia has become a significant second source of play of color opal since the Wollo Province finds, challenging Australia’s dominance through lower priced unpolished goods. Established Australian brands must keep investing in provenance communication to justify price premiums. Mid market retailers face margin compression as buyers conflate the two origin sources.
Ethiopian opal is predominantly hydrophane, a porous variety that absorbs water and can cause temporary or permanent color loss. GIA testing confirms this requires microscopic analysis before any water exposure to prevent crack propagation. Australia still produces more than 90% of the world’s highest grade supply, but quality differentiation investment compresses achievable CAGR by an estimated 0.9 percentage points.
| Challenge | (~) % CAGR Friction Drag | Geographic Relevance | Mitigation Horizon |
|---|---|---|---|
| Source Deposit Depletion & Regulatory Complexity | -1.4% | Lightning Ridge (NSW), Coober Pedy (SA), Queensland | Long term (≥ 4 years) |
| Skilled Lapidary & Mining Workforce Attrition | -1.1% | Australia mining fields; India gem-cutting clusters | Long term (≥ 4 years) |
| Ethiopian Supply Competition & Hydrophane Quality Risk | -0.9% | Global trade corridors; APAC & North America retail | Medium term (2–4 years) |
| Doublet/Triplet Misrepresentation & Authentication Gap | -0.8% | Global e-commerce channels; APAC, North America | Medium term (2–4 years) |
| US Tariff Volatility & India Trade Corridor Disruption | -0.7% | US import corridors; India gem-cutting hubs (Surat, Mumbai) | Short term (≤ 2 years) |
| Climate-Driven Operational Disruption in Mining Zones | -0.6% | Outback NSW, South Australia, Central Queensland | Long term (≥ 4 years) |
Opportunities
India’s gems and jewelry export data for H1 FY2025-26 shows polished synthetic stones grew 342.07% year on year in Q2, signaling structural demand for manufactured stone alternatives. Lab grown diamond prices have fallen more than 80% below mined equivalents, proving certified lab origin gemstones can succeed as mass premium products. This blueprint transfers directly to lab grown opal as a distinct product tier rather than a discount substitute.
Opal’s play of color can be precision engineered in lab settings to produce specific spectral outputs natural supply cannot replicate at scale. D2C lab grown opal collections can target 58% to 65% gross margins by removing wholesale intermediaries, well above the 35% to 42% margins typical of conventional opal retail. Brands using third party certification and tiered pricing between USD 80 and USD 350 per piece can reach sustainability minded buyers in a colored gemstone market growing at 10.5% CAGR through 2035.
| Opportunity | (~) % Potential CAGR Upside | Geographic Relevance | Execution Window |
|---|---|---|---|
| Lab-Grown Opal Mass Premiumization | +1.8% | North America, EU, South & Southeast Asia | Short term (≤ 2 years) |
| Bridal & Alternative Engagement Segment Capture | +1.5% | North America core, EU, Australia | Medium term (2–4 years) |
| APAC Luxury & Astrology-Wellness Positioning | +2.2% | India, China, Southeast Asia | Medium term (2–4 years) |
| Men’s Opal Jewelry as a Standalone Vertical | +1.2% | North America, EU, India urban markets | Medium term (2–4 years) |
| Blockchain Provenance as a Premium Monetization Layer | +1.0% | EU (regulatory-driven), North America, Australia | Short term (≤ 2 years) |
| Phygital Opal: NFT-Linked Digital Collectibles & Avatar Wearables | +0.9% | North America, APAC (South Korea, Japan), EU | Long term (≥ 4 years) |
Regional Analysis
Asia-Pacific Dominates the Opal Jewelry Market with a Market Share of 37.40%
Asia-Pacific leads the global opal jewelry market, supported by a growing base of buyers across the broader colored gemstone category in the region. Rising disposable incomes and expanding luxury retail access continue to drive regional purchase activity. This positions Asia-Pacific as the primary growth engine for opal jewelry demand going forward.
Key Regions and Countries
North America
- US
- Canada
Europe
- Germany
- France
- The UK
- Spain
- Italy
- Rest of Europe
Asia Pacific
- China
- Japan
- South Korea
- India
- Australia
- Rest of APAC
Latin America
- Brazil
- Mexico
- Rest of Latin America
Middle East and Africa
- GCC
- South Africa
- Rest of MEA
Key Company Insights
Fire Mountain Gems URL UNVERIFIED operates in a market where online buyer reach increasingly shapes competitive position. Figures from Etsy show 95.5 million active buyers globally in 2024, supporting demand for customized and artisan gemstone jewelry. This means suppliers with strong online catalog presence can capture trial purchases that feed larger future orders.
Gemporia competes in a market where digital sales scale continues to expand independent jewelry channels. According to Etsy, the platform generated USD 12.6 Billion in Gross Merchandise Sales during 2024, highlighting the scale of online opportunity for independent gemstone brands. This creates both opportunity and risk, since visibility within crowded online marketplaces now drives a meaningful share of category revenue.
Key Players
- Fire Mountain Gems
- Gemporia
- Zales
- Rio Grande
- Swarovski
- Harry Winston
- Sapphire Manufacturing
- Tiffany & Co.
- JTV
- Kay Jewelers
- Blue Nile
- Stuller
Recent Developments
- June 2025 – The Marathon Company acquired Kovel Collection, a jewelry brand known for designs incorporating opal, mother-of-pearl, and semi-precious gemstones, expanding its presence in the gemstone and designer jewelry segment.
Report Scope
| Report Features | Description |
|---|---|
| Market Value (2025) | USD 2.9 Billion |
| Forecast Revenue (2035) | USD 5.5 Billion |
| CAGR (2026-2035) | 6.70% |
| Base Year for Estimation | 2025 |
| Historic Period | 2020-2024 |
| Forecast Period | 2026-2035 |
| Report Coverage | Revenue Forecast, Market Dynamics, Market Opportunity Analysis, Technology and Innovation Landscape, Competitive Landscape, Recent Developments |
| Segments Covered | By Product Type (Earrings, Necklaces, Bracelets, Rings, Pendants), By Material (Natural Opal, Synthetic Opal, Doublet Opal, Triplet Opal), By Design Style (Contemporary, Traditional, Artisan, Minimalist), By Customer Type (Men, Women, Unisex) |
| Regional Analysis | North America (US and Canada), Europe (Germany, France, The UK, Spain, Italy, and Rest of Europe), Asia Pacific (China, Japan, South Korea, India, Australia, and Rest of APAC), Latin America (Brazil, Mexico, and Rest of Latin America), Middle East and Africa (GCC, South Africa, and Rest of MEA) |
| Competitive Landscape | Fire Mountain Gems, Gemporia, Zales, Rio Grande, Swarovski, Harry Winston, Sapphire Manufacturing, Tiffany & Co., JTV, Kay Jewelers, Blue Nile, Stuller |
| Customization Scope | Customization for segments, region/country-level will be provided. Additional customization can be done based on requirements. |
| Purchase Options | We have three licenses to opt for: Single User License, Multi-User License (Up to 5 Users), Corporate Use License (Unlimited User and Printable PDF) |


