
Quick Navigation
Report Overview
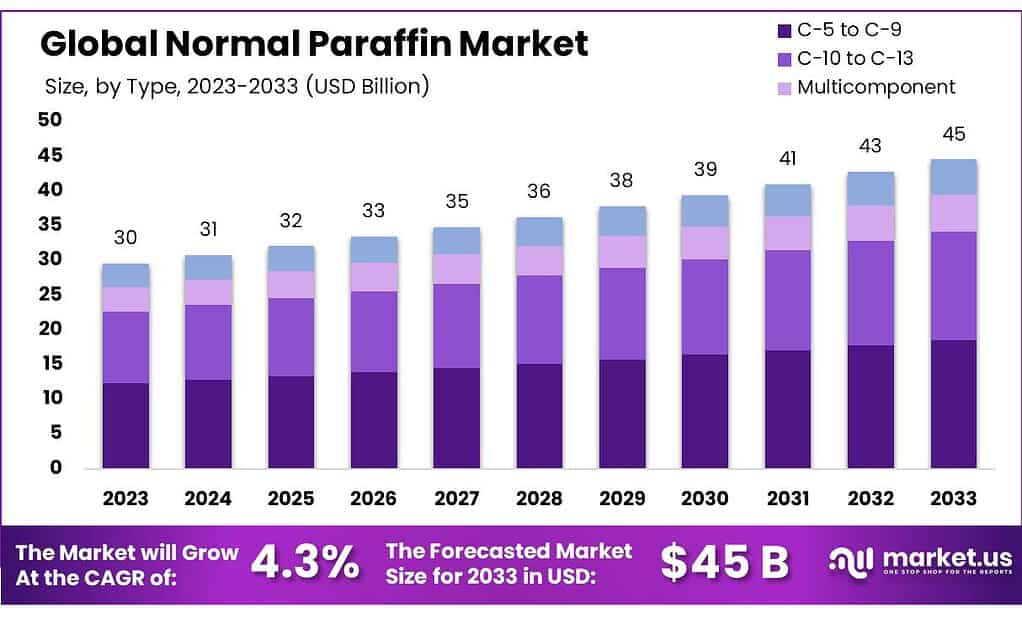
The global Normal Paraffin Market size is expected to be worth around USD 45 billion by 2033, from USD 30 billion in 2023, growing at a CAGR of 4.3% during the forecast period from 2023 to 2033.
The Normal Paraffin Market refers to the global marketplace for normal paraffins, which are straight-chain hydrocarbons consisting of linear alkane molecules. Normal paraffins, also known as n-paraffins or normal alkanes, are a type of saturated hydrocarbon with the general formula CnH2n+2, where ‘n’ represents the number of carbon atoms in the molecule. These compounds are derived from the fractional distillation of petroleum or natural gas, wherein crude oil or natural gas liquids are processed to separate hydrocarbon fractions based on their boiling points.
Normal paraffins find widespread applications across various industries due to their versatile properties and chemical stability. They are commonly used as feedstock in the production of linear alkylbenzene (LAB), which serves as a key raw material in the manufacturing of biodegradable detergents. Additionally, normal paraffins are utilized as solvents in industrial cleaning formulations, metalworking fluids, and textile processing chemicals. They also serve as intermediates in the synthesis of specialty chemicals, plasticizers, lubricants, and pharmaceuticals.
The growth of the normal paraffin market is influenced by factors such as industrialization, urbanization, and economic development, which drive the demand for cleaning products, detergents, and specialty chemicals. Moreover, advancements in refining technologies and the increasing focus on sustainable practices have led to the development of eco-friendly processes for the production of normal paraffins, further bolstering market growth.
The normal paraffin market plays a crucial role in meeting the demand for essential chemicals and materials across various industries, providing a valuable resource for manufacturing processes, product formulations, and industrial applications.
Key Takeaways
- Market Growth: Normal Paraffin Market is to reach USD 45 billion by 2033, growing at 4.3% CAGR from USD 30 billion in 2023.
- Segment Dominance: C-5 to C-9 Normal Paraffin holds a 34.5% market share in 2024, driven by extensive use in cleaning products.
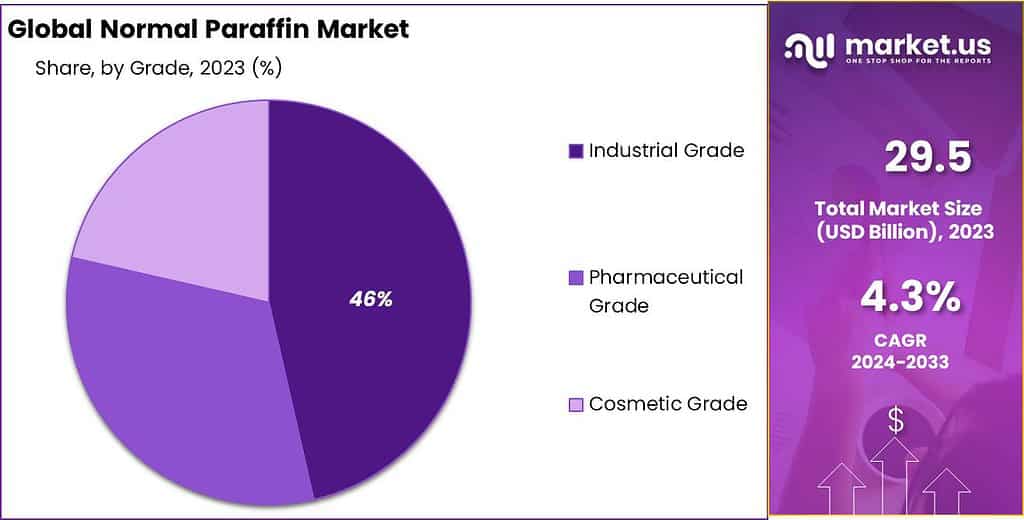
- Grade Distribution: Industrial Grade secures over 45.7% market share, pivotal for manufacturing lubricants and detergents.
- Form Preference: Liquid Normal Paraffin holds a 59.7% market share, favored for versatility in industrial applications.
- Key Applications: LAB Production dominates with a 56.4% market share, crucial for biodegradable detergent manufacturing.
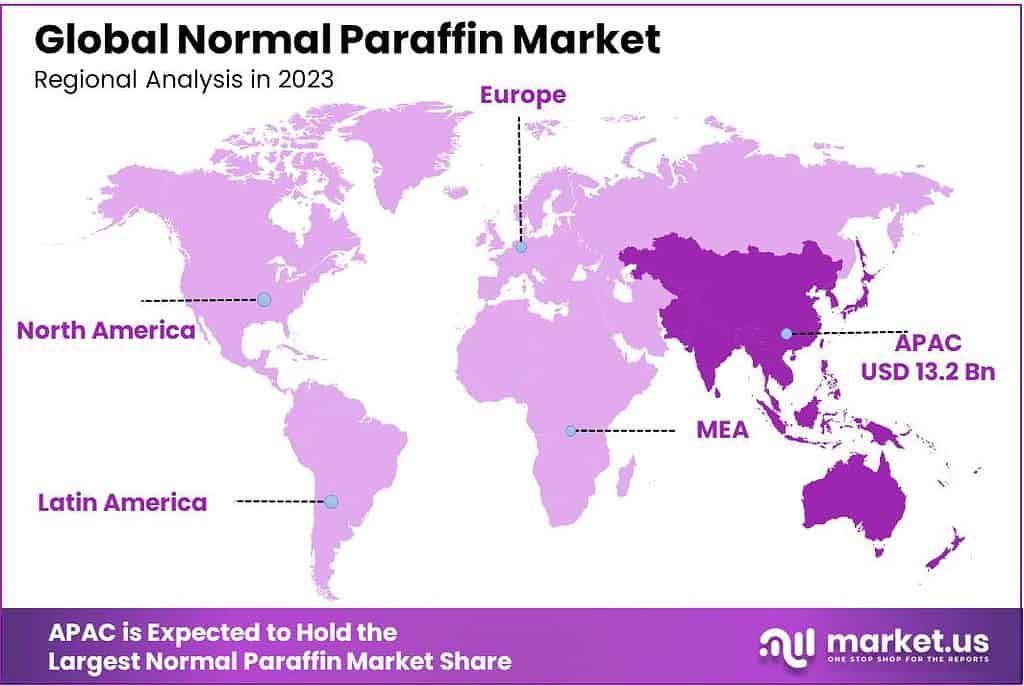
- Regional Influence: Asia Pacific commands a 45% market share, driven by urbanization and infrastructure development.
- Normal paraffins with carbon chain lengths ranging from C20 to C40 are used as lubricants and waxes in various industrial applications.
- n-Hexadecane (C16H34) is a key component in aviation turbine fuels, comprising up to 25% by volume.
By Type
C-5 to C-9 Normal Paraffin: C-5 to C-9 held a dominant market position in 2024, capturing more than a 34.5% share. This segment primarily includes light normal paraffins, which are essential in the production of solvents, synthesis of chemicals, and as feedstock in the petrochemical industry. The demand in this segment is driven by its extensive use in consumer goods, such as cleaning and personal care products. The versatility and high purity of C-5 to C-9 paraffins have led to their significant market share, with projections indicating steady growth due to expanding applications in emerging markets.
C-10 to C-13 Normal Paraffin: The C-10 to C-13 segment represents a crucial component of the normal paraffin market, focusing on medium-chain paraffins. These are predominantly used in the manufacturing of detergents, lubricants, and in some cases, as solvents in specialized applications. In 2024, this segment accounted for a substantial portion of the market, driven by the rising demand for biodegradable and sustainable cleaning products. The growth in this segment can be attributed to the increasing consumer preference for environmentally friendly products, which has stimulated research and development efforts to expand its applications.
Multicomponent Normal Paraffin: Multicomponent normal paraffin encompasses a blend of various chain lengths, offering a wide range of physical and chemical properties. This segment is tailored to meet specific industry requirements, including applications in alkylation processes, plasticizers, and in the production of synthetic lubricants. In 2024, this segment experienced a notable increase in demand, attributed to its flexibility and adaptability in diverse industrial applications. The ability to customize the blend according to specific needs has made multicomponent kinds of paraffin a preferred choice for many industrial users, contributing to its growing market share.
Other Types of Normal Paraffin:The normal paraffin market includes specialized and niche applications of normal paraffin not encompassed by the primary segments. This segment caters to specific industrial needs, including high-purity paraffin for pharmaceutical applications, ultra-light paraffin for cosmetic formulations, and heavy paraffin for high-temperature operations. Although smaller in market share compared to the main segments, the diverse applications and specialized demand within this category support its continued relevance and potential for growth in specialized markets.
By Grade
Industrial Grade: Starting with a strong foundation, Industrial Grade normal paraffin secured a dominant market position, capturing more than a 45.7% share. This segment is the backbone of various industrial applications, including the production of lubricants, detergents, and solvents. Its popularity stems from its efficiency and cost-effectiveness in industrial processes. The continued growth of manufacturing sectors worldwide, especially in emerging markets, fuels the demand for industrial-grade normal paraffin, highlighting its indispensable role in industrial operations.
Pharmaceutical Grade: Pharmaceutical Grade normal paraffin, known for its exceptional purity, plays a critical role in the pharmaceutical industry. This grade is indispensable for creating medical ointments, and laxatives, and as a base in numerous pharmaceutical formulations. The demand for pharmaceutical-grade normal paraffin is driven by the expanding healthcare sector, which relies on high-quality ingredients for the production of safe and effective medical products. As global investment in healthcare continues to rise, so does the significance of pharmaceutical-grade normal paraffin in medical applications.
Cosmetic Grade: Lastly, Cosmetic Grade normal paraffin caters to the beauty and personal care industry. This grade is incorporated into a variety of products, such as creams, lotions, and lipsticks, prized for its ability to enhance product texture and moisture retention. The surge in consumer spending on personal care and an increasing emphasis on skincare and beauty support the growing demand for cosmetic-grade normal paraffin. The trend towards sustainable and safe cosmetic ingredients further underscores the value of this grade in the cosmetics market.
By Form
Liquid normal paraffin stood out in 2024, holding a dominant market position with more than a 59.7% share. This form is particularly favored for its ease of handling and application in a wide range of industrial processes. Liquid normal paraffin is extensively used as a solvent, lubricant, and in the formulation of various products in sectors such as automotive, manufacturing, and chemicals. Its high demand is driven by the efficiency and versatility it offers in industrial applications, making it a preferred choice for companies seeking operational efficiency and performance.
Solid normal paraffin, while capturing a smaller market share compared to its liquid counterpart, plays a critical role in numerous applications, particularly in the production of candles, packaging, and as a raw material in the cosmetics and pharmaceutical industries. Its unique properties, such as a defined melting point, make it ideal for applications requiring precise thermal characteristics. Despite its lower market share, the demand for solid normal paraffin remains stable, supported by its use in specialized applications that leverage its solid state for product stability and performance.
By Application
Linear Alkyl Benzene Production: Leading the application segments, Linear Alkyl Benzene (LAB) Production held a dominant market position, capturing more than a 56.4% share. LAB is a key ingredient in the manufacture of detergents, making this segment crucial for meeting global hygiene and cleaning needs. The demand for LAB, driven by the worldwide need for clean water and sanitary living conditions, underscores the importance of this segment in the normal paraffin market.
Fatty Alcohol Production: Fatty Alcohol Production follows as a significant application for normal paraffin. These alcohols are used in the production of detergents, cosmetics, and personal care products, highlighting their versatility. The push towards sustainable and biodegradable products has further fueled the demand for fatty alcohols, reflecting growing consumer awareness and preferences for environmentally friendly products.
Metalworking Products: Normal paraffin finds essential use in Metalworking Products, serving as lubricants and coolants in metal processing and machining operations. The precision and efficiency required in metalworking underscore the need for high-quality paraffin, emphasizing its role in industrial manufacturing and engineering.
Detergents: In the Detergents segment, normal paraffin is a key component in the formulation of various cleaning agents. Its effectiveness in removing oils and greases from surfaces makes it invaluable to the production of household and industrial detergents, with demand driven by ongoing needs for hygiene and cleanliness.
Solvents: As Solvents, normal paraffin plays a pivotal role in the chemical industry, used in processes requiring the dissolution or suspension of other substances. Its versatility and efficacy in a range of applications from pharmaceuticals to paints, highlight the broad utility of normal paraffin in industrial and commercial settings.
Fuel Source: As a Fuel Source, normal paraffin is utilized in specialized applications, offering a cleaner burning alternative to traditional fuels. The interest in sustainable and less environmentally impactful fuel options has led to an increased exploration of normal paraffin in energy and transportation sectors.
Key Market Segments
By Type
- C-5 to C-9
- C-10 to C-13
- Multicomponent
- Others
By Grade
- Industrial Grade
- Pharmaceutical Grade
- Cosmetic Grade
By Form
- Liquid
- Solid
By Application
- Linear Alkyl Benzene Production
- Fatty Alcohol Production
- Metalworking Products
- Detergents
- Solvents
- Fuel Source
- Others
Driving Factors
Growing Demand for Linear Alkylbenzene (LAB) Production
The increasing demand for linear alkylbenzene (LAB) production serves as a significant driver for the normal paraffin market. LAB is a key intermediate in the manufacturing of biodegradable detergents, which find extensive applications in household cleaning, industrial cleaning, and personal care products. As global awareness regarding environmental sustainability and biodegradability continues to rise, there is a growing preference for LAB-based detergents over traditional formulations containing branched alkylbenzenes.
Normal paraffins are essential feedstock materials for LAB production, as they serve as the primary raw material in the synthesis process. LAB is typically produced through the alkylation of benzene with linear olefins derived from normal paraffins in the presence of catalysts. This process results in the formation of linear alkylbenzene sulfonic acid (LAS), the active ingredient in LAB-based detergents known for its excellent cleaning properties and biodegradability.
The growth of the normal paraffin market is closely linked to the demand for LAB-based detergents, which are widely used in households, commercial establishments, and industrial facilities for cleaning and hygiene purposes. As urbanization and industrialization continue to drive population growth and economic development globally, the demand for cleaning products and detergents is expected to increase substantially, thereby fueling the demand for normal paraffins as a key raw material in LAB production.
Moreover, regulatory initiatives and consumer preferences for environmentally friendly and sustainable cleaning solutions are driving the adoption of LAB-based detergents over conventional formulations. LAB-based detergents offer several advantages, including biodegradability, low toxicity, and reduced environmental impact compared to their counterparts containing branched alkylbenzenes. This shift towards eco-friendly detergents is propelling the demand for normal paraffins as feedstock in LAB production, driving market growth.
Furthermore, technological advancements and process innovations in LAB production are enhancing the efficiency, cost-effectiveness, and environmental performance of the manufacturing process. New catalyst technologies, reactor designs, and process optimization techniques are enabling manufacturers to produce LAB from normal paraffins more efficiently and sustainably, further supporting market expansion.
Restraining Factors
Environmental Concerns and Regulatory Restrictions
Environmental concerns and regulatory restrictions pose significant challenges to the normal paraffin market, hindering its growth and development. As awareness regarding environmental sustainability and pollution prevention continues to increase globally, there is growing scrutiny on the use of hydrocarbon-based chemicals, including normal paraffins, due to their potential environmental impacts and contribution to air and water pollution.
One of the primary concerns associated with normal paraffins is their role in the production of linear alkylbenzene sulfonate (LAS), a key ingredient in LAB-based detergents. While LAB-based detergents offer several advantages such as biodegradability and low toxicity, the manufacturing process involving normal paraffins and benzene can generate hazardous by-products and emissions, including volatile organic compounds (VOCs) and sulfur-containing compounds. These emissions can contribute to air pollution and pose risks to human health and the environment, leading to regulatory scrutiny and restrictions on normal paraffin-based processes.
Additionally, the disposal of waste streams generated during normal paraffin production and LAB synthesis poses environmental challenges. Effluent wastewater containing residual chemicals, process additives, and impurities from normal paraffin refining and LAB manufacturing processes can contaminate water bodies and soil if not properly treated and managed. Concerns about water pollution, ecosystem disruption, and public health impacts associated with wastewater discharge from chemical manufacturing facilities can lead to regulatory constraints and enforcement actions, restricting market growth.
Furthermore, regulatory agencies worldwide are implementing stringent regulations and emission standards to mitigate the environmental impact of industrial activities, including chemical manufacturing processes involving normal paraffin. Regulatory frameworks such as emission limits, effluent discharge standards, and hazardous waste management regulations impose compliance requirements and financial burdens on chemical manufacturers, increasing operational costs and regulatory risks. Non-compliance with environmental regulations can result in fines, penalties, and legal liabilities, further impacting market competitiveness and profitability.
Moreover, the growing emphasis on sustainability and corporate responsibility is driving consumer and industry demand for alternative, eco-friendly chemical solutions that minimize environmental impact and support circular economy principles. As a result, there is increasing interest and investment in renewable and bio-based alternatives to normal paraffin, such as bio-based surfactants and green solvents, which offer comparable performance with a lower environmental footprint.
Growth Opportunity
Increasing Demand for Bio-based and Renewable Normal Paraffins
The increasing demand for bio-based and renewable normal paraffins presents a significant growth opportunity for the market. With growing concerns about environmental sustainability, climate change, and finite fossil fuel resources, there is a shifting preference towards bio-based alternatives derived from renewable feedstocks. Bio-based normal paraffins offer several advantages over their petroleum-derived counterparts, including reduced environmental footprint, lower carbon emissions, and potential for sustainable production.
One of the key drivers of the growing demand for bio-based normal paraffins is the increasing emphasis on green chemistry and sustainable manufacturing practices across various industries. As governments, regulatory agencies, and consumers advocate for the reduction of greenhouse gas emissions and the transition to renewable resources, there is a rising interest in bio-based chemicals as alternatives to traditional petroleum-based products. Bio-based normal paraffins can be derived from renewable feedstocks such as plant oils, animal fats, or biomass residues through processes such as hydrogenation or Fischer-Tropsch synthesis, offering a renewable and sustainable source of hydrocarbon molecules.
Moreover, the expanding market for bio-based surfactants and detergents presents a significant opportunity for bio-based normal paraffins. Normal paraffins are key intermediates in the production of linear alkylbenzene sulfonate (LAS), a widely used surfactant in detergents and cleaning products. By offering bio-based LAS derived from renewable normal paraffins, manufacturers can meet the growing demand for eco-friendly cleaning solutions while reducing their reliance on fossil fuels and contributing to a circular economy.
Furthermore, advancements in biotechnology and process innovation are enabling the development of cost-effective and scalable production methods for bio-based normal paraffins. Biorefinery technologies, enzyme engineering, and metabolic engineering approaches allow for the efficient conversion of renewable feedstocks into high-quality normal paraffins with desirable properties and performance characteristics. As these technologies mature and production costs decrease, bio-based normal paraffins are expected to become increasingly competitive with petroleum-derived alternatives, driving market growth and adoption.
Latest Trends
Adoption of Green Chemistry Principles
One of the major latest trends in the normal paraffin market is the increasing adoption of green chemistry principles throughout the production, processing, and application stages. Green chemistry, also known as sustainable chemistry, focuses on the design and development of chemical products and processes that minimize environmental impact, reduce waste generation, and promote the efficient use of resources. As sustainability becomes a paramount concern for industries and consumers alike, there is a growing recognition of the importance of incorporating green chemistry practices into the normal paraffin market.
One key aspect of this trend is the development of eco-friendly production processes for normal paraffins. Traditional methods of normal paraffin production often involve energy-intensive refining processes and chemical transformations that generate significant waste streams and emissions. However, advancements in process technology, catalysis, and renewable energy integration are enabling the development of more sustainable production routes for normal paraffins. These include processes such as bio-refining, enzymatic hydrolysis, and hydrogenation of renewable feedstocks, which offer reduced environmental footprint and lower carbon emissions compared to conventional methods.
Another aspect of the trend toward green chemistry in the normal paraffin market is the development of sustainable product formulations and applications. Manufacturers are increasingly focused on creating products that meet performance requirements while minimizing environmental impact throughout their lifecycle. This includes the use of bio-based and renewable normal paraffins as alternatives to petroleum-derived counterparts, as well as the formulation of products with reduced toxicity, biodegradability, and recyclability.
Furthermore, there is a growing emphasis on resource efficiency and waste minimization in the normal paraffin market. This involves the optimization of production processes to maximize yield and reduce energy consumption, as well as the utilization of by-products and waste streams for value-added applications. By implementing circular economy principles, manufacturers can minimize waste generation and resource depletion while creating new revenue streams from otherwise underutilized resources.
Moreover, regulatory initiatives and consumer preferences are driving the adoption of green chemistry practices in the normal paraffin market. Governments around the world are implementing stricter environmental regulations and incentives to promote the use of sustainable chemicals and processes. Similarly, consumers are increasingly seeking out products that are environmentally friendly, ethically sourced, and socially responsible, driving demand for green chemistry solutions in various industries.
Regional Analysis
In 2024, the Asia Pacific region stood out as a pivotal force in the global normal paraffin market, securing a notable 45% share. This significant growth is mainly attributed to the brisk expansion of the normal paraffin sector within the region, propelled by factors such as escalating urbanization, population increase, and extensive infrastructure development initiatives.
Nations such as China and India have been instrumental in elevating the Asia Pacific’s prominence in the normal paraffin industry. Their flourishing economies and ambitious urbanization plans have heightened the demand for normal paraffin across various applications, including the production of Linear Alkyl Benzene (LAB), detergents, and solvents, thus fostering investment and development activities throughout the region.
Additionally, the region’s intense demand for normal paraffin is bolstered by its wide-ranging applications across diverse sectors, including manufacturing, pharmaceuticals, cosmetics, and fuel production. With China and India at the forefront, the Asia Pacific boasts strong construction and development capabilities, enabling the establishment of new manufacturing plants and infrastructure projects essential for meeting the increasing demand.
This comprehensive growth in the Asia Pacific normal paraffin market underscores the region’s critical role in shaping the dynamics of the global market, supported by its extensive industrial activities and burgeoning sectors requiring normal paraffin.
Key Regions and Countries
- North America
- The US
- Canada
- Europe
- Germany
- France
- The UK
- Spain
- Italy
- Russia & CIS
- Rest of Europe
- APAC
- China
- Japan
- South Korea
- India
- ASEAN
- Rest of APAC
- Latin America
- Brazil
- Mexico
- Rest of Latin America
- Middle East & Africa
- GCC
- South Africa
- Rest of MEA
Key Players Analysis
The normal paraffin market is characterized by the presence of several key players who play crucial roles in shaping the industry’s landscape. These companies are involved in extensive research and development activities, aiming to enhance the efficiency and applications of normal paraffin across various sectors. Notably, leading firms in this market include major chemical and petrochemical producers with global operations, reflecting the industry’s competitive and innovative nature.
Market Key Players
- Apar Industries Ltd.
- Calumet Specialty Products Partners
- Cepsa
- China Petroleum & Chemical Corp
- CNPC
- Exxon Mobil Corporation
- Farabi Petrochem
- INDUSTRIAL DEVELOPMENT
- JXTG Holdings
- Petrobras
- Royal Dutch Shell plc
- Sasol
- Savita
- Shell
- Sinopec
- Sonneborn
Recent Developments
In 2024, Apar Industries introduced a new range of high-purity normal paraffins targeting the pharmaceutical and cosmetic industries.
In 2024, Calumet Specialty Products Partners invested in research and development to enhance the performance and efficiency of its normal paraffin products.
Report Scope
| Report Features | Description |
|---|---|
| Market Value (2023) | USD 30 Bn |
| Forecast Revenue (2033) | USD 45 Bn |
| CAGR (2023-2033) | 4.3% |
| Base Year for Estimation | 2023 |
| Historic Period | 2018-2023 |
| Forecast Period | 2024-2033 |
| Report Coverage | Revenue Forecast, Market Dynamics, COVID-19 Impact, Competitive Landscape, Recent Developments |
| Segments Covered | By Type(C-5 to C-9, C-10 to C-13, Multicomponent, Others), By Grade(Industrial Grade, Pharmaceutical Grade, Cosmetic Grade), By Form( Liquid, Solid), By Application(Linear Alkyl Benzene Production, Fatty Alcohol Production, Metalworking Products, Detergents, Solvents, Fuel Source, Others) |
| Regional Analysis | North America – The US & Canada; Europe – Germany, France, The UK, Spain, Italy, Russia & CIS, Rest of Europe; APAC– China, Japan, South Korea, India, ASEAN & Rest of APAC; Latin America– Brazil, Mexico & Rest of Latin America; Middle East & Africa– GCC, South Africa, & Rest of MEA |
| Competitive Landscape | Apar Industries Ltd., Calumet Specialty Products Partners, Cepsa, China Petroleum & Chemical Corp, CNPC, Exxon Mobil Corporation, Farabi Petrochem, INDUSTRIAL DEVELOPMENT, JXTG Holdings, Petrobras, Royal Dutch Shell plc, Sasol, Savita, Shell, Sinopec, Sonneborn |
| Customization Scope | Customization for segments, region/country-level will be provided. Moreover, additional customization can be done based on the requirements. |
| Purchase Options | We have three licenses to opt for Single User License, Multi-User License (Up to 5 Users), Corporate Use License (Unlimited User and Printable PDF) |
Frequently Asked Questions (FAQ)
Normal Paraffin Market size is expected to be worth around USD 45 billion by 2033, from USD 30 billion in 2023
Apar Industries Ltd., Calumet Specialty Products Partners, Cepsa, China Petroleum & Chemical Corp, CNPC, Exxon Mobil Corporation, Farabi Petrochem, INDUSTRIAL DEVELOPMENT, JXTG Holdings, Petrobras, Royal Dutch Shell plc, Sasol, Savita, Shell, Sinopec, Sonneborn


