


Report Overview
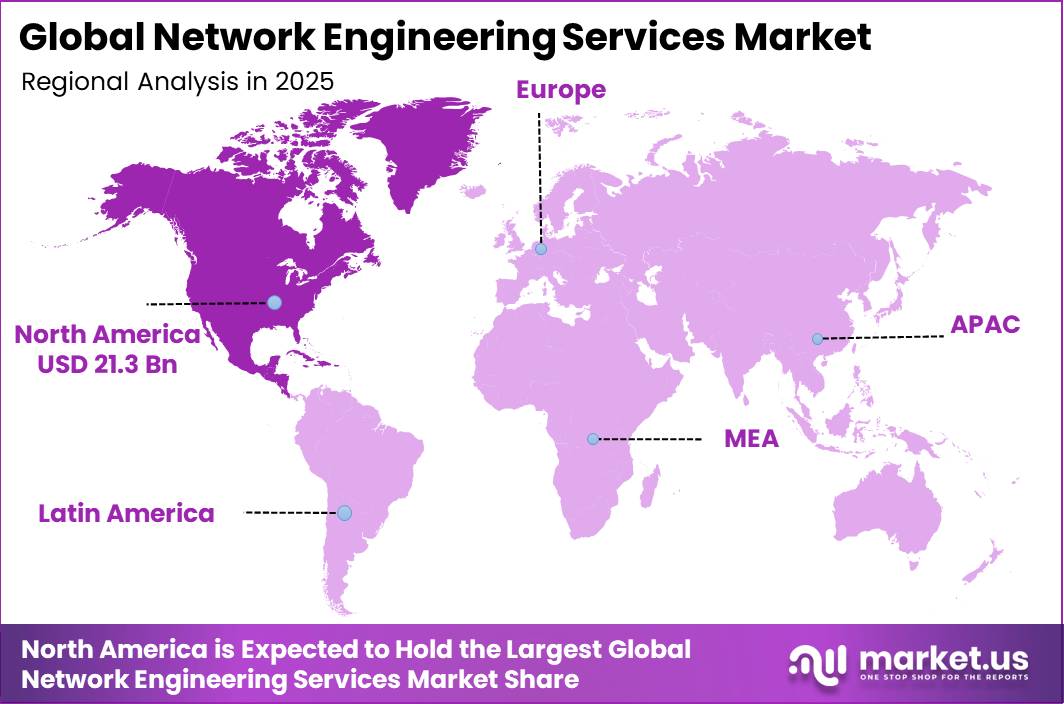
In 2025, the Global Network Engineering Services Market was valued at USD 60.8 billion. The market is projected to grow at a CAGR of 9.0% during 2026–2035, reaching approximately USD 144.0 billion by 2035. North America dominated the global market in 2025, accounting for more than 35.0% of the total market share and generating approximately USD 21.3 billion in revenue.
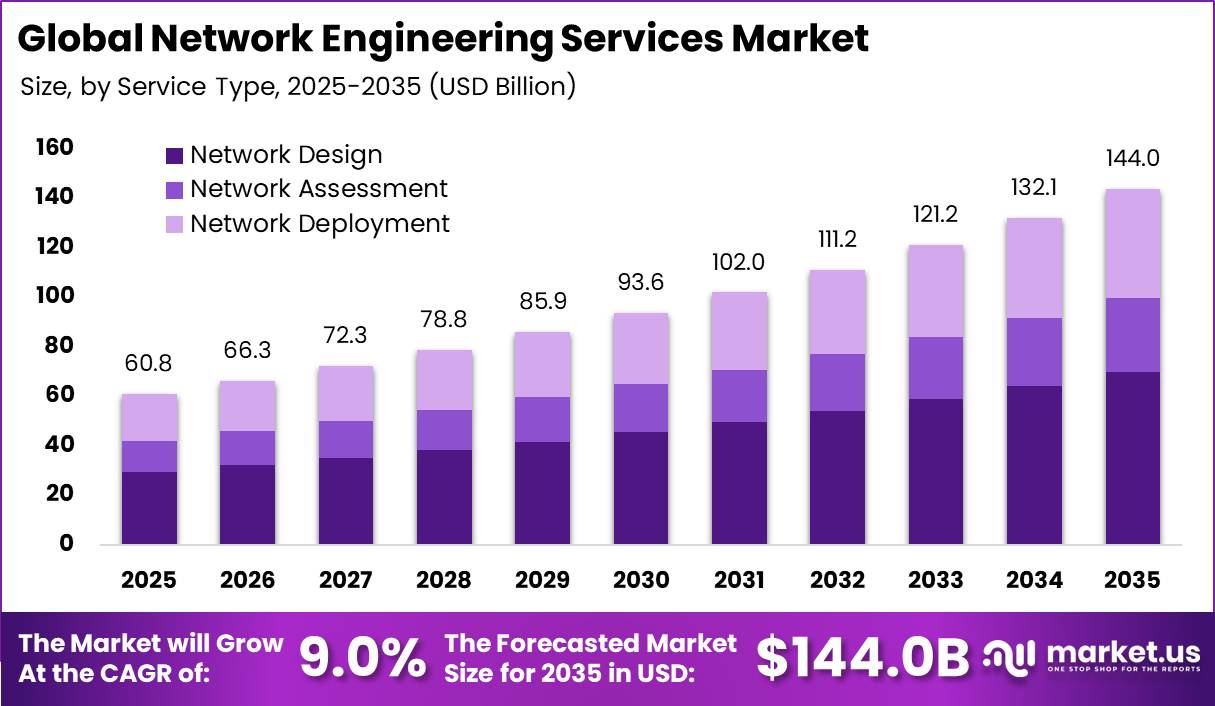
Demand is supported by the continued expansion of global telecom and broadband networks. According to the International Telecommunication Union, the world recorded around 9.2 billion mobile-cellular subscriptions in 2025, equivalent to 112 subscriptions per 100 people. Fixed-broadband subscriptions have also increased at an average rate of 5.2% per year over the past 5 years.
In addition, nearly 6.0 billion people, or 74% of the global population, were using the internet in 2025. This growing digital user base is increasing network traffic and encouraging telecom operators, enterprises, cloud providers, and governments to invest in network design, capacity planning, fiber deployment, cloud integration, performance testing, and cybersecurity.
Ericsson estimated around 370 million 5G subscriptions in the region at the end of 2025, representing 79% of mobile subscriptions, with the total expected to reach nearly 460 million by 2031. GSMA expects 5G to account for 90% of regional mobile connections by 2030, compared with 55% in 2023, and contribute more than USD 210 billion to the economy. The U.S. BEAD program also provides USD 42.4 billion for broadband infrastructure, targeting around 7 million homes and businesses.
Key Takeaway
- The Network Engineering Services Market was valued at USD 60.8 billion in 2025 and is projected to reach USD 144.0 billion by 2035, growing at a 9.0% CAGR.
- Network Design held the leading service-type position with a 48.5% share, driven by growing data-centre scale and complexity.
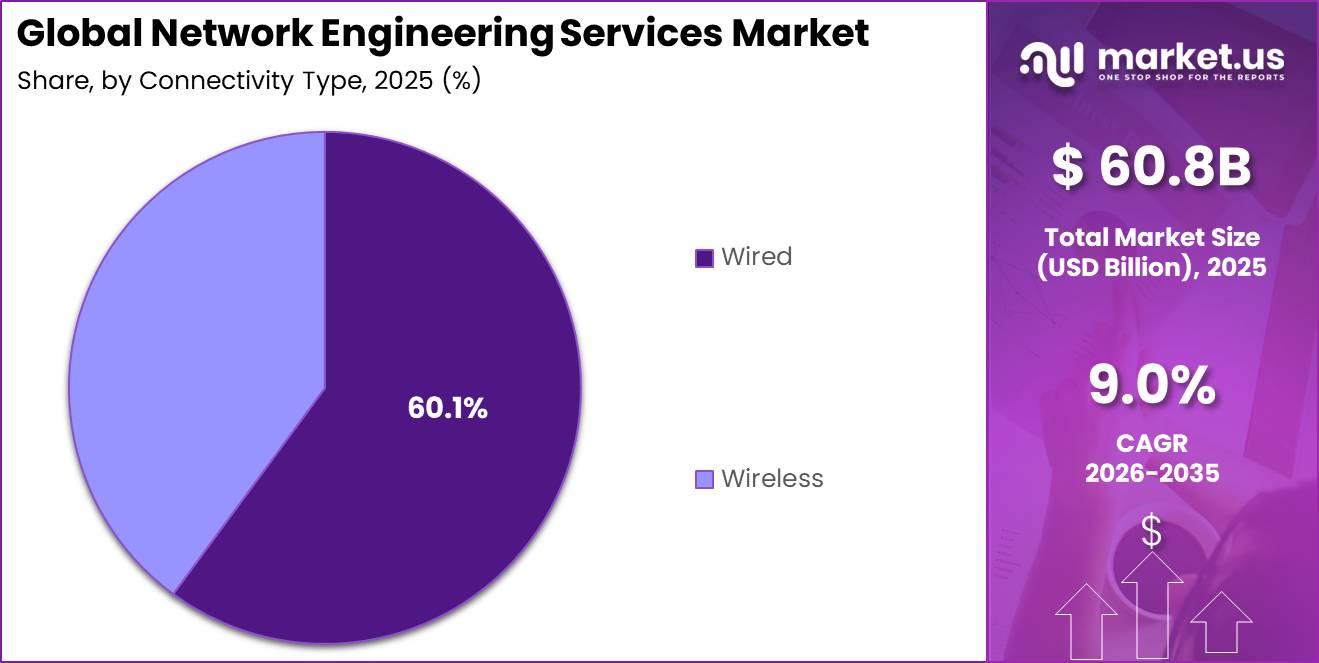
- Wired connectivity dominated with a 60.1% share, supported by expanding fiber and cable infrastructure.
- Large enterprises accounted for 64.9% of the market, reflecting complex, large-scale network and cloud needs.
- IT and telecom was the leading industry vertical with a 20.5% share, driven by rising fixed- and mobile-broadband traffic.
- North America led the market in 2025 with more than 35.0% share and approximately USD 21.3 billion in revenue.
By Service Type
Network Design held a dominant position in the Network Engineering Services Market, accounting for a 48.5% share, as network expansion and modernization projects usually begin with architecture planning, capacity assessment, and route selection. Demand for these services is increasing as data centres become larger, denser, and more technically complex.
The International Energy Agency estimated that global data-centre electricity consumption reached around 415 terawatt-hours in 2024, representing nearly 1.5% of global electricity demand, and is expected to rise to about 945 terawatt-hours by 2030. In addition, a single hyperscale AI data centre can require 100 megawatts or more of power capacity.
By Connectivity Type
The Wired Connectivity segment held a dominant position in the Network Engineering Services Market, accounting for a 60.1% share, as fiber and cable networks remain the foundation of reliable, high-capacity digital infrastructure. OECD data show that fiber accounted for 44.6% of all fixed-broadband connections across member countries by June 2024, increasing from 41.0% a year earlier.
The European Commission also reported that fiber-to-the-premises coverage reached 74.1% of EU households in 2025, while fixed very-high-capacity network coverage increased to 85.6%. Expanding these networks requires continuous engineering support, including fiber-route surveys, civil planning, optical-power calculations, cable installation, splicing, testing, switch configuration, and final network acceptance.
By Organization Size
Large Enterprises held a dominant position in the Network Engineering Services Market, accounting for a 64.9% share, as their large operating networks, cloud workloads, and security needs require complex and highly reliable infrastructure. Eurostat reported that 84.7% of EU large enterprises purchased cloud-computing services in 2025, compared with 66.8% of medium-sized companies.
In 2023, around 78% of large enterprises used cloud services, versus 44% of SMEs, showing a clear gap in digital infrastructure adoption. Large organizations often need to connect headquarters, branch offices, factories, remote employees, data centres, and cloud platforms through secure wired, wireless, and software-defined networks.
This creates strong demand for network architecture, bandwidth planning, data-centre connectivity, segmentation, cybersecurity integration, and 24/7 monitoring. OECD findings also show that large firms are about 4 times more likely than small firms to adopt cloud computing and around 3 times more likely to use Internet of Things technologies.
By Industry Vertical
The IT and Telecom segment held a dominant position in the Network Engineering Services Market, accounting for a 20.5% share, as these industries develop, operate, and maintain the digital networks used by businesses and consumers. According to the ITU, global fixed-broadband traffic reached 6.0 zettabytes in 2024, increasing from 5.1 zettabytes in 2023, while mobile-broadband traffic rose to nearly 1.3 zettabytes from 1.0 zettabytes.
This rapid increase in data traffic is encouraging telecom operators and IT infrastructure providers to expand fiber capacity, improve IP routing, strengthen wireless backhaul, and increase data-centre connectivity. OECD data also show that telecom-sector investment across member countries increased by 18% between 2018 and 2023, while fixed and mobile broadband capital expenditure reached USD 317.6 billion in 2022.
Key Market Segments
By Service Type
- Network Design
- Network Assessment
- Network Deployment
By Connectivity Type
- Wired
- Wireless
By Organization Size
- Small and Medium-Sized Enterprises
- Large Enterprises
By Industry Vertical
- IT and Telecomm
- Media and Entertainment
- BFSI
- Manufacturing
- Retail
- Healthcare
- Government
- Education
- Other
Geopolitical Impact Analysis
Geopolitical tensions are changing the cost and supply environment of the Network Engineering Services Market because network projects depend heavily on imported routers, switches, fiber components, semiconductors, and related hardware. The World Trade Organization reported that the global average applied MFN tariff rate increased from 5.7% to 6.3% in 2025, while the U.S. simple average applied MFN tariff rose sharply from 3.4% in 2023 to 11.2% in 2025.
Chinese-origin semiconductors, wafers, and polysilicon also became subject to a 50% Section 301 duty from January 2025, increasing hardware input costs. In addition, U.S. Section 232 measures introduced 50% tariffs on steel and aluminum and 25% tariffs on several finished electronics categories from August 2025, raising costs for network racks, cabinets, enclosures, and supporting equipment.
Supply-chain pressure has also increased due to Red Sea disruptions. UNCTAD reported that Suez Canal tonnage remained around 70% below 2023 levels through mid-2025, forcing vessels to use longer routes around the Cape of Good Hope. Global seaborne trade growth also slowed to only 0.5% in 2025, increasing freight uncertainty and equipment delivery times.
Energy costs add further pressure, with the IEA reporting that EU wholesale electricity prices increased by roughly 30% year-over-year in H1 2025, while U.S. prices rose about 40%. These conditions are encouraging network engineering providers to diversify suppliers, increase local sourcing, redesign procurement strategies, and adjust service pricing to manage higher hardware, freight, and operating costs.
Regional Analysis
North America led the Network Engineering Services Market in 2025, accounting for 35.0% of global revenue, or approximately USD 21.3 billion. The region benefits from a strong presence of major cloud providers, telecom operators, enterprise data centres, and government-backed digital infrastructure programs.
Its mature network environment also creates steady demand for modernization, including high-capacity fiber, secure enterprise networks, cloud interconnection, data-centre switching, automation, and managed network services. According to the OECD, fixed-broadband penetration across member countries reached 36.5 subscriptions per 100 inhabitants in 2025, with fiber becoming an important part of advanced digital infrastructure.
Asia Pacific is expected to be the fastest-growing regional market due to its large base of underdeveloped and expanding digital networks. ITU data show that Asia-Pacific recorded 97 mobile-broadband subscriptions per 100 inhabitants in 2024 and 21 fixed-broadband subscriptions per 100 inhabitants. However, only 25% of the regional population lived within 10 km of a fiber-optic node in 2023, indicating significant room for fiber and backhaul expansion.
Around 66% of the region’s population was online in 2024, while internet penetration increased at an average annual rate of 10.7% since 2005, compared with the 8.0% global rate. These trends support strong demand for network planning, installation, fiber engineering, wireless integration, and managed services.
Key Regions and Countries
North America
- US
- Canada
Europe
- Germany
- France
- The UK
- Spain
- Italy
- Rest of Europe
Asia Pacific
- China
- Japan
- South Korea
- India
- Australia
- Rest of APAC
Latin America
- Brazil
- Mexico
- Rest of Latin America
Middle East & Africa
- GCC
- South Africa
- Rest of MEA
Market Dynamics
Drivers
| Driver | (~) % CAGR | Geographic Relevance | Impact Timeline |
|---|---|---|---|
| AI Data-Center Network Buildout | +2.1% | Global; strongest in North America, China, and Europe | Short term (2 years or less) |
| Enterprise Cloud Network Modernization | +1.5% | North America, Europe, Asia Pacific | Short term (2 years or less) |
| Carrier Core Network Upgrades | +1.2% | Global | Medium term (2 to 4 years) |
| Cybersecurity Architecture Demand | +0.9% | Global | Short term (2 years or less) |
| Industrial Edge Connectivity | +0.7% | Asia Pacific, Europe, North America | Medium term (2 to 4 years) |
AI Data-Center Network Buildout
AI infrastructure is shifting network engineering toward high-density, low-latency network design, increasing demand for switch fabrics, optical interconnects, resilient routing, and automated traffic management.
The IEA reported that global data-centre electricity use reached 415 TWh in 2024, equal to 1.5% of global electricity demand, and could rise to around 945 TWh by 2030. The United States, China, and Europe accounted for about 45%, 25%, and 15% of global data-centre electricity demand in 2024, respectively.
The IEA also estimated global data-centre investment at nearly USD 500 billion in 2024. This expansion creates recurring opportunities in network architecture, fiber design, commissioning, observability, and optimization services, supporting the market’s baseline 9.0% CAGR beyond one-time hardware installation.
Restraints
| Restraint | (~) % CAGR | Geographic Relevance | Impact Timeline |
|---|---|---|---|
| Data-Center Grid Connection Limits | -1.8% | North America, Europe, China | Medium term (2 to 4 years) |
| Public Telecom CapEx Constraints | -1.3% | Europe, Latin America, Africa | Short term (2 years or less) |
| Import Tariff Cost Inflation | -1.0% | North America, Europe, Asia Pacific | Short term (2 years or less) |
| High Borrowing Cost Pressure | -0.8% | Global | Short term (2 years or less) |
| Sovereign Procurement Delays | -0.6% | Emerging markets | Medium term (2 to 4 years) |
Data-Center Grid Connection Limits
Power availability is becoming a direct restraint on network engineering projects because data centres, optical networks, cooling systems, and high-performance computing infrastructure cannot be fully deployed without sufficient grid capacity.
The IEA reported that data centres consumed around 415 TWh of electricity in 2024 and could require nearly 945 TWh by 2030, increasing their share of global electricity demand from 1.5% to just under 3%.
AI-focused data-centre electricity use is also expected to increase by more than 4 times by 2030. The United States accounted for about 45% of global data-centre electricity consumption in 2024, where grid connection delays and transmission constraints can postpone network installations.
The IEA expects electricity generation for data centres to exceed 1,000 TWh by 2030, forcing operators to align network projects with available power capacity and delaying high-value integration work.
Challenges
| Challenge | (~) % CAGR | Geographic Relevance | Mitigation Horizon |
|---|---|---|---|
| Advanced Skills Availability | -1.4% | Global | Medium term (2 to 4 years) |
| Multi-Vendor Network Complexity | -1.1% | Global | Medium term (2 to 4 years) |
| Optical Component Lead Times | -0.9% | Global | Short term (2 years or less) |
| Cybersecurity Compliance Burden | -0.7% | North America, Europe, Asia Pacific | Medium term (2 to 4 years) |
| Legacy Infrastructure Integration | -0.6% | Global | Long term (4 years or more) |
Advanced Skills Availability
Network engineering growth faces execution challenges as modern projects require skills across cloud networking, automation, optical systems, cybersecurity, and AI data-centre infrastructure. ISC2 reported that 59% of respondents faced critical or significant cybersecurity skills gaps in 2025, up from 44% in 2024, while only 34% said their organizations had adequate cybersecurity staffing.
The shortage is also linked to funding and talent availability, with 33% of organizations lacking enough budget to properly staff security teams and 29% unable to afford workers with the required skills. These gaps increase labor costs, extend project timelines, and limit simultaneous deployments.
Greater use of automation, standardized architectures, certification programs, and offshore operations can help reduce an estimated -1.4% drag on achievable market growth.
Opportunities
| Opportunity | (~) % CAGR | Geographic Relevance | Execution Window |
|---|---|---|---|
| Managed Network Automation Platforms | +1.7% | Global | Medium term (2 to 4 years) |
| Private Industrial 5G Networks | +1.3% | Asia Pacific, Europe, North America | Medium term (2 to 4 years) |
| Grid-Aware Data-Center Networking | +1.1% | North America, Europe, China | Long term (4 years or more) |
| Rural Fiber Operations Outsourcing | +0.9% | North America, Asia Pacific, Africa | Long term (4 years or more) |
| Sovereign Cloud Network Services | +0.8% | Europe, Middle East, Asia Pacific | Medium term (2 to 4 years) |
Managed Network Automation Platforms
Managed network automation remains a future growth opportunity as many providers still depend on labor-based deployment rather than subscription-led operations and predictive network management. Eurostat reported that 52.74% of EU enterprises used paid cloud services in 2025, while OECD data show cloud computing adoption averaged 49% among firms with at least 10 employees across measured economies.
The opportunity is supported by rising infrastructure complexity. The IEA expects data-centre electricity demand to increase from 415 TWh in 2024 to around 945 TWh by 2030, increasing the need for traffic optimization and capacity control. Automated incident handling, configuration checks, and energy-aware routing can reduce labor requirements and support recurring service revenue.
Key Players Analysis
Tier-1 competition in the Network Engineering Services Market is led by Cisco, Huawei, Ericsson, and the combined HPE–Juniper platform, which together are estimated to represent around 45–55% of addressable network engineering-related spending. Their strength comes from broad portfolios across routing, switching, wireless, optical, cloud, and telecom infrastructure.
Huawei reported CNY 880.9 billion (USD 126.0 billion) in 2025 revenue, including CNY 375.0 billion from ICT Infrastructure. The company invested CNY 192.3 billion, equal to 21.8% of revenue, in R&D and employed 114,000 R&D staff, representing 53.7% of its workforce. Ericsson spent SEK 48.9 billion on R&D in 2025 and held more than 60,000 granted patents, supporting its position in radio access, core networks, automation, and telecom engineering.
HPE strengthened its networking position after completing the approximately USD 13.4 billion acquisition of Juniper in July 2025. HPE generated USD 34.3 billion in FY2025 revenue, while networking revenue increased by USD 2.3 billion, or 51.1%. Fourth-quarter networking revenue reached USD 2.8 billion, with a 23.0% operating margin.
Tier-2 players such as TCS, Infosys, Wipro, Cyient, and Konica Minolta compete mainly through managed services and systems integration. TCS exceeded USD 30 billion in FY2025 revenue and held 4,820 granted patents, while Infosys reported INR 162,990 crore in revenue and INR 34,549 crore in free cash flow.
Top Key Players in the Market
- Cisco Systems, Inc.
- Huawei Technologies Co., Ltd.
- Telefonaktiebolaget LM Ericsson
- Juniper Networks, Inc.
- Hewlett Packard Enterprise (HPE)
- Tata Consultancy Services Limited
- Infosys Limited
- Wipro Limited
- Konica Minolta, Inc.
- Cyient
Recent Developments
- In 2025, HPE completed its acquisition of Juniper Networks in July, significantly expanding its position in AI-native and enterprise networking. HPE reported total purchase consideration of USD 13.6 billion, including USD 13.3 billion paid for Juniper common stock and USD 239 million for replacement equity awards.
- In 2025, Ericsson secured an 8-year, SEK 12.5 billion partnership with VodafoneThree UK in September, valued at almost GBP 1 billion. Ericsson will supply the majority of VodafoneThree’s next-generation mobile network and the complete nationwide core network, including 5G Standalone radio, core, cloud-native infrastructure, and software.
Report Scope
| Report Features | Description |
|---|---|
| Market Value (2025) | USD 60.8 Billion |
| Forecast Revenue (2035) | USD 144.0 Billion |
| CAGR (2026-2035) | 9.0% |
| Base Year for Estimation | 2025 |
| Historic Period | 2020-2024 |
| Forecast Period | 2026-2035 |
| Report Coverage | Revenue Forecast, Market Dynamics, Competitive Landscape, Recent Developments |
| Segments Covered | By Service Type – (Network Design, Network Assessment, Network Deployment); By Connectivity Type – (Wired, Wireless); By Organization Size – (Small and Medium-Sized Enterprises, Large Enterprises); By Industry Vertical – (IT and Telecomm, Media and Entertainment, BFSI, Manufacturing, Retail, Healthcare, Government, Education, Other) |
| Regional Analysis | North America – US, Canada; Europe – Germany, France, The UK, Spain, Italy, Rest of Europe; Asia Pacific – China, Japan, South Korea, India, Australia, Singapore, Rest of APAC; Latin America – Brazil, Mexico, Rest of Latin America; Middle East & Africa – GCC, South Africa, Rest of MEA |
| Competitive Landscape | Cisco Systems, Inc., Huawei Technologies Co., Ltd., Telefonaktiebolaget LM Ericsson, Juniper Networks, Inc., Hewlett Packard Enterprise (HPE), Tata Consultancy Services Limited, Infosys Limited, Wipro Limited, Konica Minolta, Inc., Cyient |
| Customization Scope | Customization for segments and region/country-level will be provided. Moreover, additional customization can be done based on the requirements. |
| Purchase Options | We have three licenses to opt for: Single User License, Multi-User License (Up to 5 Users), Corporate Use License (Unlimited Users and Printable PDF) |





























