
Quick Navigation
Market Overview
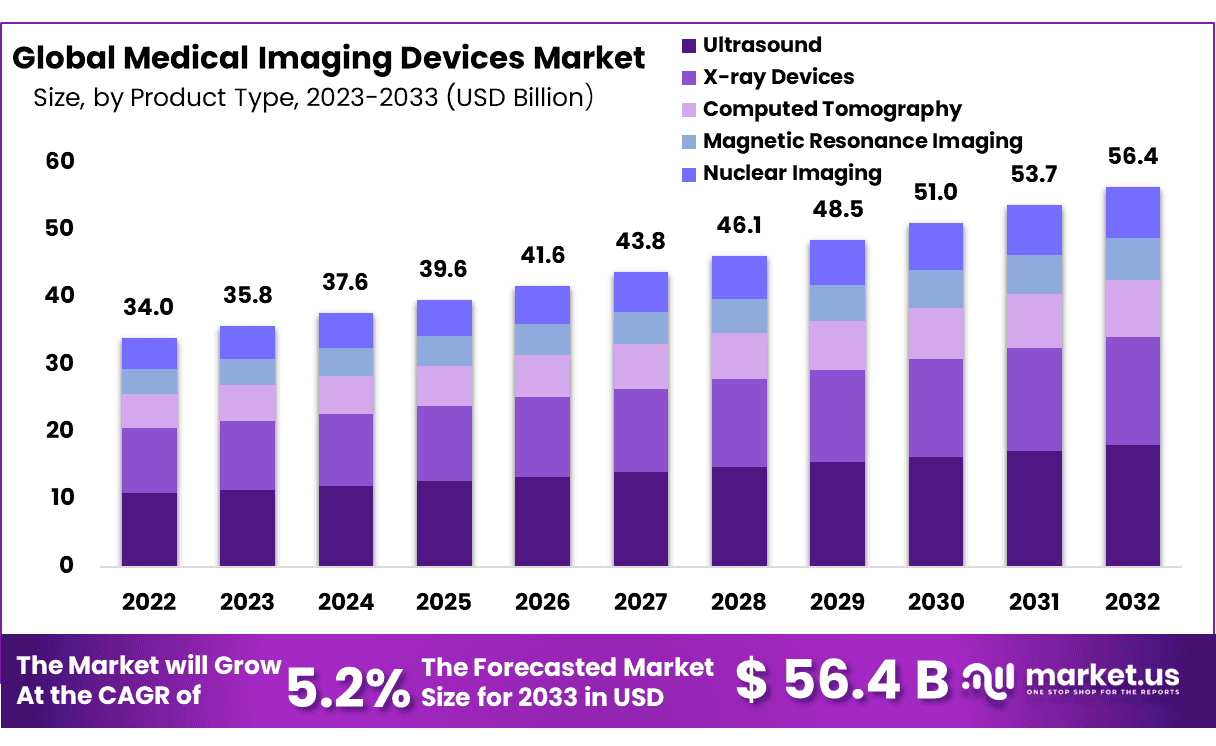
The Global Medical Imaging Devices Market size is expected to be worth around USD 56.4 Billion by 2033 from USD 34.0 Billion in 2023, growing at a CAGR of 5.2% during the forecast period from 2024 to 2033.
Medical Imaging comprises a number of different technologies that are used to generate three-dimensional, high-resolution images of the body for diagnosing, monitoring, or treating medical conditions. It is one of the most astonishing fields that have transmuted the face of clinical medicine during the last millennium. Modalities such as magnetic resonance imaging (MRI), radiography, nuclear medicine, tomography, ultrasound, photoacoustic imaging, etc. constitute medical imaging.
Every imaging modality shows a medical condition by some form of contrast so that the feature of interest, such as a tumor, can be identified in the image and examined by a trained radiologist. All imaging modalities degrade the image in some way or the other. Degradation involves loss of detail or blur and unwanted contrast or noise. Nevertheless, medical imaging plays a vital role in initiatives to improve public health for all population groups as it shows the image of the human body for diagnostic and treatment purposes.
Geriatric care has become a complex and multidisciplinary effort. The use of cutting-edge technology and treatment is better for the proper care of the patients. Specifically, the role of radiology has expanded rapidly in geriatric medicine due to the necessity of definitive imaging of complex symptomatology and the high prevalence of the disease.
Therefore, the constantly growing geriatric population is one of the significant factors in driving the market growth. The capabilities of medical imaging have outwardly increased. Due to the necessary research and technological development, there have been several advancements in medical imaging technology. Technological advancements such as the introduction of Open and Portable MRIs, the use of 3D (and potentially even 4D) technologies in diagnostic radiology, digital Mammography, etc. are helping in giving more accurate diagnoses and bettering patient care. Therefore, technology advancements in diagnostic imaging are expected to support market growth.
*Actual Numbers Might Vary In The Final Report
Key Takeaways
- Market Size & Growth: Medical Imaging Devices Market size is expected to be worth around USD 56.4 Billion by 2033 from USD 34.0 Billion in 2023, growing at a CAGR of 5.2%.
- Product Type Analysis: Ultrasound devices dominate the Medical Imaging Devices Market with 32% share in 2023.
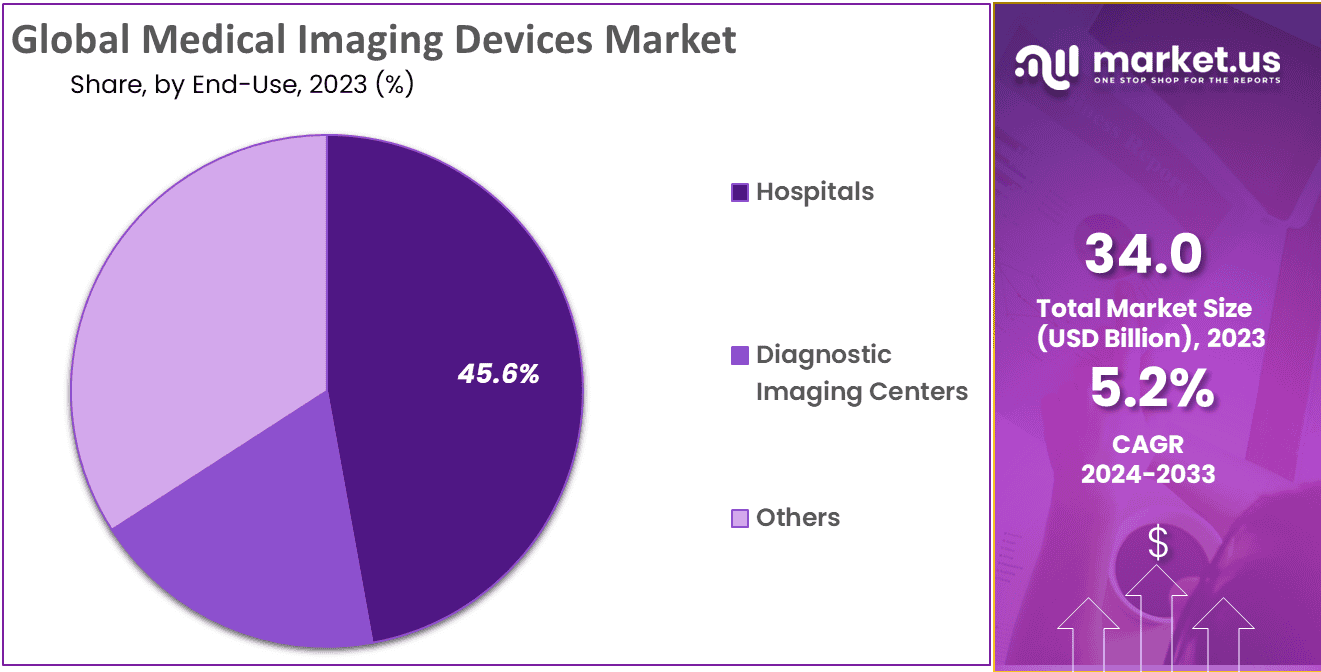
- End-use Analysis: Hospitals account for an impressive 45.6% share in the Medical Imaging Devices Market in 2023.
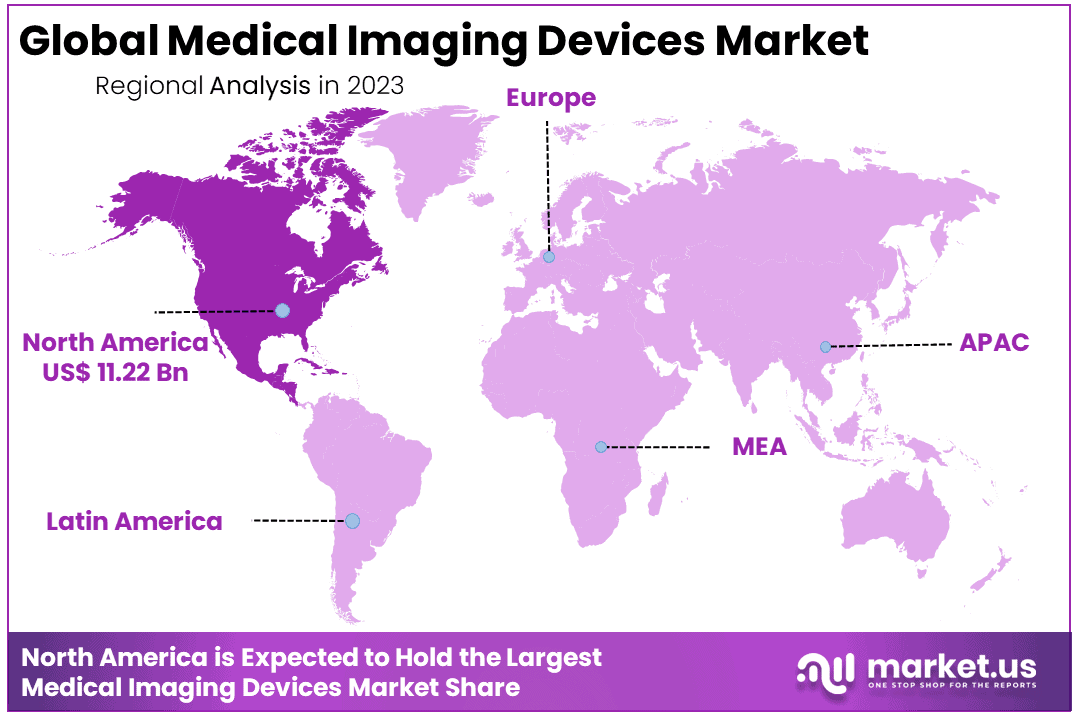
- Regional Analysis: North America dominate 33% of the market share, and is responsible for the majority of shares. USD 11.22 Billion in revenues.
- Personalized medicine: Medical imaging is being used to develop personalized treatment plans for patients. This is being made possible by the use of AI and ML to analyze patient data and identify patterns.
- Point-of-care imaging: Portable and affordable medical imaging devices are becoming increasingly popular. This is making it possible to perform imaging studies in resource-limited settings and in the home.
- Image-guided therapy: Medical imaging is being used to guide minimally invasive therapies. This is making it possible to deliver more precise and effective treatments.
Product Type Analysis
Ultrasound devices dominate the Medical Imaging Devices Market with 32% share, reflecting their wide adoption and effectiveness as diagnostic imaging solutions. This evidence highlights ultrasound’s widespread usage for diagnostic imaging purposes. Ultrasound devices, known for their noninvasiveness and versatility, contribute significantly to many medical fields from obstetrics to cardiology. Healthcare professionals trust and prefer ultrasound because of its diagnostic abilities and patient-friendly features, reflecting their preference of this technology over others on the market.
Moreover, low–cost diagnostic imaging equipment such as ultrasound and X-ray systems installations is increasing in emerging economies such as China and India. High affordability is the major reason for a large number of installations. Further, increasing access to ultrasound and X-ray imaging with a rise in disposable income is helping the market growth in emerging economies. Therefore, increasing adoption of medical imaging devices in emerging economies is creating lucrative opportunities for market growth in emerging economies.
Furthermore, ultrasound devices play an integral part in further developing medical imaging technologies and meeting various diagnostic needs across healthcare. With its strong market dominance reflects healthcare professionals trust for ultrasound devices as a diagnostic solution and their preference among their colleagues within healthcare facilities. As healthcare evolves so too does ultrasound’s continued market dominance demonstrate their vital role.
End-use Analysis
Hospitals account for an impressive 45.6% share in the Medical Imaging Devices Market, reflecting their crucial role in adopting advanced imaging technology solutions. As primary healthcare institutions, hospitals rely on various imaging devices for accurate diagnoses and informed medical decisions. providing assessment services across departments from radiology to emergency care.
Hospitals’ selection of advanced imaging technologies reflects their dedication to providing excellent patient care and optimizing medical outcomes. As medical imaging advances, hospitals remain central in using and incorporating innovative devices, cementing their position within the Medical Imaging Devices Market landscape.
*Actual Numbers Might Vary In The Final Report
Key Market Segments
Product Type
- X-ray Devices
- Ultrasound
- Computed Tomography
- Magnetic Resonance Imaging
- Nuclear Imaging
End-use
- Hospitals
- Diagnostic Imaging Centers
- Others
Driver
Innovation and Technological Advancements
Medical imaging market development can be traced back to an appreciation of technological progress within imaging equipment. Modalities like Magnetic Resonance Imaging (MRI), Computed Tomography (CT), and ultrasound have greatly advanced diagnostic capabilities, with integration of cutting-edge algorithms such as Artificial Intelligence (AI) and machine learning (ML) applications playing an increasingly vital role in improving its precision and efficiency – helping healthcare providers make more precise diagnoses than ever.
Rising Demand for Noninvasive Diagnostic Procedures
Rising demand for non-invasive diagnostic procedures is another force shaping the medical imaging devices. Patients and healthcare providers increasingly opting for imaging methods that reduce surgical interventions like biopsies. Modalities like ultrasound and MRI which offer detailed images without surgery have gained prominence among healthcare providers; this trend can especially be observed within oncology, cardiology and neurology specialities where noninvasive imaging methods play a vital part in early diagnosis and treatment planning.
Trend
Sway Toward Point-of-Care Imaging (POC) Imaging
One key trend driving the medical imaging devices market is the increasing ubiquity of point-of-care (POC) imaging solutions, or portable and compact imaging devices, at point-of-care (POC). POC devices allow for on-the-spot diagnostics that reduce decision-making times considerably; their usage has become prevalent throughout emergency medicine, critical care and remote healthcare settings for quicker patient management and faster decision-making processes.
Integrating Artificial Intelligence (AI) in Imaging
Artificial Intelligence (AI) has emerged as an increasingly prevalent trend in medical imaging. AI algorithms are being utilized to process complex imaging data and aid with abnormality identification as well as quantitative assessments. Machine learning algorithms enhance image interpretation speed and accuracy resulting in enhanced diagnostic outcomes; AI-powered medical imaging not only speeds up diagnosis processes but also contributes towards personalized, precision medicine practices.
Restraints
Financial Restraints to Adoption
Cost associated with advanced medical imaging devices poses an insurmountable barrier to market growth. Healthcare facilities located in developing regions often find investing in cutting-edge imaging technologies daunting and thus restrict accessibility of advanced services and the widespread adoption of cutting-edge devices.
Operational Costs and Training Requirements
Apart from initial capital investments, operational expenses and training needs can significantly add to healthcare providers’ expenses. Maintenance, calibration, and regular updates to medical imaging equipment need ongoing expenditures while training healthcare providers how to operate and interpret results from sophisticated imaging devices increases costs associated with implementation.
Opportunity
Telecommunication and Remote Imaging Services are now available and they represent an opportunity
Telemedicine presents an enormous opportunity for the medical imaging devices market. Remote imaging services allow patients to undergo diagnostic procedures without visiting physical healthcare facilities – an especially welcome feature in underserved rural or underserved areas, providing greater accessibility while decreasing burden on centralized institutions.
Regional Analysis
North America dominate 33% of the market share, and is responsible for the majority of shares. USD 11.22 Billion in revenues from Medical Imaging Devices Market in 2023. The availability of modern healthcare facilities within hospitals and diagnostic centers along with the increasing awareness among patients of the benefits from early detection will drive the market’s trend. In addition, initiatives by the government and reimbursement policies that support medical imaging have prompted healthcare professionals to invest in cutting-edge imaging technologies, which in turn has fueled the expansion of regional industries.
*Actual Numbers Might Vary In The Final Report
Key Regions and Countries
North America
- The US
- Canada
- Mexico
Western Europe
- Germany
- France
- The UK
- Spain
- Italy
- Portugal
- Ireland
- Austria
- Switzerland
- Benelux
- Nordic
- Rest of Western Europe
Eastern Europe
- Russia
- Poland
- The Czech Republic
- Greece
- Rest of Eastern Europe
APAC
- China
- Japan
- South Korea
- India
- Australia & New Zealand
- Indonesia
- Malaysia
- Philippines
- Singapore
- Thailand
- Vietnam
- Rest of APAC
Latin America
- Brazil
- Colombia
- Chile
- Argentina
- Costa Rica
- Rest of Latin America
Middle East & Africa
- Algeria
- Egypt
- Israel
- Kuwait
- Nigeria
- Saudi Arabia
- South Africa
- Turkey
- United Arab Emirates
- Rest of MEA
Key Players Analysis
Major players in the global Medical Imaging Devices Market are involved in the process of obtaining approvals for regulatory approvals, the development of new products with the latest technology, introduction of new products and collaboration agreements and acquisitions in collaboration with different companies.These strategies will increase the size of the market. Some expansion strategies used by the players in the world marketplace for equipment used in medical imaging include
Market Key Players
- GE Healthcare
- Koninklijke Philips N.V.
- Siemens Healthineers
- Canon Medical Systems Corporation
- Mindray Medical International
- Esaote
- Hologic, Inc.
- Samsung Medison Co., Ltd.
- Koning Corporation
- PerkinElmer Inc.
- FUJIFILM VisualSonics Inc.
- Cubresa Inc.
Recent Developments
- January 2023: GE Healthcare announced the launch of its new MRI system, the SIGNA Voyager, which is designed to provide faster and more accurate imaging.
- February 2023: Koninklijke Philips N.V. announced the launch of its new ultrasound system, the Affiniti 70, which is designed to provide a more portable and affordable option for ultrasound imaging.
- April 2023: Canon Medical Systems Corporation announced the launch of its new CT scanner, the Aquilion Prime SP, which is designed to provide a more comfortable and patient-friendly scanning experience.
- August 2023: Esaote announced the launch of its new ultrasound system, the MyLab X5, which is designed to provide a more ergonomic and user-friendly ultrasound system.
Report Scope
| Report Features | Description |
|---|---|
| Market Value (2023) | USD 34.0 Billion |
| Forecast Revenue (2033) | USD 56.4 Billion |
| CAGR (2024-2033) | 5.2% |
| Base Year for Estimation | 2023 |
| Historic Period | 2018-2022 |
| Forecast Period | 2024-2033 |
| Report Coverage | Revenue Forecast, Market Dynamics, Competitive Landscape, Recent Developments |
| Segments Covered | Product Type-(X-ray Devices, Ultrasound, Computed Tomography, Magnetic Resonance Imaging, Nuclear Imaging); End-use-(Hospitals, Diagnostic Imaging Centers, Others) |
| Regional Analysis | North America-US, Canada, Mexico;Europe-Germany, UK, France, Italy, Russia, Spain, Rest of Europe;APAC-China, Japan, South Korea, India, Rest of Asia-Pacific;South America-Brazil, Argentina, Rest of South America;MEA-GCC, South Africa, Israel, Rest of MEA |
| Competitive Landscape | GE Healthcare, Koninklijke Philips N.V., Siemens Healthineers, Canon Medical Systems Corporation, Mindray Medical International, Esaote, Hologic, Inc., Samsung Medison Co., Ltd., Koning Corporation, PerkinElmer Inc., FUJIFILM VisualSonics Inc., Cubresa Inc., Recent Development |
| Customization Scope | Customization for segments, region/country-level will be provided. Moreover, additional customization can be done based on the requirements. |
| Purchase Options | We have three licenses to opt for: Single User License, Multi-User License (Up to 5 Users), Corporate Use License (Unlimited User and Printable PDF) |
Frequently Asked Questions (FAQ)
Technological advancements, particularly in AI and ML applications, are key drivers.
The global Medical Imaging Devices Market size was estimated at USD 34.0 Billion in 2023 and is expected to reach USD 56.4 Billion in 2033.
The global Medical Imaging Devices Market is expected to grow at a compound annual growth rate of 5.2%. From 2024 To 2033
Some of the key players in the Medical Imaging Devices Markets are GE Healthcare, Koninklijke Philips N.V., Siemens Healthineers, Canon Medical Systems Corporation, Mindray Medical International, Esaote, Hologic, Inc., Samsung Medison Co., Ltd., Koning Corporation, PerkinElmer Inc., FUJIFILM VisualSonics Inc., Cubresa Inc., Recent Development
Increasing adoption of Point-of-Care (POC) imaging and integration of AI for enhanced diagnostics.
The high cost of medical imaging devices, coupled with operational and training expenses, poses significant restraints.
Yes, with the growing focus on telemedicine and the untapped potential in emerging markets.


