


Market Overview
The Global Clinical Trial Imaging Market size is expected to be worth around US$ 3.9 Billion by 2035 from US$ 1.7 Billion in 2025, growing at a CAGR of 8.2% during the forecast period from 2026 to 2035. In 2025, North America led the market, achieving over 41.6% share with a revenue of US$ 0.7 Billion.
Clinical trial imaging plays a critical role in modern drug development by providing standardized imaging data that helps evaluate treatment safety, efficacy, disease progression, and patient response. Advanced imaging techniques such as MRI, CT, PET, ultrasound, and digital pathology are increasingly integrated into clinical trials, particularly in oncology, neurology, cardiovascular diseases, and rare disease research.
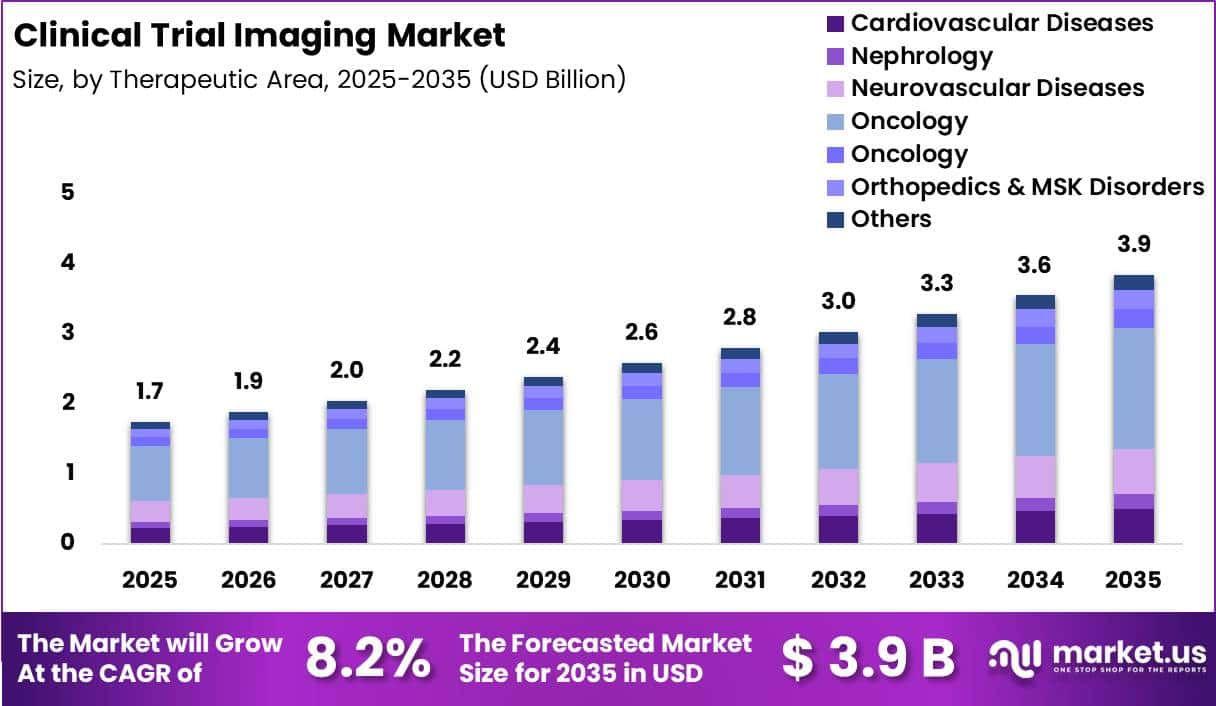
The market is expanding due to the rising number of global clinical trials, growing adoption of precision medicine, and increasing reliance on imaging biomarkers for objective endpoint assessment. The U.S. Food and Drug Administration (FDA) recognizes medical imaging as an essential component of drug development, supporting the use of imaging biomarkers and standardized imaging endpoints to improve clinical trial quality and regulatory decision-making.
According to the U.S. National Cancer Institute (NCI), its National Clinical Trials Network enrolls approximately 20,000 to 25,000 patients annually in clinical treatment and advanced imaging trials across more than 3,100 institutions with the support of 14,000 investigators, highlighting the growing importance of imaging in clinical research.
North America dominated the market in 2025, accounting for over 41.6% of global revenue, supported by advanced healthcare infrastructure, high clinical research activity, and strong regulatory oversight. Increasing investments in AI-enabled image analysis, centralized imaging review, cloud-based imaging platforms, and quantitative imaging biomarkers are further improving trial efficiency and data accuracy.
Additionally, the National Institute on Aging reports that eight Phase III Alzheimer’s disease trials have incorporated imaging and fluid biomarkers to improve participant selection and evaluate treatment response, reflecting the expanding role of imaging across therapeutic areas.
Key Takeaways
- Market Size: Clinical Trial Imaging Market size was US$ 1.7 billion in 2025.The market is estimated to grow to US$ 3.9 billion by 2035.
- Market Share: The Compound Annual Growth Rate (CAGR) of the market from 2026 to 2035 will be 8.2%.
- By Modality: Computed Tomography Scan has the largest market share, accounting for 28.6% of total sales.
- By Therapeutic Area: Oncology, accounting for 45% of total revenue.
- By Services: Project and Data Management leads the segment, accounting for 32.1% of total revenue.
- By End Use: Biotechnology and Pharmaceutical Companies lead the segment, accounting for 46.3% of total revenue.
- Regional: North America is the dominant regional market, accounting for 41.6% of global sales
Modality Segment Analysis
The Computed Tomography (CT) Scan segment dominated the clinical trial imaging market in 2025, accounting for 28.6% of the total market share. CT imaging remains the preferred modality because it provides high-resolution cross-sectional images with fast scan times, making it highly suitable for multicenter clinical trials.
It is extensively used in oncology, cardiology, and pulmonary studies to monitor disease progression, evaluate treatment response, and generate standardized imaging endpoints. The widespread availability of CT scanners across hospitals and research centers also supports consistent imaging protocols and efficient patient enrollment in global studies.
Additionally, advances in low-dose CT technology and AI-assisted image analysis continue to improve diagnostic accuracy while reducing radiation exposure.
Magnetic Resonance Imaging (MRI) followed with 26.9% of the market, driven by its superior soft-tissue visualization and radiation-free imaging capabilities. Ultrasound captured 14.7%, benefiting from its portability and real-time imaging. X-Ray accounted for 13.8%, remaining important for orthopedic and pulmonary clinical trials due to its affordability and accessibility.
Optical Coherence Tomography (OCT) represented 9.4%, mainly supporting ophthalmology research with high-resolution retinal imaging. The Others category, holding 6.6%, includes nuclear imaging and hybrid modalities that are increasingly utilized in specialized clinical research applications.
Therapeutic Area Segment Analysis
The Oncology segment held the largest share of the clinical trial imaging market in 2025, accounting for 45.0% of total revenue. The segment’s leadership is driven by the growing number of global cancer clinical trials that rely heavily on imaging to detect tumors, measure treatment response, assess disease progression, and support regulatory endpoints.
Imaging technologies such as CT, MRI, and PET play a central role in precision oncology by enabling standardized assessments throughout clinical studies. Rising investments in targeted therapies, immunotherapies, and personalized medicine have further increased the demand for advanced imaging services in oncology research.
Neurovascular Diseases represented the second-largest segment with 16.8%, supported by increasing research on stroke, Alzheimer’s disease, and other neurological disorders requiring detailed brain imaging. Cardiovascular Diseases accounted for 13.2%, utilizing imaging to evaluate cardiac structure, vascular function, and treatment outcomes.
Ophthalmology held 7.1%, driven by retinal imaging technologies such as OCT in vision-related studies. Orthopedics & Musculoskeletal (MSK) Disorders captured 6.9%, benefiting from MRI and X-ray applications for bone and joint assessments. Nephrology contributed 5.4%, while the Others category represented 5.6%, covering respiratory, infectious, metabolic, and rare disease clinical trials requiring specialized imaging support.
Services Segment Analysis
The Project and Data Management segment dominated the clinical trial imaging market in 2025, capturing 32.1% of the total market share. This leadership reflects the increasing complexity of global clinical trials and the growing need for centralized management of imaging workflows, patient data, quality assurance, and regulatory compliance.
Project and data management services coordinate image collection, secure storage, standardized processing, and timely delivery of imaging results across multiple trial sites. The adoption of cloud-based platforms, artificial intelligence, and automated workflow solutions has further strengthened this segment by improving operational efficiency, reducing errors, and ensuring consistency in imaging datasets used for regulatory submissions.
Other service segments also contribute significantly to market growth. Image acquisition services remain essential for generating standardized clinical trial images across diverse healthcare settings. Image analysis and interpretation services are expanding due to increasing use of AI-assisted quantitative imaging and independent expert review.
Quality assurance and protocol development services help maintain imaging consistency and compliance with international clinical trial standards. Site training and imaging consultation services support protocol implementation and improve data quality across multicenter studies.
Together, these services enable sponsors to enhance trial efficiency, reduce operational risks, accelerate patient recruitment, and generate reliable imaging endpoints that support successful drug development and regulatory approval.
End Use Segment Analysis
The Biotechnology and Pharmaceutical Companies segment led the clinical trial imaging market in 2025, accounting for 46.3% of the overall market share. These organizations are the primary sponsors of clinical trials and increasingly rely on advanced imaging services to evaluate drug efficacy, monitor patient safety, identify biomarkers, and generate objective clinical endpoints.
The growing investment in oncology, neurology, cardiovascular, and rare disease drug development has significantly increased demand for standardized imaging solutions. Outsourcing imaging operations to specialized contract research organizations also enables biotechnology and pharmaceutical companies to reduce costs, improve operational efficiency, and accelerate global clinical trial execution.
Contract Research Organizations (CROs) represent another major end-user group, providing integrated imaging management, centralized image review, and regulatory support for multinational clinical studies. Academic and research institutes continue to expand imaging-based research programs, particularly in early-stage clinical investigations and translational medicine.
Hospitals and specialty clinics contribute by performing imaging procedures, recruiting patients, and supporting investigator-led studies across multiple therapeutic areas. Government research organizations and public health institutions also participate in imaging-intensive clinical research through collaborative programs and funding initiatives.
Collectively, these end users are driving broader adoption of advanced imaging technologies, digital data platforms, and AI-enabled image analysis to improve trial quality and accelerate therapeutic innovation.
Market Segmentations
By Modality
- Computed Tomography Scan
- Magnetic Resonance Imaging
- Optical Coherence Tomography (OCT)
- Ultrasound X-Ray Others
By Therapeutic Area
- Cardiovascular Diseases
- Nephrology
- Neurovascular Diseases
- Oncology
- Ophthalmology
- Orthopedics & MSK Disorders
- Others
By Services
- System and Technology Support Services
- Reading and Analytical Services
- Project and Data Management
- Operational Imaging Services
- Clinical Trial Design and Consultation Services
By End Use
- Medical Devices Manufacturers
- Contract Research Organizations (CROs)
- Biotechnology and Pharmaceutical Companies
- Academic and Government Research Institutes
- Others
Driver
Imaging Access Expansion Improves Clinical Trial Growth Opportunities
When coverage policy becomes clearer for advanced imaging in high-profile disease areas, sponsors gain better real-world comparability and a stronger post-trial commercialization pathway, which feeds back into protocol design and trial investment.
CMS’s 2023 retirement of the amyloid PET national coverage determination ended the prior coverage-with-evidence-development barrier, and published 2024 national OPPS payment examples for PET/PET-CT show hospital payments around USD 1,354 to USD 1,492 for relevant CPT-coded procedures, giving the market a tangible reimbursement anchor.
Although trial imaging is not reimbursed identically to routine care, reimbursement normalization still matters because it broadens installed-base utilization, supports tracer adoption, and reduces uncertainty around the standard-of-care comparator environment.
This is especially relevant in oncology and neurodegeneration, where advanced imaging can influence inclusion logic, stratification, and downstream health-economic narratives, producing an estimated 0.9% CAGR effect over the medium term.
Regulatory and policy pressure to improve representativeness in clinical research is turning diversity from a soft objective into an operational requirement, and that expands imaging demand indirectly by increasing the number and spread of activated sites.
HHS’s 2024 actions to enhance diversity in clinical research emphasize better representation of affected populations, while FDA’s 2025 diversity action plan draft guidance formalizes expectations around enrollment planning for applicable studies.
For clinical trial imaging, this means more community-based and regional imaging center onboarding, more scanner qualification events, and more variability-management work because broader recruitment footprints bring broader equipment heterogeneity.
The business-model effect is favorable for providers that can run distributed imaging networks with tight protocol governance, and the growth contribution is meaningful in the short term at roughly 0.8% because sponsors increasingly treat inclusive enrollment capability as part of trial feasibility rather than a post hoc remediation step.
| Driver | (~) % Impact on CAGR Forecast | Geographic Relevance | Impact Timeline |
|---|---|---|---|
| Oncology trial density and imaging endpoint expansion | 2.1% | North America core, EU5, Japan, South Korea, China tier-1 sites | Medium term (2-4 years) |
| Decentralized and hybrid trial operating models | 1.4% | North America, EU, UK, Australia, urban APAC corridors | Short term (≤ 2 years) |
| Quantitative biomarker standardization and protocol harmonization | 1.2% | North America core, EU, Japan, select APAC academic hubs | Medium term (2-4 years) |
| AI-assisted reads, workflow automation, and edge-cloud orchestration | 1.0% | North America, EU, Israel, India delivery hubs, Singapore | Short term (≤ 2 years) |
| Imaging access liberalization and reimbursement clarity in priority diseases | 0.9% | U.S. core, Western Europe spill-over, Japan | Medium term (2-4 years) |
| Diversity mandates and broader site-network activation | 0.8% | U.S., EU, UK, Brazil, South Africa, India | Short term (≤ 2 years) |
Challenge
Fragmented Imaging Standards Increase Clinical Trial Complexity
Fragmented imaging standards remain a structural friction point because sponsors running global Phase II–III oncology and neurology trials often juggle 100–250 active sites using heterogeneous MRI, CT, PET, and ultrasound protocols, resulting in 8–12 variant acquisition parameter sets for the same endpoint and a 10–20% spread in quantitative read-outs across vendors and hardware generations.
This heterogeneity forces imaging CROs and data managers to invest heavily in protocol harmonization and site qualification, with central review teams rejecting or requesting repeat scans in 4–7% of imaging visits, stretching median image lock timelines by 10–14 days per interim analysis and increasing per-patient imaging operational cost by an estimated 8–12% compared with trials using standardized acquisition frameworks.
The friction drag of roughly 1.2% on achievable CAGR reflects delayed trial completions, often adding 3–6 months to Phase III timelines, higher central read overheads, and elevated statistical noise around imaging biomarkers, which collectively raise the risk-adjusted cost of capital for image-intensive programs by 20–40 basis points and dampen near-term expansion of complex imaging endpoints despite strong scientific demand.
Strategically, normalization will require sponsors and CROs to converge on reference acquisition standards, such as fixed slice thickness, contrast dosage windows, and motion control protocols, embed automated quality gates at scan upload, and negotiate vendor-neutral calibration procedures.
Given the entrenched installed base of scanners across hospitals and dedicated research centers, a realistic mitigation horizon is 2–4 years before the cumulative effect of harmonized SOPs, updated scanner software, and contractual site performance metrics begins to cut reject rates below 2–3% and restore 0.5–0.8 % points of growth potential.
| Challenge | (~) % CAGR Friction Drag | Geographic Relevance | Mitigation Horizon |
|---|---|---|---|
| Fragmented imaging standards | -1.2% | North America, EU, APAC hubs | Medium term (2-4 years) |
| Cross-border data governance | -0.9% | US–EU, UK, APAC data corridors | Long term (≥ 4 years) |
| Advanced imaging talent gap | -1.0% | Global oncology & neuro centers | Long term (≥ 4 years) |
| AI validation & regulatory burden | -0.8% | US FDA, EMA, major Asian regulators | Medium term (2-4 years) |
| Multi-site workflow complexity | -0.7% | Global Phase II/III networks | Short term (≤ 2 years) |
| Imaging data quality & bias | -0.6% | Oncology, cardiology, CNS trials | Medium term (2-4 years) |
Restraints
Complex Imaging Standards Increase Clinical Trial Development Barriers
Complex, tightening imaging endpoint standards primarily reflect the maturation of FDA, EMA, and national guidance on imaging endpoints, which raise the bar for standardization and quality while embedding new operational complexity that elongates study setup timelines and increases overhead across global imaging-enabled trials.
Since the finalization of the FDA’s Clinical Trial Imaging Endpoint Process Standards, sponsors have had to formalize choices of modality and acquisition protocols, centralized vs. local reads, and imaging charter governance, with typical imaging charters now running 60–120 pages and specifying hundreds of acquisition and interpretation parameters per trial.
ICH E6(R3) and evolving expectations around risk-based quality management further demand that sponsors explicitly identify imaging processes as critical to data integrity, triggering additional monitoring, audit trails, and vendor qualification activities, which together can add 4–6 months of preparatory work before first-patient-in for larger oncology trials with multi-modal imaging.
In parallel, adherence to CDISC standards for imaging data, stricter endpoint definitions, and regulator expectations for central review independent committees require investments in core lab infrastructure, reviewer training, and multi-reader calibration exercises, adding USD 0.5–1.5 million in fixed study setup costs for Phase III programs and increasing per-patient imaging data management costs by 10–20%.
These cumulative requirements reduce the number of mid-size sponsors willing to incorporate complex imaging endpoints, steer some programs toward simpler surrogate measures, and slow the velocity of new imaging-intensive trial launches, resulting in an estimated 1.4 % point drag on the clinical trial imaging market’s CAGR as protocol complexity converts into fewer, more expensive studies rather than broad-based volume growth.
| Restraint | (~) % Impact on CAGR Forecast | Geographic Relevance | Impact Timeline |
|---|---|---|---|
| Escalating imaging economics & reimbursement friction | -1.8% | North America core, EU, Japan | Medium term (2–4 years) |
| Complex, tightening imaging endpoint standards | -1.4% | US, EU, UK, select APAC | Medium term (2–4 years) |
| Data volume, interoperability & archival bottlenecks | -1.2% | Global Tier-1/2 sites | Long term (≥ 4 years) |
| Skilled radiologist & technologist capacity gaps | -1.0% | North America, EU, emerging APAC | Long term (≥ 4 years) |
| Cross-border regulatory & ethics compliance load | -0.9% | US, EU CTR, China, India | Short–Medium term (≤ 4 years) |
| Site technology heterogeneity & cloud/security constraints | -0.7% | Global multi-country trials | Long term (≥ 4 years) |
Opportunity
Structured Imaging Data Exchanges Unlock Clinical Trial Value
The systematic monetization of real-world imaging data for clinical trial enrichment and external control arms is a white-space opportunity because current trial imaging contracts rarely include rights to longitudinal reuse of de-identified datasets across multiple sponsors or indications.
Academic and hospital PACS archives contain tens of millions of CT, MRI, PET, ultrasound, and X-ray studies; even if only 5–10% are trial-grade in terms of annotation and metadata, this still represents an untapped dataset easily exceeding several billion dollars of potential value when fed into simulation tools, synthetic control arm generation, and AI model training.
By 2030, sponsors will face increasing pressure from regulators and payers to use real-world evidence and to reduce patient burden; imaging-derived external controls, propensity-matched cohorts, and historical placebo arms could reduce patient recruitment requirements by 10–20% and shorten enrollment windows by 3–6 months in select oncology and rare disease studies.
A structured exchange model, where imaging service providers, health systems, and sponsors share de-identified data under tokenized access schemes with revenue-sharing, can support new monetization layers such as annual data subscriptions, per-model training fees, or indication-specific imaging bundles, adding 3–5 % points of incremental margin on top of core services.
If these exchanges serve even 15–20% of global Phase II–III programs by 2035, they could add about 2.2 % points of CAGR upside by driving new revenue lines, accelerating trial start-up, and enabling more imaging-dependent study designs that would otherwise be operationally prohibitive.
| Opportunity | (~) % Potential CAGR Upside | Geographic Relevance | Execution Window |
|---|---|---|---|
| AI-native imaging CRO platforms | 3.0% | North America, EU, APAC tier-1 | Short–Medium term |
| Structured real-world imaging & tokenized data exchanges | 2.2% | North America, EU, Japan | Medium term |
| Decentralized & home-based imaging for trials | 1.8% | North America, EU, APAC emerging | Medium–Long term |
| Imaging biomarkers for precision & rare disease trials | 2.5% | North America, EU, China | Short–Medium term |
| Integrated multimodal imaging–omics trial services | 2.0% | North America, EU, Global Big Pharma hubs | Medium–Long term |
| Regulatory-grade imaging quality & compliance platforms | 1.5% | North America, EU, Global | Short term |
Regional Analysis
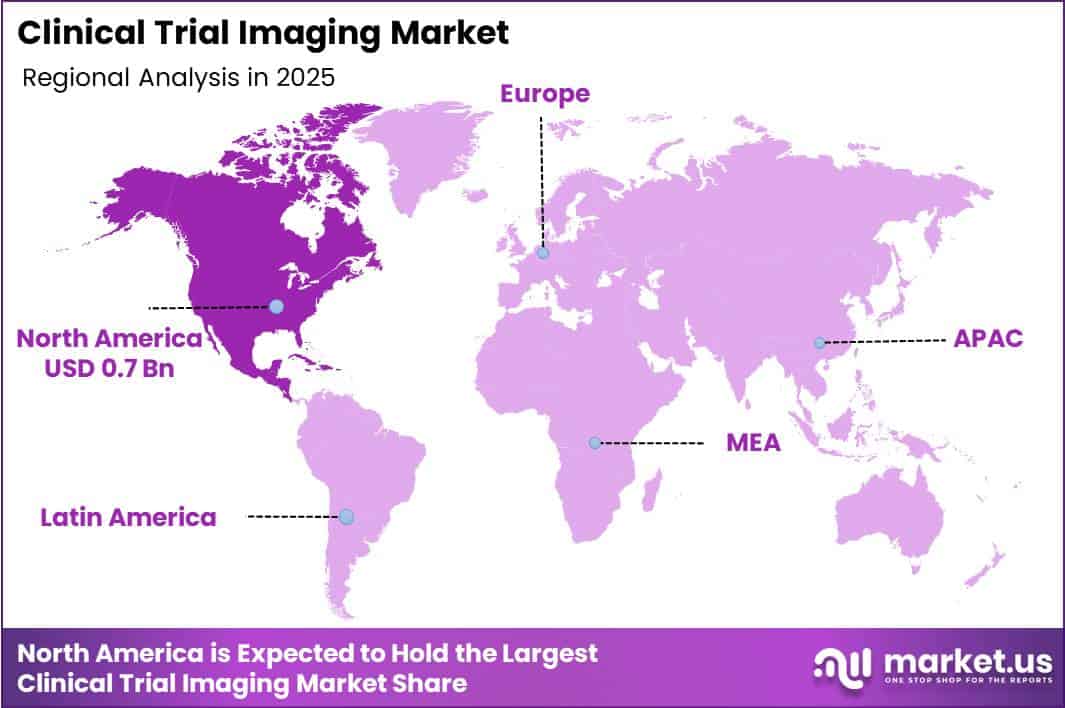
In 2025, North America led the market, achieving over 41.6% share with a revenue of US$0.7 billion.
In 2025, North America region’s leadership is supported by its well-established clinical research ecosystem, advanced healthcare infrastructure, and high concentration of pharmaceutical, biotechnology, and contract research organizations (CROs).
The United States remains the primary contributor, driven by a large number of oncology, neurology, and cardiovascular clinical trials that require standardized imaging for patient selection, disease monitoring, and endpoint evaluation.
Strong adoption of advanced imaging technologies such as MRI, CT, PET, and AI-assisted image analysis further strengthens regional market growth. In addition, stringent regulatory requirements from agencies such as the U.S. Food and Drug Administration (FDA) encourage the use of centralized imaging review and high-quality imaging data management in clinical studies.
Europe represents the second-largest regional market, supported by increasing multinational clinical trials, robust academic research networks, and favorable regulatory collaboration across countries. Meanwhile, the Asia-Pacific region is expected to witness the fastest growth during the forecast period due to expanding clinical trial activities, lower operational costs, improving healthcare infrastructure, and rising investments in pharmaceutical research across China, India, South Korea, and Japan.
Latin America and the Middle East & Africa are also experiencing gradual market expansion, supported by growing participation in global clinical studies, increasing healthcare investments, and improving access to modern diagnostic imaging technologies.
Key Regions and Countries
North America
- The US
- Canada
Europe
- Germany
- France
- The U.K.
- Italy
- Spain
- Russia & CIS
- Rest of Europe
Asia Pacific
- China
- India
- Japan
- South Korea
- ASEAN
- Australia & New Zealand
- Rest of Asia Pacific
Middle East & Africa
- GCC
- South Africa
- Rest of Middle East & Africa
Latin America
- Brazil
- Mexico
- Rest of Latin America
Key Player Analysis
The Clinical Trial Imaging Market is moderately consolidated, with a mix of specialized imaging providers and global clinical research organizations competing through technology innovation, therapeutic expertise, and integrated trial support services.
Competition is centered on delivering standardized imaging protocols, AI-assisted image analysis, centralized image management, and regulatory-compliant workflows that improve trial accuracy and efficiency. Companies continue to invest in digital platforms, cloud-based imaging infrastructure, and advanced analytics to strengthen their market positions while supporting increasingly complex multicenter clinical trials.
Invicro (Konica Minolta), Cardiovascular Imaging Technologies, ICON plc, Imaging Endpoints, Intrinsic Imaging LLC, BioTel Research (Philips), IXICO plc, Median Technologies, Navitas Life Sciences, Parexel International, Prism Clinical Imaging, Radiant Sage LLC, RadMD, Synarc Imaging (merged into Clario), VirtualScopics Inc., and WorldCare Clinical are actively competing by expanding imaging capabilities across oncology, neurology, cardiovascular, and rare disease clinical studies.
Their competitive strategies emphasize continuous R&D in artificial intelligence, machine learning, quantitative imaging biomarkers, and automated image interpretation to improve endpoint precision and operational efficiency. Strategic partnerships with pharmaceutical companies, biotechnology firms, contract research organizations, and healthcare institutions enable broader service portfolios and faster clinical trial execution.
Product innovation focuses on cloud-based image repositories, centralized reading platforms, remote reviewer collaboration, and integrated data management systems that enhance workflow consistency and regulatory compliance.
Workflow integration with electronic clinical systems and decentralized trial models further improves data accessibility, quality assurance, and operational scalability. Ecosystem-based competition is increasingly shaping the market, as companies build interconnected digital platforms combining imaging, analytics, and clinical trial management to deliver comprehensive end-to-end imaging solutions for global sponsors.
Top Key Players
- Invicro (Konica Minolta)
- Cardiovascular Imaging Technologies
- ICON plc
- Imaging Endpoints
- Intrinsic Imaging LLC
- BioTel Research (Philips)
- IXICO plc
- Median Technologies
- Navitas Life Sciences
- Parexel International
- Prism Clinical Imaging
- Radiant Sage LLC
- RadMD
- Synarc Imaging (merged into Clario)
- VirtualScopics Inc.
- WorldCare Clinical
Recent Developments
- In March 2026, ICON plc partnered with Advarra to launch a connected “research-ready” clinical site network designed to improve trial execution, patient recruitment, and site performance.
- In April 2026, Parexel International acquired Vitrana, strengthening its AI-enabled pharmacovigilance technology capabilities and expanding integrated patient safety solutions for clinical development.
- In May 2026, Parexel International launched ParexelAI™, a proprietary AI platform integrating artificial intelligence throughout the clinical development lifecycle to improve study execution, medical writing, pharmacovigilance, and operational efficiency.
Report Scope
| Report Features | Description |
|---|---|
| Market Value (2025) | US$ 1.7 Bn |
| Forecast Revenue (2035) | US$ 3.9 Bn |
| CAGR (2026-2035) | 8.2% |
| Base Year for Estimation | 2025 |
| Historic Period | 2020-2024 |
| Forecast Period | 2026-2035 |
| Report Coverage | Revenue Forecast, Market Dynamics, Competitive Landscape, Recent Developments |
| Segments Covered | By Modality(Computed Tomography Scan, Magnetic Resonance Imaging, Optical Coherence Tomography (OCT), Ultrasound, X-Ray, Others)By Therapeutic Area(Cardiovascular Diseases, Nephrology, Neurovascular Diseases, Oncology, Ophthalmology, Orthopedics & MSK Disorders, Others)By Services (System and Technology Support Services, Reading and Analytical Services, Project and Data Management, Operational Imaging Services, Clinical Trial Design and Consultation Services)By End Use(Medical Devices Manufacturers, Contract Research Organizations (CROs) , Biotechnology and Pharmaceutical Companies, Academic and Government Research Institutes, Others) |
| Regional Analysis | North America – The US, Canada; Europe – Germany, France, U.K., Italy, Spain, Russia & CIS, Rest of Europe; Asia Pacific – China, India, Japan, South Korea, ASEAN, Australia & New Zealand, Rest of Asia Pacific; Middle East & Africa – GCC, South Africa, Rest of Middle East & Africa; Latin America – Brazil, Mexico, Rest of Latin America |
| Competitive Landscape | Invicro (Konica Minolta) , Cardiovascular Imaging Technologies ,ICON plc , Imaging Endpoints,Intrinsic Imaging LLC ,BioTel Research (Philips) ,IXICO plc ,Median Technologies, Navitas Life Sciences , Parexel International,Prism Clinical Imaging, Radiant Sage LLC , RadMD,Synarc Imaging (merged into Clario) ,VirtualScopics Inc., WorldCare Clinical |
| Customization Scope | Customization for segments, region/country-level will be provided. Moreover, additional customization can be done based on the requirements. |
| Purchase Options | We have three licenses to opt for: Single User License, Multi-User License (Up to 5 Users), Corporate Use License (Unlimited User and Printable PDF) |





































