


Report Overview
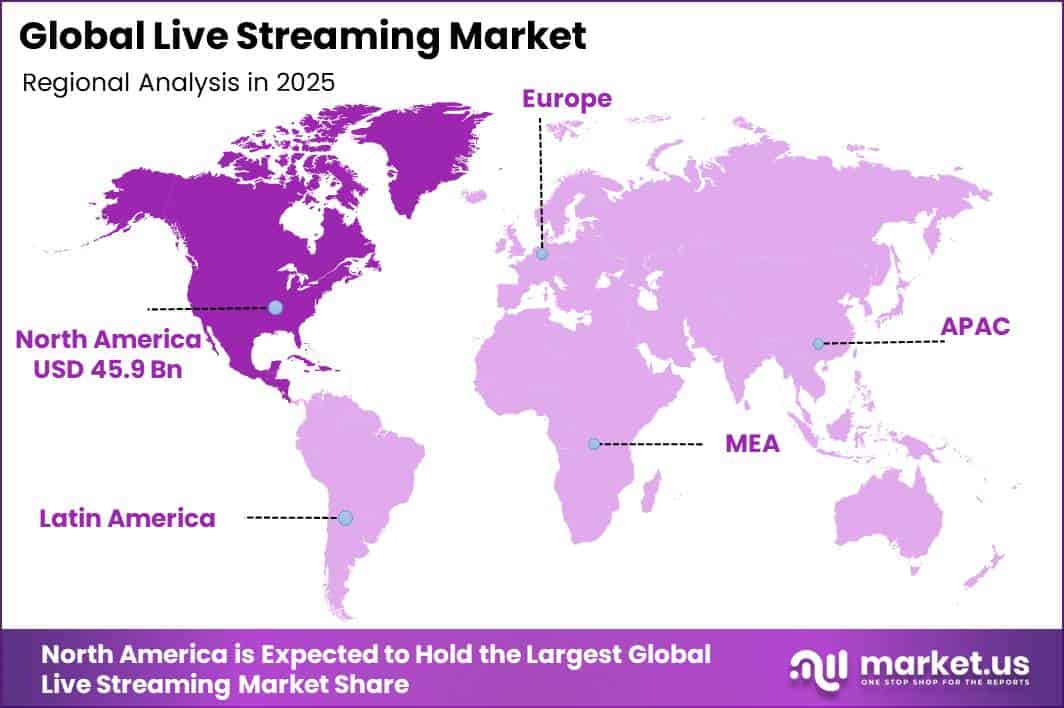
In 2025, the Global Live Streaming Market was valued at USD 115.6 billion. The market is projected to grow at a CAGR of 26.7% during 2026–2035, reaching approximately USD 1,231.8 billion by 2035. North America dominated the global video streaming market in 2025, accounting for more than 39.7% of the total market share and generating approximately USD 45.9 billion in revenue.
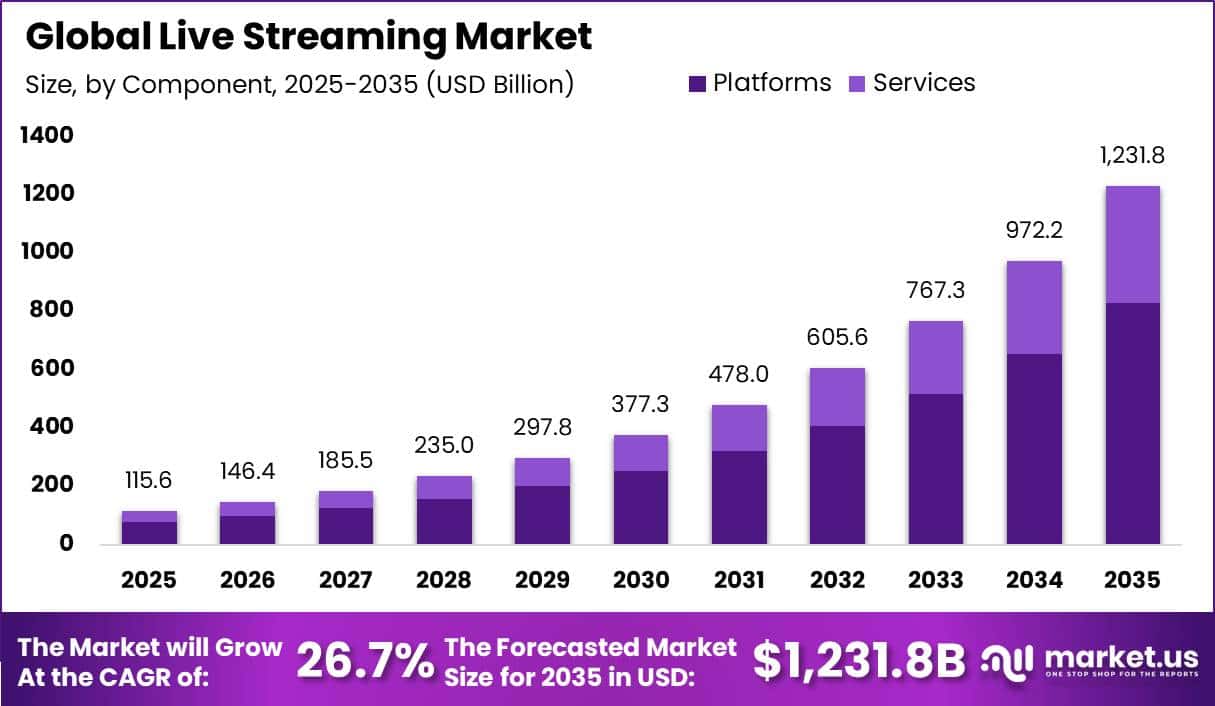
The market is benefiting strongly from the rapid expansion of global internet access. According to the International Telecommunication Union (ITU), around 6 billion people were online in 2025, compared with 5.8 billion in 2024. Global internet penetration increased from 60% of the world’s population in 2020 to 74% in 2025.
This growing digital population is increasing the potential audience for live video, gaming, e-commerce, education, entertainment, and virtual events. Mobile connectivity is also strengthening live-streaming adoption. GSMA Intelligence expects mobile data traffic to increase more than fourfold by 2030 and exceed 5,400 exabytes, mainly due to video and other high-bandwidth applications.
Higher mobile data capacity allows users to watch and broadcast longer streams at better quality. At the same time, around 2.2 billion people remain offline globally, creating significant future audience potential. As connectivity continues to expand, the growing number of internet users and rising mobile data consumption are expected to support sustained Live Streaming Market growth through 2035.
Key Takeaway
- Live Streaming Market is valued at USD 115.6 billion in 2025, projected to reach USD 1,231.8 billion by 2035 at a 26.7% CAGR.
- Platforms segment was dominated by Component with a 67.4% share.
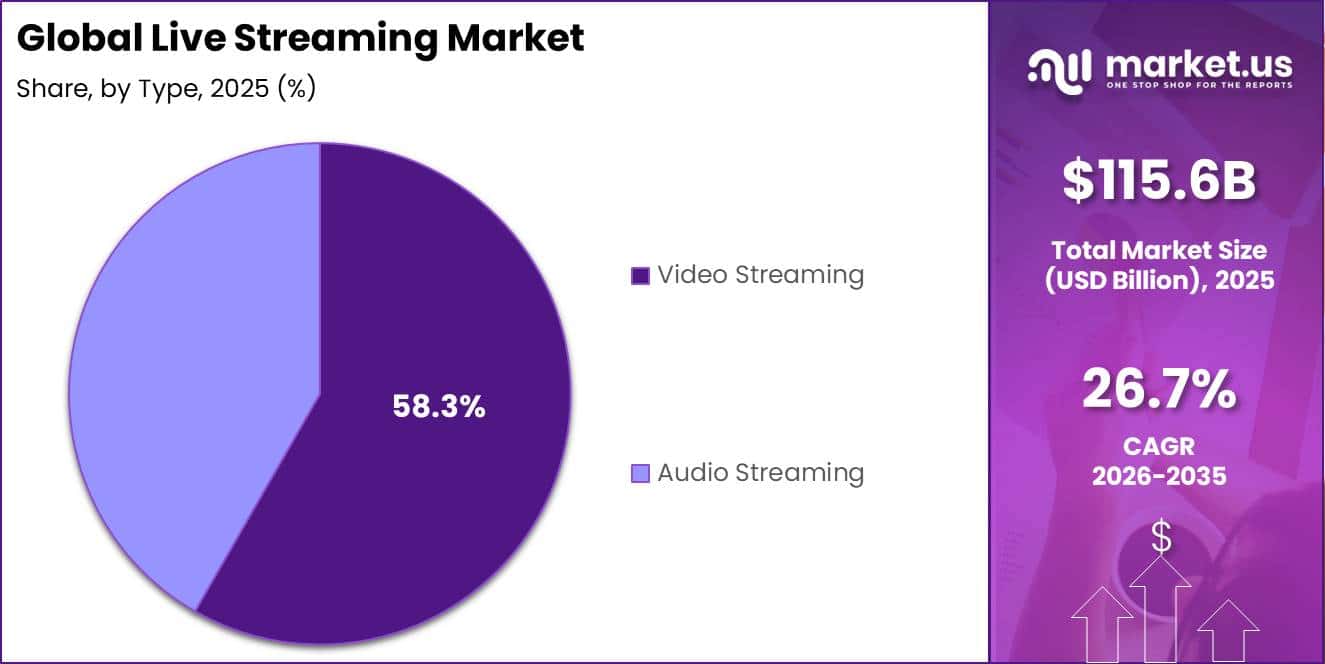
- Video Streaming was led by Type with a 58.3% share.
- Ad-Supported was the leading Revenue Model with a 42.6% share.
- Gaming was the top End-use segment with a 38.7% share.
- North America led the market in 2025 with a 39.7% share and approximately USD 45.9 billion in revenue.
Market Statistics and Data Insights
- Global internet adoption reached about 6.0 billion people in 2025, equal to roughly 74% of the world population, compared with 5.8 billion people and 71% in 2024. Around 200 million additional people came online within one year, directly expanding the potential audience for live video platforms.
- Global mobile-cellular subscriptions reached 9.2 billion in 2025, equivalent to 112 subscriptions per 100 inhabitants. Mobile broadband reached 99 subscriptions per 100 inhabitants and accounted for 89% of all mobile subscriptions, compared with less than 50% in 2015.
- About 36% of global mobile-broadband subscriptions were 5G in 2025, representing around 3 billion subscriptions. 5G networks covered approximately 55% of the world’s population, supporting higher-quality mobile live video, gaming streams, and interactive broadcasts.
- TikTok reported that more than 100 million creators went LIVE across Southeast Asia and the Caucasus and Central Asia during 2025, representing 77% growth from 2024. Well over half of these creators used LIVE for the first time.
- TikTok LIVE generated more than 134 billion comments and recorded 1.1 billion Multi-Guest participants during 2025. Its February 2026 Global LIVE Fest event attracted more than 4 million viewers.
- Around 212.3 million Americans played video games every week in 2026, equal to 67% of people aged 5–90. The player base increased by 7.2 million, or 3%, compared with 2025, reinforcing gaming as a major potential audience for live-streamed gameplay and esports.
- Mobile devices were the most widely used gaming platform across every age group, with 80% of U.S. players using mobile. More than 80% of Gen Alpha and Gen Z played video games weekly, compared with 71% of Millennials, 56% of Gen X, and 50% of Boomers.
- Vimeo states that its platform is used by more than 287 million creatives, marketers, entrepreneurs, and businesses. Vimeo also operates across more than 190countries and receives more than 350,000 video uploads per day, providing a sizable base for enterprise, white-label, event, and creator streaming services.
- YouTube reported that more than 30% of its daily logged-in viewers watched live content on average during Q2 2025. YouTube also added more than 75 playable games that creators can use directly within live streams while interacting with audiences through chat.
- UK viewing behavior shows video platforms moving rapidly onto television screens. Average YouTube viewing on TV sets increased from 9 minutes per person per day in 2022 to 19 minutes in 2025, a 111% increase. Across all in-home devices, YouTube viewing reached 41 minutes per person per day in 2025, compared with 33 minutes in 2022.
By Component
The Platforms segment held a dominant position in the Live Streaming Market, capturing a 67.4% share. This leadership is mainly supported by the strong need for software, cloud computing, video encoding, content delivery, and monetization tools that allow live streams to reach large audiences in real time. According to UNCTAD’s Digital Economy Report, data centres, which support the operation of streaming platforms, consumed around 460 terawatt-hours of electricity in 2022.
The International Energy Agency projects this level to nearly double to 1,000 TWh by 2026, reflecting the rapid rise in computing demand from video-intensive digital services. Large cloud providers such as AWS, Microsoft Azure, and Google Cloud also support much of the global digital infrastructure, allowing streaming platforms to manage millions of simultaneous viewers with greater reliability and scale.
The growing digital economy further strengthens this segment. UNCTAD reported that business e-commerce sales linked to digital platforms increased by nearly 60% between 2016 and 2022, reaching USD 27 trillion globally.
By Type
The Video Streaming segment held a dominant position in the Live Streaming Market, capturing a 58.3% share. This leadership is mainly driven by the high bandwidth required to deliver live video compared with audio, text, or images. As viewers increasingly prefer high-definition and real-time video content, telecom operators and digital platforms are investing heavily in network capacity and faster connectivity.
According to the International Telecommunication Union (ITU), global fixed-broadband internet traffic reached 6 zettabytes in 2024, increasing from 5.1 zettabytes in the prior year. Fixed-broadband networks also carried over 80% of total global internet traffic. A large portion of this traffic is supported by video-based applications, which require significantly more data capacity than other digital formats.
By Revenue Model
The Ad-Supported segment held a dominant position in the Live Streaming Market, capturing a 42.6% share. This leadership is mainly supported by the rapid growth of digital video advertising, which provides an important revenue source for platforms offering free live content.
This figure is projected to exceed USD 80 billion in 2026, showing faster growth than the overall U.S. digital advertising market, which reached USD 294.6 billion. Social media advertising also plays an important role in supporting video-based content. Social media ad revenue reached USD 117.7 billion in 2025, reflecting strong advertiser demand for video-led platforms and audience engagement.
By End-use
The Gaming segment held a dominant position in the Live Streaming Market, capturing a 38.7% share. This strong position is supported by a large and highly engaged gaming audience, along with the growing use of live streaming for gameplay, esports, community interaction, and creator-led content. According to the Entertainment Software Association (ESA), around 205.1 million Americans played video games regularly in 2024, representing 64% of the U.S. population.
Consumer spending on video games reached USD 59.4 billion, including USD 51.3 billion spent on game content, USD 4.9 billion on hardware, and USD 3.2 billion on accessories. Gaming is well suited to live streaming because esports tournaments, multiplayer matches, game launches, walkthroughs, and competitive sessions become more engaging when viewed in real time.
Key Market Segments
By Component
- Platforms
- Services
By Type
- Audio Streaming
- Video Streaming
By Revenue Model
- Ad-Supported
- Subscription-Based
- Pay-Per-View
By End-use
- Gaming
- Media and Entertainment
- Education and Professional
- Sports
- News and Events
- Others
Geopolitical Impact Analysis
Geopolitical disruptions can affect the Live Streaming Market by increasing the cost and delivery time of servers, networking equipment, optical components, and other data-centre hardware. Red Sea security concerns forced many shipping companies to reroute Asia–Europe cargo around the Cape of Good Hope.
According to UNCTAD, this disruption increased global container-shipping ton-miles by 17% in 2024, reducing available shipping capacity and raising fuel and charter costs. Shanghai–Northern Europe container spot rates reached USD 2,648 per TEU on 9 February 2024, representing a 256% increase from early-November 2023 levels.
Average Shanghai-origin container rates also increased by 122% between early December 2023 and early February 2024. Higher transportation costs can increase prices and lead times for servers, GPUs, switches, cameras, encoders, and fiber equipment used by streaming platforms and content-delivery networks.
Energy-price volatility creates another operating challenge because live-streaming platforms depend on continuously running data centres. The International Energy Agency reported that European wholesale electricity prices declined by more than 50% in 2023 from the 2022 crisis peak but remained roughly twice their 2019 level.
U.S. prices were about 15% above 2019 levels. In 2024, average wholesale electricity prices declined by around 20% across the EU, India, the UK, and the U.S. However, costs remained above pre-COVID levels in many markets. These pressures can increase expenses for video encoding, cloud storage, real-time content delivery, and AI-based moderation.
Regional Analysis
North America held a dominant position in the global Live Streaming Market in 2025, accounting for 39.7% of total revenue and generating approximately USD 45.9 billion. The region’s leadership is supported by strong broadband availability, high household internet penetration, advanced cloud infrastructure, and a mature digital advertising ecosystem.
In the United States, the Federal Communications Commission reported 549 million internet access connections as of June 2024, representing a 2.5% increase from June 2023. Around 94% of broadband-service locations had access to at least one terrestrial fixed-broadband provider offering speeds of 100 Mbps download and 20 Mbps upload. Residential fixed connections recorded a median download speed of 500 Mbps.
Canada further strengthens the region’s connectivity base. In 2024, 94.3% of Canadians had access to 5G networks, 99.5% had LTE access, and 96.4% of households could access unlimited 50/10 Mbps broadband. This infrastructure supports reliable high-definition streaming across gaming, sports, entertainment, retail, and business applications.
Asia Pacific is expected to be the fastest-growing regional market. The International Telecommunication Union recorded 97 mobile-broadband subscriptions per 100 inhabitants in Asia-Pacific in 2024. The region also had more than 850 million fixed-broadband subscriptions and 4.9 billion mobile subscriptions in 2023, supporting rising demand for mobile gaming, live commerce, sports, education, and creator-led streaming.
Key Regions and Countries
North America
- US
- Canada
Europe
- Germany
- France
- The UK
- Spain
- Italy
- Rest of Europe
Asia Pacific
- China
- Japan
- South Korea
- India
- Australia
- Rest of APAC
Latin America
- Brazil
- Mexico
- Rest of Latin America
Middle East & Africa
- GCC
- South Africa
- Rest of MEA
Market Dynamics
Drivers
| Driver | (~) % CAGR | Geographic Relevance | Impact Timeline |
|---|---|---|---|
| Live commerce monetization shift | +3.2% | Asia-Pacific, North America | Short term (2 years or less) |
| 5G densification enabling low-latency broadcast | +2.1% | Global | Short term (2 years or less) |
| Creator economy formalization | +1.8% | North America, Europe | Medium term (2 to 4 years) |
| Cloud-native encoding cost decline | +1.4% | Global | Medium term (2 to 4 years) |
| Interactive ad-format adoption | +1.1% | North America, Europe | Short term (2 years or less) |
Live commerce monetization shift
China’s Order No. 117, which took effect on 1 February 2026, has brought livestream selling under a clearer regulatory framework. This shift is encouraging merchants to move spending from traditional e-commerce listings toward real-time selling formats, while platforms increasingly use commission-based transaction models instead of only fixed hosting fees.
This change could increase gross monetization per streaming hour by an estimated 15% to 20%, as product discovery and checkout take place within the same live session. Higher transaction activity is also encouraging platforms to invest in low-latency, commerce-ready streaming infrastructure.
These developments could support monetization growth above the market’s baseline 26.7% CAGR, particularly across live-commerce platforms.
Restraints
| Restraint | (~) % CAGR | Geographic Relevance | Impact Timeline |
|---|---|---|---|
| Telecom capex pullback on core networks | -1.9% | North America, Europe | Short term (2 years or less) |
| Content moderation compliance costs | -1.3% | European Union, United Kingdom | Short term (2 years or less) |
| High interest-rate financing environment | -1.1% | Global | Short term (2 years or less) |
| Cross-border data localization mandates | -0.9% | Asia-Pacific, Middle East | Medium term (2 to 4 years) |
Telecom capex pullback on core networks
Telecom operators are reducing network investment, which can limit the infrastructure improvements needed for high-quality live streaming. Verizon lowered its capital spending outlook from roughly USD 17 billion in 2025 to USD 16–16.5 billion in 2026.
Dell’Oro Group also expects global telecom capex to decline by around 2% in 2026 after remaining broadly flat in 2025 across about 50 operators representing nearly 80% of worldwide spending.
This spending slowdown could reduce the pace of last-mile bandwidth upgrades, edge-node expansion, and network densification. Industry capital-intensity levels, which reached around 19–20% during 2020–2022, are moving toward the mid-teens. Verizon has also highlighted markets losing roughly USD 1–1.5 billion annually in margin, encouraging tighter investment discipline.
Challenges
| Challenge | (~) % CAGR | Geographic Relevance | Mitigation Horizon |
|---|---|---|---|
| Live moderation talent shortage | -1.2% | Global | Medium term (2 to 4 years) |
| Multi-jurisdiction compliance fragmentation | -1.0% | European Union, Asia-Pacific | Medium term (2 to 4 years) |
| Encoder and codec interoperability gaps | -0.7% | Global | Long term (4 years or more) |
| AI hyperscaler compute competition | -0.9% | North America, Asia-Pacific | Medium term (2 to 4 years) |
AI hyperscaler compute competition
Streaming platforms are facing growing competition for data-center capacity as AI training uses more GPUs and high-density servers. Hyperscalers are expected to invest roughly 2 times their 2025 capital investment levels in 2026, increasing demand for computing infrastructure and pushing up server and GPU capacity costs.
Limited cloud capacity can also increase provisioning times, encouraging platforms to secure multi-year reserved-capacity contracts or build dedicated edge infrastructure. Streaming companies may need to account for compute-cost inflation of several percentage points annually, creating continued pressure on margins even as viewer numbers and streaming volumes grow.
Opportunities
| Opportunity | (~) % CAGR | Geographic Relevance | Execution Window |
|---|---|---|---|
| Enterprise B2B live-event white space | +2.6% | North America, Europe | Medium term (2 to 4 years) |
| Rural 5G-enabled untapped audiences | +1.7% | Asia-Pacific, Latin America, Africa | Long term (4 years or more) |
| Subscription-tier hybrid monetization | +1.5% | Global | Medium term (2 to 4 years) |
| M&A roll-up of niche vertical platforms | +1.2% | North America, Europe | Long term (4 years or more) |
Enterprise B2B live-event white space
The enterprise live-streaming segment, covering investor calls, hybrid conferences, employee training, and product launches, remains underdeveloped compared with consumer advertising and commerce. Corporate spending is still largely grouped under general video-conferencing budgets, leaving room for platforms to introduce dedicated enterprise streaming packages with better analytics, security, compliance, and event-management tools.
Platforms that introduce enterprise-focused pricing, compliance certifications, and dedicated sales support could increase blended take-rates by an estimated 8% to 12% per enterprise account compared with consumer ARPU, creating a meaningful future revenue opportunity.
Key Players Analysis
The Live Streaming Market remains highly concentrated among major platform and infrastructure providers. Tier-1 companies include Meta, TikTok, and Twitch Interactive, which benefits from Amazon’s cloud and advertising ecosystem. Meta reported USD 200.97 billion in revenue in 2025, increasing by 22%, while Family of Apps advertising revenue rose by USD 36.4 billion.
The company invested USD 57.37 billion in R&D and USD 72.2 billion in capital expenditures. Meta’s ad impressions increased 12%, while average price per ad rose 9%, strengthening monetization across Facebook and Instagram video services. Amazon provides Twitch with strong infrastructure support through AWS.
AWS revenue reached USD 128.7 billion in 2025, while Amazon spent USD 22.4 billion on video and music content, licensing, and production. TikTok remains a major social-video competitor. Its Europe, Africa, and Latin America business generated USD 9.1 billion in revenue in 2025, up 45.7% year over year.
Tier-2 companies include Huya, IBM, Vimeo, Dacast, Pluto, Flux Broadcast, and Empire Video Productions. Huya generated RMB 4.59 billion, or USD 656.9 million, from live streaming in 2025, equal to 70.7% of revenue, although this declined 3.2%. Other revenue increased 43.1% to RMB 1.9 billion. Vimeo spent USD 109.37 million on R&D in 2024, while IBM generated USD 67.5 billion in 2025 revenue and invested USD 8.3 billion in R&D.
Top Key Players in the Market
- Dacast, Inc.
- Empire Video Productions LLC
- Flux Broadcast Ltd.
- Huya Inc.
- International Business Machines Corporation
- Meta
- Pluto Inc.
- TikTok Inc.
- Twitch Interactive, Inc.
- Vimeo, Inc.
Recent Developments
- In 2026, TikTok strengthened its live-streaming ecosystem through LIVE Fest 2025 and continued expansion of its creator community. More than 100 million creators went LIVE across Southeast Asia, the Caucasus, and Central Asia during 2025, representing a 77% increase from 2024. TikTok also recorded more than 134 billion LIVE comments and 1.1 billion Multi-Guest participants. Its Global LIVE Fest was held in Las Vegas, attracting more than 4 million viewers and highlighting the growing role of live video in creator engagement and entertainment.
- In 2025, Vimeo launched Vimeo Streaming to expand its video monetization and direct-to-consumer streaming capabilities. Vimeo stated that creators using its streaming services had generated more than USD 1 billion directly during the previous 3 years.
Report Scope
| Report Features | Description |
|---|---|
| Market Value (2025) | USD 115.6 Billion |
| Forecast Revenue (2035) | USD 1,231.8 Billion |
| CAGR (2026-2035) | 26.7% |
| Base Year for Estimation | 2025 |
| Historic Period | 2020-2024 |
| Forecast Period | 2026-2035 |
| Report Coverage | Revenue Forecast, Market Dynamics, Competitive Landscape, Recent Developments |
| Segments Covered | By Component (Platforms, Services); By Type (Audio Streaming, Video Streaming); By Revenue Model (Ad-Supported, Subscription-Based, Pay-Per-View); By End-use (Gaming, Media and Entertainment, Education and Professional, Sports, News and Events, Others) |
| Regional Analysis | North America – US, Canada; Europe – Germany, France, The UK, Spain, Italy, Rest of Europe; Asia Pacific – China, Japan, South Korea, India, Australia, Singapore, Rest of APAC; Latin America – Brazil, Mexico, Rest of Latin America; Middle East & Africa – GCC, South Africa, Rest of MEA |
| Competitive Landscape | Dacast, Inc.; Empire Video Productions LLC; Flux Broadcast Ltd.; Huya Inc.; International Business Machines Corporation; Meta; Pluto Inc.; TikTok Inc.; Twitch Interactive, Inc.; Vimeo, Inc. |
| Customization Scope | Customization for segments, region/country-level will be provided. Moreover, additional customization can be done based on the requirements. |
| Purchase Options | We have three licenses to opt for: Single User License, Multi-User License (Up to 5 Users), Corporate Use License (Unlimited Users and Printable PDF) |





























