


Report Overview
In 2025, the Global Leasing Market was valued at USD 2,008.0 billion and is projected to reach USD 5,068.0 billion by 2035, expanding at a CAGR of 9.7% during 2026–2035. North America accounted for 34.2% of the global leasing market in 2025, generating approximately USD 686.7 billion in revenue.
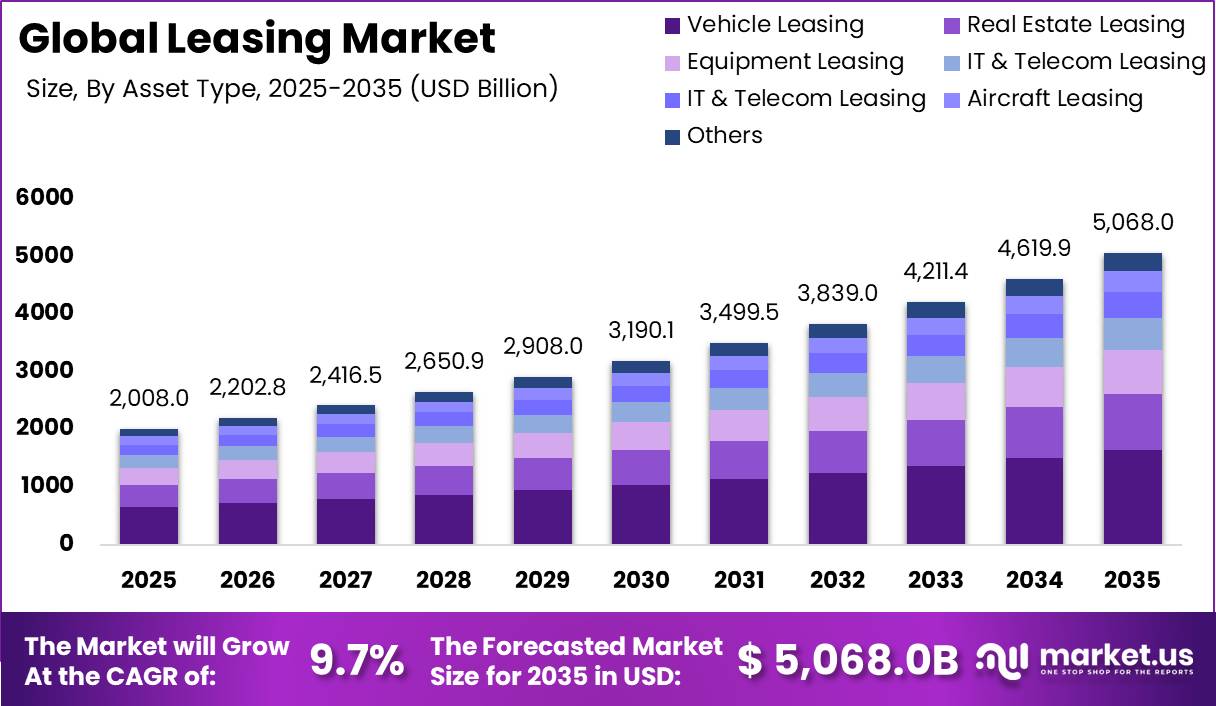
The market is growing as businesses increasingly prefer leasing over purchasing high-value assets to reduce upfront costs, improve cash flow, and maintain financial flexibility. Demand is particularly strong across transportation, construction, manufacturing, and industrial equipment, where regular asset upgrades are essential. According to the World Bank, global gross fixed capital formation has exceeded USD 25 trillion, reflecting sustained investment in machinery, equipment, and infrastructure that supports long-term leasing demand.
The automotive industry is another major growth driver. OICA reported that global vehicle production increased from 92.7 million units in 2024 to 96.4 million units in 2025, with Asia contributing more than 61% of total production. Higher vehicle output and fleet replacement are encouraging greater adoption of vehicle leasing, including electric and fuel-efficient models.
In 2025, the United States produced 10.24 million vehicles and recorded 16.7 million vehicle sales, while North America manufactured around 18.74 million vehicles, according to OICA. Continuous investment in equipment and technology, combined with rising financing costs, is encouraging businesses to lease assets rather than purchase them, supporting the region’s leading market position.
Key Takeaway
- The Global Leasing Market was valued at USD 2,008.0 billion in 2025 and is projected to reach USD 5,068.0 billion by 2035, growing at a CAGR of 9.7% during the forecast period from 2026 to 2035.
- By Asset Type, Vehicle Leasing dominated the global leasing market, accounting for 32.6% of the market share in 2025.
- By Lease Type, Operating Lease held the largest market share of 46.7% in 2025.
- By Lease Term, Medium-Term Leasing (25–60 months) led the market with a 48.5% share in 2025.
- By Financing Model, Direct Leasing accounted for the largest market share of 35.4% in 2025.
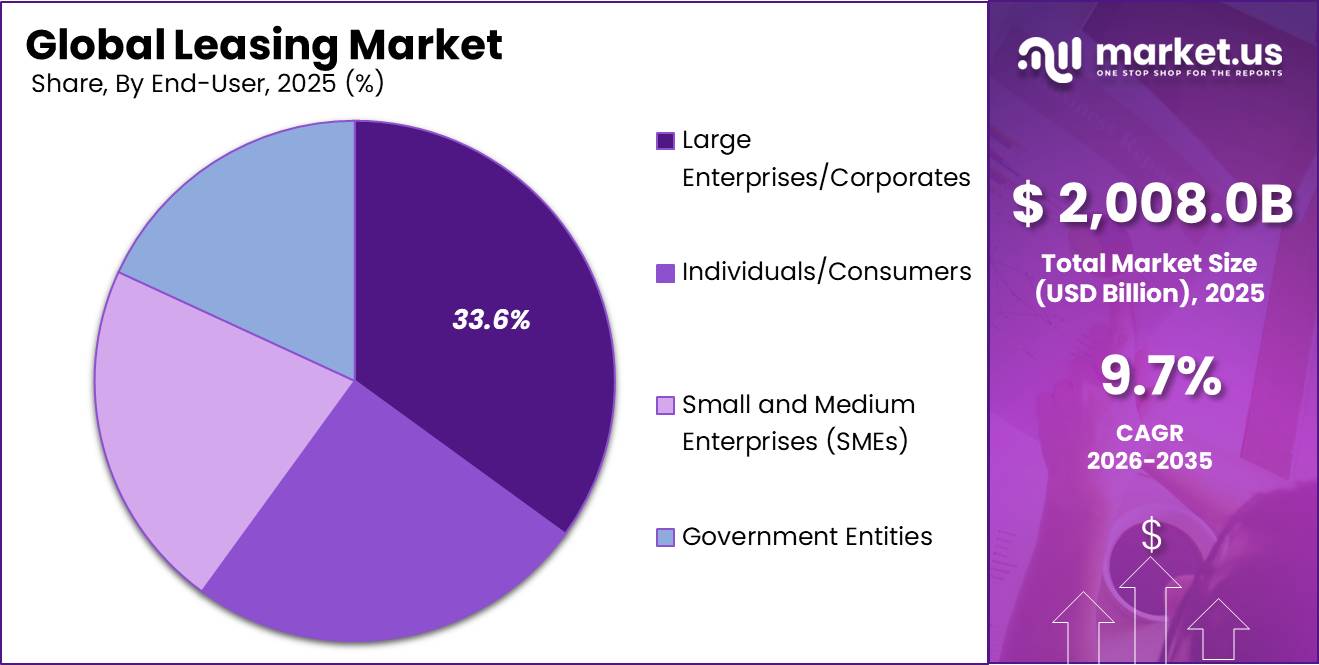
- By End User, Large Enterprises/Corporates dominated the market, capturing 33.6% of the global market share in 2025.
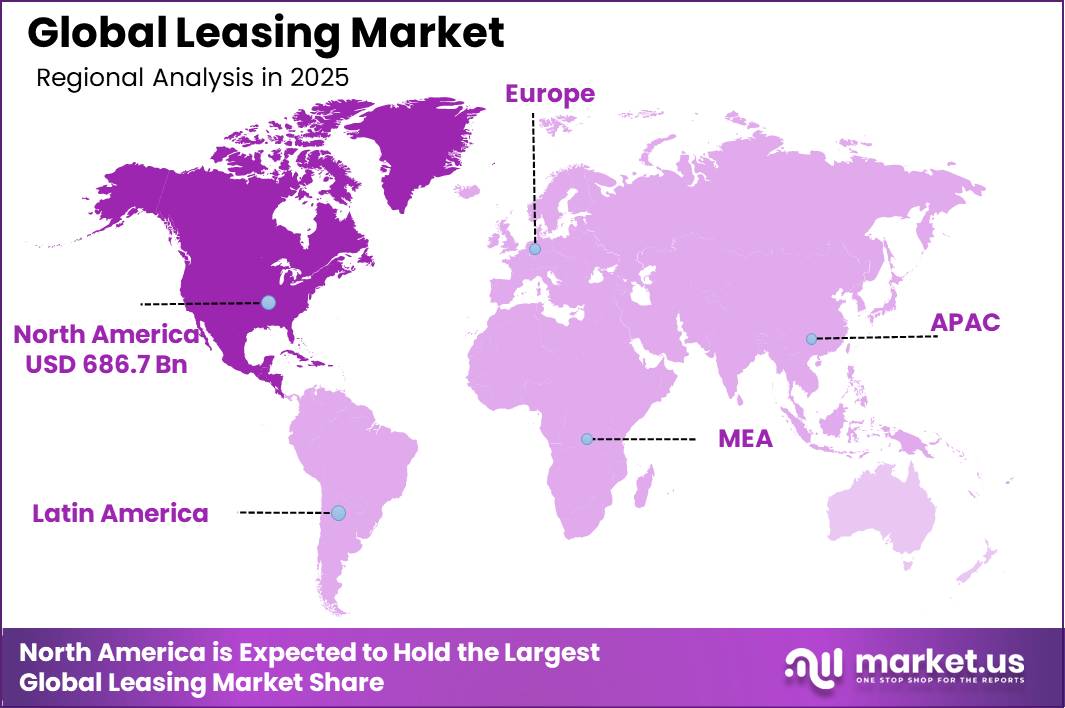
- North America dominated the global leasing market with a 34.2% share, valued at USD 686.7 billion in 2025
By Asset Type
Vehicle leasing dominates with a 32.6% share in the global leasing market’s asset-type segment, reflecting its central role in financing and managing the world’s expanding vehicle stock. Rising mobility demand, rapid fleet renewal cycles, and the transition toward electric and low-emission vehicles structurally favor leasing over outright ownership, particularly for corporates and fleet operators seeking predictable costs and off-balance-sheet flexibility.
According to the International Energy Agency, global electric car sales reached about 17 million in 2024, pushing the worldwide electric car fleet to nearly 58 million and lifting electric vehicles to more than 20% of new car sales, a pace that significantly shortens effective vehicle lifecycles and intensifies fleet turnover requirements.
The World Bank reports that global ICT services exports reached around USD 1.2 trillion in 2024, underscoring the rise of digitally delivered, asset-light business models that still depend on large, distributed sales and service fleets for last-mile delivery, field support, and customer engagement, all of which are increasingly procured via leasing contracts rather than owned vehicles.
By Lease Type
Operating leases account for 46.7% of global leasing contracts, making them the clear dominant lease type in the market’s structure. This leading share is grounded in their economic design: operating leases provide usage rights without transferring the risks and rewards of ownership, so lessees avoid residual-value exposure as technologies, efficiency standards, and regulations change.
Under legacy accounting rules, more than 85% of corporate leases were classified as operating leases and kept off balance sheet, highlighting their role as a preferred tool for accessing assets while managing reported leverage. For airlines, leasing now covers about 58–60% of the world’s commercial aircraft fleet, with operating structures widely used to align capacity with volatile passenger demand and fuel-efficiency upgrades.
By Lease Term
Medium-term leases of 25–60 months account for 48.5% of global leasing contracts, reflecting their optimal fit with business asset replacement cycles and financing strategies. These contracts align closely with the economic life of vehicles and equipment, typically delivering peak reliability and efficiency over three to five years before maintenance and obsolescence risks escalate.
Such tenors allow lessors to protect residual values through predictable remarketing while keeping monthly payments affordable for lessees, supporting widespread adoption across corporate fleets and machinery. For businesses, 3–5-year terms correspond to standard budgeting and capital planning horizons, enabling disciplined fleet renewal without locking into long, inflexible commitments.
By Financing Model
Direct leasing holds roughly 35.4% of global leasing volumes by financing model, reflecting its role as the default structure for independent lessors, banks, and specialized finance companies serving multi-sector asset demand.
Direct lessors intermediate more than half of global plant, equipment, and software investment that is financed through leases or loans in the United States alone, where around USD 1.8 trillion of capital expenditure was undertaken in 2019, and nearly USD 1 trillion was financed via credit instruments rather than cash purchases.
By End-User
Large enterprises and corporates account for roughly one-third of global leasing demand by end-user, making them the dominant segment in the market with about 33.6% share. Their leadership is structurally linked to the scale of corporate capital expenditure: non-financial businesses drive the bulk of global investment, with worldwide gross fixed capital formation reaching more than USD 25 trillion annually.
Large enterprises must continuously finance fleets, plants, and equipment across transportation, logistics, manufacturing, ICT and real estate portfolios, creating recurring needs for high-value, long-duration asset access. Leasing converts these capital-intensive assets into predictable operating costs, supports balance-sheet optimization, and allows corporates to manage technology obsolescence and regulatory change without locking in ownership risk.
Key Market Segments
By Asset Type
- Vehicle Leasing
- Real Estate Leasing
- Equipment Leasing
- IT & Telecom Leasing
- Healthcare Assets Leasing
- Aircraft Leasing
- Others
By Lease Type
- Operating Lease
- Finance/Capital Lease
- Sale and Leaseback
- Leasing with Purchase Option
By Lease Term
- Short-Term (up to 24 months)
- Medium-Term (25-60 months)
- Long-Term (61 months and above)
By Financing Model
- Direct Leasing
- Third-Party/Brokered Leasing
- Bank-Financed Leasing
- Captive Leasing
By End-User
- Large Enterprises/Corporates
- Individuals/Consumers
- Small and Medium Enterprises (SMEs)
- Government Entities
Market Dynamics
Challenge
The key financial challenge for lessors in 2026 is rising uncertainty in end-of-term residual values for fast-depreciating technology assets, especially battery electric vehicles and semiconductor-heavy industrial equipment. This is driven by rapid battery chemistry shifts from LFP to sodium ion to solid state, which shortens product life cycles and weakens secondary market pricing stability.
Empirical and market evidence shows increasing volatility in residual value assumptions across Europe, with projected declines such as 5.2 percent in Italy, 1.4 percent in Germany, and only limited stabilization in markets like the UK and France in 2025 to 2026.
BEVs are expected to account for nearly 10 percent of all lease maturities in 2026 and around 25 percent by 2028, meaning large volumes of assets originated under earlier pricing assumptions are now reaching end of term under unfavorable market conditions.
To manage this risk, lessors are building stochastic residual value buffers of 8 to 14 percent above historical averages, which directly increases monthly lease pricing by about 6 to 9 percent and reduces demand, especially in SME and fleet segments with already tight margins. As a result, residual value uncertainty is becoming a structural constraint on leasing growth and asset financing profitability.
| Challenge | (~) % CAGR | Geographic Relevance | Mitigation Horizon |
|---|---|---|---|
| EV & Tech-Asset Residual Value Uncertainty | -0.9% | EU, North America, APAC auto corridors | Medium term (2–4 years) |
| Multi-Standard Lease Accounting Compliance Burden | -0.7% | Global; highest friction in cross-border EU/US/APAC operators | Long term (≥ 4 years) |
| Structural Talent Deficit in Underwriting & Risk Tech | -0.8% | North America, EU financial hubs, APAC emerging leasing centres | Long term (≥ 4 years) |
| OEM Asset Delivery Backlogs & Supply Chain Friction | -1.1% | Aviation: Ireland/APAC corridors; Equipment: North America/EU | Medium term (2–4 years) |
| ESG Reporting & Green Leasing Mandate Complexity | -0.6% | EU regulatory core; expanding to North America & APAC | Long term (≥ 4 years) |
| Legacy IT Infrastructure & AI Modernisation Bottleneck | -0.7% | North America, EU; lagging in APAC mid-tier lessors | Long term (≥ 4 years) |
Opportunity
Circular Leasing is an underdeveloped extension of traditional leasing where off-lease assets are systematically refurbished, certified, and re-leased through a controlled secondary-market platform instead of being sold or written off. This effectively turns leasing into a multi-cycle revenue model, where the same asset generates value across multiple customer lifecycles.
Regulatory shifts in Europe are accelerating this transition, with circularity targets aiming to double the region’s circular economy rate from about 12 percent to 24 percent by 2030. From 2026 onward, Digital Product Passports for batteries, electronics, and industrial equipment are being introduced, creating standardized lifecycle data that enables lessors to track, certify, and monetize asset condition more efficiently.
The economic logic is driven by higher asset utilization and reduced information asymmetry. Refurbished assets can be re-leased at around 60 to 70 percent of original cost, often targeting Tier 2 demand segments, while reducing typical used-asset price discounts of 15 to 25 percent through verified condition data. This enables a second lease cycle on near fully depreciated assets, potentially increasing EBITDA margins by 400 to 600 basis points and extending asset income generation by an additional 2 to 3 years.
| Opportunity | (~) % Potential CAGR | Geographic Relevance | Execution Window |
|---|---|---|---|
| Leasing-as-a-Service (LaaS) & Outcome-Based Monetization | +2.8% | North America, Western Europe, APAC (India, ANZ) | Medium term (2–4 years) |
| Commercial EV Fleet Leasing + Battery-as-a-Service | +2.2% | India, China, EU, Southeast Asia | Short term (≤ 2 years) |
| Healthcare Equipment Leasing — Tier 2/3 Market Penetration | +1.9% | India, APAC emerging, Sub-Saharan Africa | Medium term (2–4 years) |
| IoT/Telematics Data Monetization Layer on Leased Assets | +1.6% | North America, EU, APAC | Medium term (2–4 years) |
| Circular Leasing — Secondary-Market & Refurbishment Platforms | +1.4% | EU (regulatory mandate), India, ASEAN | Long term (≥ 4 years) |
| M&A Roll-Up Consolidation of Fragmented Regional Lessors | +2.0% | India MSME corridor, Southeast Asia, MENA | Short–Medium term (2–4 years) |
Driver
GCC expansion has become a structurally strong driver of Grade-A office leasing demand in APAC, especially in India, where Global Capability Centres now account for roughly 38 to 39 percent of total office leasing activity. India recorded about 83.3 million sq. ft. of gross leasing volume in 2025, marking record highs for the third consecutive year.
In early 2026, leasing momentum remained elevated, with Mumbai alone reaching about 5.6 million sq. ft. in a single quarter and foreign firms leasing around 9.1 million sq. ft. of office space for GCC setup in Q1 2026. Around 93 percent of these transactions were concentrated in Grade A assets, reinforcing a strong preference for high-quality institutional office space.
GCC demand is structurally different from traditional occupier leasing because it is long-term and capital intensive, typically involving 7 to 10 year leases and significant fit-out investment of about USD 1,550 per square meter. This creates stable, premium rental income for landlords that is less sensitive to short-term cycles.
Across APAC markets such as Singapore, Tokyo, and Kuala Lumpur, persistent GCC expansion and constrained new supply continue to support leasing demand, contributing an estimated +1.5 percentage points to overall market CAGR growth.
| Driver | (~) % Impact on CAGR | Geographic Relevance | Impact Timeline |
|---|---|---|---|
| AI-Driven Capex & Data Center Infrastructure Leasing Hyperscale cloud and AI infrastructure buildout converting owned assets into long-term lease structures | +2.1% | North America (core), APAC corridors (India, Singapore, Tokyo), EU emerging | Short–Medium Term (1–4 yrs) |
| Monetary Easing & Rate Normalization Fed’s 75 bps cumulative cuts in Q4 2025 expanding lease affordability, compressing cost of lease capital | +1.6% | North America (primary), Western Europe, South America spill-over | Short Term (≤ 2 yrs) |
| IFRS 16 / ASC 842 Compliance & Lease Accounting Reform Regulatory mandates driving structured lease portfolio migration, lease management software adoption, and balance sheet optimization | +1.2% | EU (core), North America, APAC compliance corridors (Australia, Japan, India) | Medium Term (2–4 yrs) |
| GCC Expansion & Institutional Office Leasing Demand Foreign MNCs establishing Global Capability Centres driving record-high Grade-A office absorption across APAC | +1.5% | APAC (India dominant), South-East Asia, Middle East spill-over | Short–Medium Term (1–4 yrs) |
| EV Fleet & Green Mobility Leasing Accelerating BEV penetration and fleet electrification mandates structurally redirecting automotive capex toward operating leases | +1.3% | Western Europe (regulatory core), North America, APAC (China, Japan, South Korea) | Medium Term (2–4 yrs) |
| Technology Obsolescence & IT Asset Refresh Cycles AI-accelerated hardware obsolescence compressing refresh timelines to 3–4 years, elevating Device-as-a-Service and operating lease demand | +1.0% | North America, Western Europe, APAC (India, China, ANZ), South America spill-over | Short–Medium Term (1–4 yrs) |
Restraint
The most significant restraint on leasing market growth through 2027 to 2028 is the persistently elevated and uncertain global interest rate environment across key leasing regions. Central bank policy rates remain well above the near-zero levels seen in the 2019 to 2021 period, with the Bank of England at 3.75 percent as of June 2026 and the ECB deposit facility rate around 2.0 percent. Even after rate cuts in late 2025 in the United States, benchmark rates remain elevated in historical terms, increasing the cost of capital across leasing structures.
In APAC, India’s repo rate of 5.25 percent as of mid 2026 further constrains SME leasing activity, which has historically been a key growth engine. The combined effect is slower origination volumes, tighter credit selection, and a shift toward longer lease terms to preserve yields. Overall, this environment is estimated to reduce leasing market CAGR by about -1.8 percentage points relative to a more normalized interest rate cycle.
| Restraint | (~) % Impact on CAGR | Geographic Relevance | Impact Timeline |
|---|---|---|---|
| Elevated & Volatile Interest Rate Environment | -1.8% | North America core, EU, India, APAC corridors | Medium term (2–4 years) |
| Tariff-Driven Asset Cost Inflation & Supply Chain Friction | -1.4% | North America core, APAC export corridors, EU industrial | Short–Medium term (≤ 3 years) |
| Residual Value Deterioration (EV & Technology Assets) | -1.2% | EU, North America, APAC EV-adoption markets | Medium–Long term (3–6 years) |
| IFRS 16 / ASC 842 Compliance Burden & Balance Sheet Visibility | -0.9% | EU (IFRS 16), North America (ASC 842), UK (FRS 102 revised 2026) | Short term (≤ 2 years) |
| OEM Production Backlogs & Equipment Delivery Lead-Time Delays | -1.0% | Global — most acute in North America & APAC aviation/industrial | Short–Medium term (≤ 3 years) |
| Commercial Real Estate Structural Vacancy & Lessee Credit Fragility | -0.8% | North America office corridors, EU secondary markets | Medium–Long term (3–6 years) |
Geopolitical Impact Analysis
Geopolitical tensions are increasing costs and changing investment decisions across the global leasing market. Higher trade barriers and tariffs have raised the cost of manufacturing vehicles, industrial equipment, and machinery that are widely financed through leasing. Average bilateral tariffs between the United States and China have increased to around 17%, compared with less than 4% before the trade conflict.
Higher tariffs on steel, aluminum, and semiconductors have significantly increased production costs for equipment manufacturers. These higher costs are passed on to leasing companies through increased asset prices, putting pressure on profit margins and leading to higher lease rates in several equipment categories. At the same time, weaker global trade activity has reduced demand for trade-related assets such as shipping containers, trailers, and material-handling equipment, lowering asset utilization and affecting leasing returns.
Slower growth in global maritime trade has also extended delivery and asset repositioning times, reducing fleet efficiency. Meanwhile, Brent crude oil prices remained close to USD 80 per barrel during 2024, increasing fuel, transportation, and asset recovery costs for leasing companies. These challenges are particularly affecting cross-border leasing of trucks, rail wagons, containers, and heavy equipment by increasing operating expenses, extending contract cycles, and creating greater uncertainty in asset values.
Regional Analysis
North America dominated the global leasing market in 2025, accounting for 34.2% of total revenue and reaching USD 686.7 billion. The region’s leadership is supported by a well-developed financial system, strong availability of leasing services, and high adoption across industries such as transportation, construction, manufacturing, healthcare, and information technology.
The United States remains the key contributor due to its mature credit market, established leasing companies, and strong demand for asset financing from businesses of all sizes. In addition, companies increasingly prefer leasing to preserve cash flow, improve financial flexibility, and reduce the burden of large upfront capital investments, further strengthening regional market growth.
Asia Pacific is expected to register the fastest growth during the forecast period, driven by rapid industrial expansion, rising infrastructure investment, and the growing number of small and medium-sized enterprises (SMEs).
Key Regions and Countries
North America
- US
- Canada
Europe
- Germany
- France
- The UK
- Spain
- Italy
- Rest of Europe
Asia Pacific
- China
- Japan
- South Korea
- India
- Australia
- Rest of APAC
Latin America
- Brazil
- Mexico
- Rest of Latin America
Middle East & Africa
- GCC
- South Africa
- Rest of MEA
Key Players Analysis
The global leasing market is moderately consolidated, with a limited number of large multinational companies holding a significant share of total market revenue, while numerous regional and local leasing providers serve specific industries and geographic markets.
Leading companies such as Volkswagen AG, Mercedes-Benz Group, BMW Group, Toyota Motor Corporation, ORIX Corporation, BNP Paribas, and Tokyo Century Corporation operate diversified leasing businesses covering vehicles, industrial equipment, machinery, and financial leasing. Their strong financial resources, global presence, and long-standing customer relationships enable them to maintain leadership across developed markets, particularly North America and Europe, where leasing adoption is well established.
The vehicle leasing segment is led by major fleet operators and automotive finance companies, including Enterprise Holdings, Ayvens, Hertz Global Holdings, SIXT SE, along with captive finance divisions of leading automobile manufacturers. These companies are expanding electric vehicle leasing, connected mobility services, and digital leasing platforms to strengthen customer experience and improve fleet management.
Top Key Players in the Market
- ALD Automotive
- Arval BNP Paribas Group
- Ashtead Group (Sunbelt Rentals)
- Brookfield Asset Management
- Caterpillar Financial Services
- CBRE Group
- DLL Group (Rabobank)
- Element Fleet Management
- Enterprise Holdings
- Herc Rentals Inc.
- JLL (Jones Lang LaSalle)
- LeasePlan Corporation N.V.
- Regus (IWG PLC)
- United Rentals
- WeWork
- Others
Recent Developments
- In January 2025, United Rentals, Inc. announced a tender offer to acquire H&E Equipment Services, Inc. for USD 92 per share in cash, valuing the transaction at approximately USD 3.6 billion. The acquisition expands United Rentals’ equipment leasing network by adding more than 120 rental locations across North America.
- In March 2025, Brookfield Asset Management reported raising USD 35 billion during the fourth quarter and USD 112 billion for the full year 2025 across its funds platform. The additional capital strengthens the company’s investment capacity for leasing-related infrastructure, real assets, and equipment financing opportunities globally.
Report Scope
| Report Features | Description |
|---|---|
| Market Value (2025) | USD 2,008.0 Billion |
| Forecast Revenue (2035) | USD 5,068.0 Billion |
| CAGR (2026-2035) | 9.7% |
| Base Year for Estimation | 2025 |
| Historic Period | 2020-2024 |
| Forecast Period | 2026-2035 |
| Report Coverage | Revenue Forecast, Market Dynamics, Competitive Landscape, Recent Developments |
| Segments Covered | By Lease Type (Operating Lease, Finance/Capital Lease, Sale and Leaseback, Leasing with Purchase Option), By Asset Type (Vehicle Leasing, Real Estate Leasing, Equipment Leasing, IT & Telecom Leasing, Healthcare Assets Leasing, Aircraft Leasing, Others), By Lease Term (Short-Term (up to 24 months), Medium-Term (25–60 months), Long-Term (61 months and above)), By Financing Model (Direct Leasing, Third-Party/Brokered Leasing, Bank-Financed Leasing, Captive Leasing), By End-User (Large Enterprises/Corporates, Individuals/Consumers, Small and Medium Enterprises (SMEs), Government Entities) |
| Regional Analysis | North America – US, Canada; Europe – Germany, France, The UK, Spain, Italy, Rest of Europe; Asia Pacific – China, Japan, South Korea, India, Australia, Singapore, Rest of APAC; Latin America – Brazil, Mexico, Rest of Latin America; Middle East & Africa – GCC, South Africa, Rest of MEA |
| Competitive Landscape |
ALD Automotive, Arval BNP Paribas Group, Ashtead Group (Sunbelt Rentals), Brookfield Asset Management, Caterpillar Financial Services, CBRE Group, DLL Group (Rabobank), Element Fleet Management, Enterprise Holdings, Herc Rentals Inc., JLL (Jones Lang LaSalle), LeasePlan Corporation N.V., Regus (IWG PLC), United Rentals, WeWork, Others
|
| Customization Scope | Customization for segments and region/country-level will be provided. Moreover, additional customization can be done based on the requirements. |
| Purchase Options | We have three licenses to opt for: Single User License, Multi-User License (Up to 5 Users), Corporate Use License (Unlimited Users and Printable PDF) |





































