


Report Overview
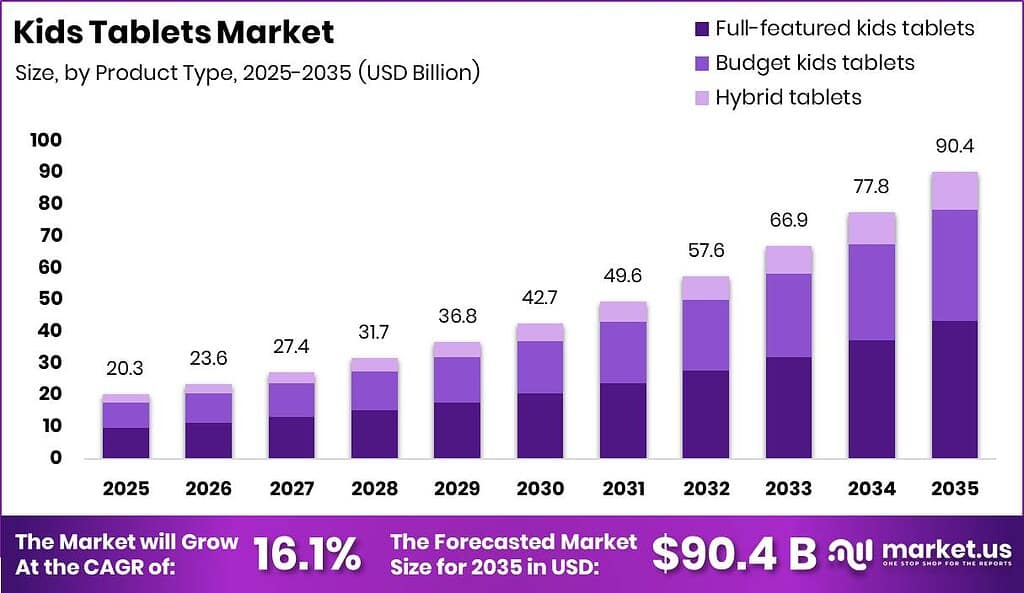
Global Kids Tablets Market size is expected to be worth around USD 90.40 Billion by 2035 from USD 20.30 Billion in 2025, growing at a CAGR of 16.1% during the forecast period 2026 to 2035. This expansion signals sustained capital interest in child-focused hardware. Investors who time capacity and content partnerships early can lock multi-year volume before price wars intensify.
Therefore, the Kids Tablets Market covers purpose-built tablets with parental controls, durable casings, age-banded apps, and education features for children. Product designs span full-featured, budget, and hybrid models. Connectivity splits between Wi-Fi only and SIM-cellular units. Operating systems include Android, iOS, Amazon Fire OS, and other platforms that shape app ecosystems and buyer lock-in.
Key Takeaways
- The market reaches USD 20.30 Billion in 2025 and USD 90.40 Billion by 2035 at a CAGR of 16.1%.
- Full-featured kids tablets lead product type with a 48.00% share.
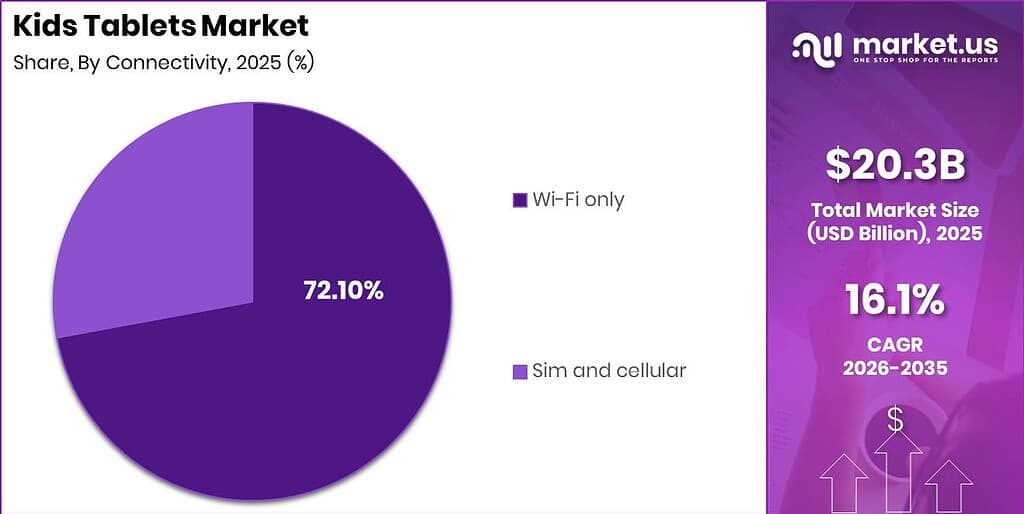
- Wi-Fi only leads connectivity with a 72.10% share.
- Android leads operating systems with a 52.40% share.
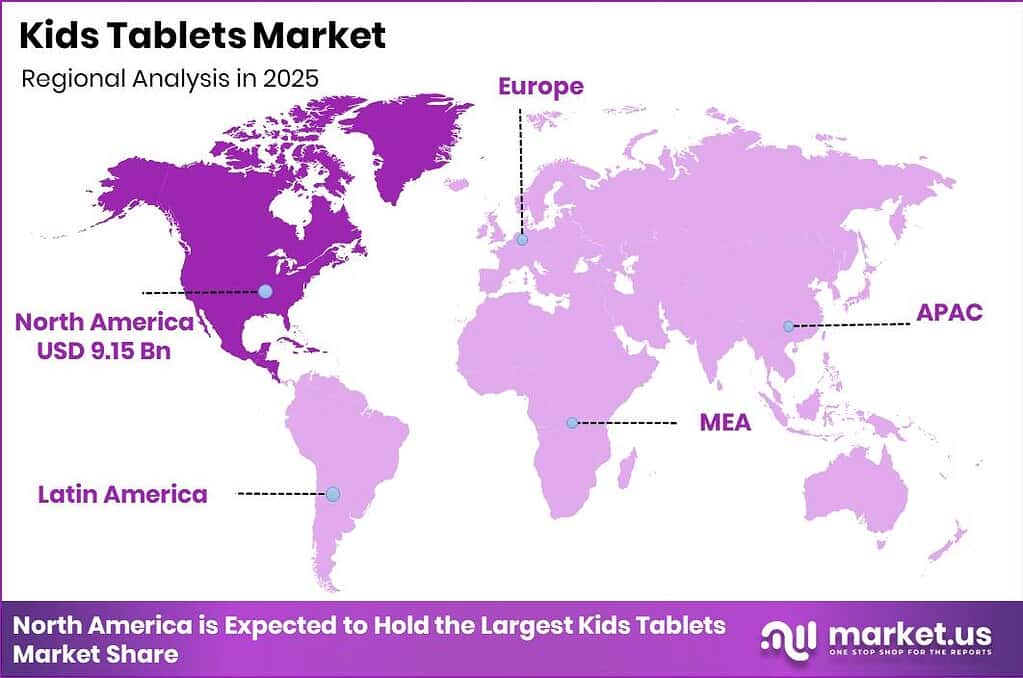
- North America leads regions with a 45.00% share, valued at USD 9.15 Billion.
According to Pew Research Center data, 68% of US parents with children aged 12 or younger reported tablet use by their child. This usage rate exceeds smartphone use at 61% in the same survey. Brands that package learning apps with strong controls can convert this installed habit into repeat device cycles.
As reported by Pew Research Center, daily screen use among children younger than 2 rose from 24% in 2020 to 35% in 2025. This 11-point jump pulls first devices into earlier life stages. Vendors who certify infant-safe interfaces and short-session modes can win the first household purchase and later upgrades.
Consequently, school and home hybrid learning keeps tablets in daily routines rather than occasional entertainment. Procurement and retail channels both respond when parents treat tablets as learning tools. Suppliers that bundle offline curricula with durable hardware reduce churn and raise average contract value for institutions and families.
Product Type Analysis
Full-featured kids tablets dominates with 48.00% due to richer apps and controls.
In 2025, Full-featured kids tablets held a dominant market position in the By Product Type segment of Kids Tablets Market, with a 48.00% share. US Census Bureau data showed about 80% of households with children owned tablets, confirming deep home penetration for capable devices. This share rewards vendors who pair premium screens with parental dashboards. Buyers pay more when one device covers learning, media, and safety in a single chassis.
Budget kids tablets serve price-sensitive households that need basic browsing, video, and simple learning apps. ITU figures show only 6% of children and young people in low-income countries have home internet, versus 87% in high-income countries. This gap keeps low-cost hardware relevant where connectivity and income lag. Brands that cut specs carefully without dropping core safety filters can still win volume in emerging retail.
Hybrid tablets blend child modes with adult productivity so families share one device across ages. ITU reported roughly 5.5 billion internet users in 2024, equal to about 68% of the global population. Wider connectivity supports dual-profile products that switch profiles quickly. Makers who nail profile switching and durable cases can lift household attach rates without a second full purchase.
Connectivity Analysis
Wi-Fi only dominates with 72.10% due to lower cost home use.
In 2025, Wi-Fi only held a dominant market position in the By Connectivity segment of Kids Tablets Market, with a 72.10% share. ITU data placed global youth home internet access near 33%, with large high-income versus low-income gaps. Home Wi-Fi remains the default path for most child devices. Vendors who optimize offline caches plus simple router pairing cut support tickets and raise satisfaction scores.
SIM and cellular models give always-on access for travel, rural schools, and shared family plans. ITU counted about 2.6 billion people still offline in 2024, with least-developed-country penetration near 35%. Cellular SKUs fill coverage holes where fixed broadband is weak. Operators and OEMs that co-sell child data plans can raise ARPU while parents gain location and content controls on the move.
Operating System Analysis
Android dominates with 52.40% due to broad OEM and price range.
In 2025, Android held a dominant market position in the By Operating System segment of Kids Tablets Market, with a 52.40% share. National statistical and industry device data consistently show Android as the volume OS across multi-brand tablet lines. Open OEM licensing lets many makers ship kid skins quickly. This structure pressures pure closed ecosystems on entry price while still allowing managed education builds.
iOS targets premium family buyers who want tight App Store controls and long software support. Apple expanded child-safety defaults across Child Accounts and age bands for younger users. This closed stack raises trust for parents who already own iPhones. Premium ASPs support higher content take rates even when unit share trails Android.
Amazon Fire OS focuses on content bundles, kids profiles, and living-room to tablet continuity. Fire devices often pair with subscription libraries that lower upfront hardware pain. This model shifts profit toward recurring media rather than silicon alone. Other systems hold niche education or regional builds and collectively take the remaining share for specialized school tenders.
Key Market Segments
By Product Type
- Full-featured kids tablets
- Budget kids tablets
- Hybrid tablets
By Connectivity
- Wi-Fi only
- Sim and cellular
By Operating System
- Android
- iOS
- Amazon Fire OS
- Other
Regional Analysis
North America Dominates the Kids Tablets Market with a Market Share of 45.00%, Valued at USD 9.15 Billion
North America leads on high household ownership, strong retail chains, and paid education content. The 2025 Common Sense Census found children aged 8 and younger spent about 2.5 hours per day on screen media. Gaming time among US children aged 0 to 8 rose 65% over four years. Brands that sell durable kids editions with clear time limits can monetize this intensive use without losing parent trust.
Asia Pacific is the fastest-scaling demand pool as schools and governments buy learning endpoints at volume. Institutional digital-learning programs across India and broader Asia-Pacific shorten sales cycles for rugged Wi-Fi tablets. Vendors who localize language packs and offline curricula can win multi-year tenders. In September 2025, Samsung introduced the Galaxy Tab A11 series as a hardware base for family and kids configurations with protective accessories and Samsung Kids compatibility.
Europe balances strict privacy rules with high connectivity, so compliance-ready SKUs win shelf space. Latin America, the Middle East, and Africa add growth where connectivity rises but affordability still filters features. Global sellers who offer tiered specs and financing protect share across income bands. Regional mix therefore favors flexible portfolios over one global flagship.
Key Regions and Countries
North America
- US
- Canada
Europe
- Germany
- France
- The UK
- Spain
- Italy
- Rest of Europe
Asia Pacific
- China
- Japan
- South Korea
- India
- Australia
- Rest of APAC
Latin America
- Brazil
- Mexico
- Rest of Latin America
Middle East and Africa
- GCC
- South Africa
- Rest of MEA
Market Dynamics
Market Opportunity Analysis - Budget devices, cellular SKUs, and offline bundles open entry paths beyond premium North America
Budget kids tablets remain underexploited relative to full-featured leaders at 48.00% share. Many emerging households still need a first durable screen at a lower ticket. New entrants can win with certified controls and school-ready apps without matching flagship silicon. This path builds volume before brand premiums become credible.
SIM and cellular connectivity sits behind Wi-Fi only at 72.10% share, yet covers travel and weak broadband zones. Operators can co-brand child plans with location and content locks. Hardware makers who ship eSIM-ready kids SKUs reduce friction for parents. Early movers capture family-plan attach that pure Wi-Fi vendors miss.
Hybrid tablets let one chassis serve child and adult profiles, which fits multi-user homes outside single-child premium niches. Asia Pacific school tenders also favor rugged shared devices over pure toys. Investors funding MDM and offline packs can join institutional RFPs faster. This reduces reliance on North America’s 45.00% retail-led pool alone.
Therefore, offline-first bundles target regions where home internet for children stays far below high-income norms. Cached curricula plus solar-friendly power cut data bills for families and NGOs. Entrants who price service layers clearly can lift margin without chasing only ASP. That positioning turns connectivity gaps into a product category rather than a lost sale.
Technology and Innovation Landscape - Child safety software, paper-like displays, and kids ecosystem hardware redefine differentiation
Apple’s Child Accounts, default web filters, and multi-OS safety rollout set a high bar for parent trust. Free updates across iPadOS 26 and related platforms extend device life and justify premium pricing. Rivals must match age-banded controls or lose safety-led shortlists. Software quality now moves share as much as screen size.
Samsung Kids features, protective cases, stylus support, and accessory kits turn standard tablets into family editions. The Galaxy Tab A11 platform creates a reusable base for kids configurations. This modular approach lowers redesign cost for each retail season. Competitors without a kids software layer face pure price competition.
TCL’s NXTPAPER paper-like viewing and AI personalization target longer reading and study sessions with less eye strain. Display innovation gives education buyers a concrete reason to switch brands. Makers who publish independent comfort metrics can win school pilots faster. Hardware comfort becomes a measurable tender criterion.
As a result, edge parental dashboards, session limits, and offline content caches form the next competitive stack. Vendors who integrate these tools at the OS level reduce third-party app risk. Buyers gain simpler setup and clearer audit trails for schools. Investors should track software attach rates alongside unit shipments.
Drivers
Government and school procurement is turning kids tablets into managed learning endpoints rather than pure toys. UNICEF Learning Passport reached 43 countries by June 2024, added more than 1.4 million users, and logged 3.6 million course completions. ITU reported 5.5 billion internet users in 2024, or 68% of the world, up from 65% in 2023. UNICEF later passed 10 million registered Learning Passport users across 47 countries in 2025.
This channel cuts customer-acquisition cost through bulk contracts. Buyers still demand device management, rugged cases, offline content, and multi-year support. Volume leverage could add about 2.4 points to the 16.1% baseline CAGR. Vendors shift toward hardware-plus-service deals instead of one-time retail tickets.
| Driver | (~) % Impact on CAGR Forecast | Geographic Relevance | Impact Timeline |
|---|---|---|---|
| Institutional Digital-Learning Procurement | +2.4% | India, Asia-Pacific, Middle East, Latin America | Short term (2 years or less) |
| Child-Safe Device Differentiation | +1.8% | North America, Europe, developed Asia-Pacific | Short term (2 years or less) |
| Expanding Household Connectivity | +1.4% | Global, led by emerging economies | Medium term (2 to 4 years) |
| Hybrid Learning Normalization | +1.2% | Global | Medium term (2 to 4 years) |
| Localized Educational Content | +0.9% | India, Southeast Asia, Africa, Latin America | Medium term (2 to 4 years) |
Restraints
Device cost blocks sales where income and connectivity stay weak. ITU estimated only 27% of people in low-income countries used the internet in 2024, versus 93% in high-income economies, while Africa stood near 38%. Joint ITU and UNICEF evidence shows only 6% of children and young people in low-income countries have home internet, against 87% in high-income countries. A connected tablet loses value when the home link is missing.
World Bank inflation tracking across as many as 209 countries through 2025 shows pressure on food, energy, and producer prices. Those bills crowd out discretionary electronics and raise plastics and logistics costs. Vendors must fund subsidies, financing, or thinner specs. Margin compression of about 3% to 6% can remove roughly 2.3 points from baseline CAGR through delayed buys.
| Restraint | (~) % Impact on CAGR Forecast | Geographic Relevance | Impact Timeline |
|---|---|---|---|
| Low-Income Affordability Barrier | -2.3% | Africa, South Asia, low-income economies | Short term (2 years or less) |
| School Device Restrictions | -1.6% | Europe, North America, selected Asia-Pacific markets | Short term (2 years or less) |
| Mandatory Child-Privacy Compliance | -1.3% | North America, Europe | Short term (2 years or less) |
| Short Replacement-Cycle Resistance | -0.9% | Global consumer channel | Medium term (2 to 4 years) |
| Retail Price Competition | -0.7% | Global, strongest in emerging markets | Short term (2 years or less) |
Challenges
Educational value depends on controlled use, not device count alone. UNESCO’s 2023 education-technology assessment said classroom technology should run only when it clearly supports learning. Research across 14 countries linked uncontrolled mobile use with weaker performance, and distraction can need up to 20 minutes for refocus. UNICEF also flags access gaps, app cost, and poor cultural fit as barriers to good digital use.
Manufacturers must fund age-banded interfaces, session limits, distraction-free modes, and independent efficacy studies. Those efforts can add about 2% to 4% to software and product-development spend. Weak outcome proof can stretch school pilots by roughly 6 to 12 months. That friction can drag maximum CAGR potential by about 1.7 points and open space for proof-led service contracts.
| Challenge | (~) % CAGR Friction Drag | Geographic Relevance | Mitigation Horizon |
|---|---|---|---|
| Screen-Time Outcome Validation | -1.7% | Global | Medium term (2 to 4 years) |
| Fragmented Content Ecosystems | -1.4% | Global, multilingual markets | Medium term (2 to 4 years) |
| Semiconductor Supply Concentration | -1.1% | Global | Long term (4 years or more) |
| Ruggedization Cost Trade-Offs | -0.8% | Global | Medium term (2 to 4 years) |
| After-Sales Service Complexity | -0.6% | Emerging and geographically dispersed markets | Long term (4 years or more) |
Opportunities
Offline-first learning bundles remain open white space because many tablets still assume steady home broadband. ITU counted 2.6 billion people offline in 2024 and only about 35% internet penetration in least-developed countries. UNICEF showed online, mobile, and offline learning architecture across 43 countries with 3.6 million course completions by June 2024. Home access for children sits near 5% in West and Central Africa versus a 33% global average.
Vendors that ship cached curricula, low-bandwidth sync, solar-friendly charging, and institutional licenses can cut recurring data use by an estimated 60% to 80%. Effective user operating cost can fall about 15% to 25%. Service-led gross margin can rise roughly 4 to 7 points. That mix supports about 2.0 points of CAGR upside without relying only on premium hardware prices.
| Opportunity | (~) % Potential CAGR Upside | Geographic Relevance | Execution Window |
|---|---|---|---|
| Offline-First Learning Bundles | +2.0% | Africa, South Asia, Latin America, remote communities | Medium term (2 to 4 years) |
| Subscription Content Ecosystems | +1.6% | North America, Europe, developed Asia-Pacific | Medium term (2 to 4 years) |
| Therapy and Accessibility Verticals | +1.3% | Global healthcare and special-education channels | Long term (4 years or more) |
| Certified Refurbishment Programs | +1.0% | Emerging markets and public-school systems | Medium term (2 to 4 years) |
| Privacy-Preserving Edge AI | +0.8% | North America, Europe, developed Asia-Pacific | Long term (4 years or more) |
Key Company Insights
Amazon.com, Inc. anchors kids tablets through Fire OS, kids profiles, and content subscriptions that lower hardware sticker shock. This stack turns devices into gateways for recurring media revenue. Parents gain simple profiles while Amazon deepens ecosystem lock-in. Competitors without a matching content library must discount hardware harder to win the same household.
Apple Inc. positions iPad as a premium safe device with Child Accounts for users under 13, default filters, and expanded age ratings. Apple shipped these protections through iPadOS 26 and five other OS families as free updates in 2025. Pew data also show daily screen use among ages 2 to 4 rising from 38% to 51% between 2020 and 2025. Trust and long support cycles defend ASP even when Android leads unit share.
Key Players
- Amazon.com, Inc.
- Apple Inc.
- Samsung Electronics Co., Ltd.
- Lenovo Group Limited
- Huawei Technologies Co., Ltd.
- Microsoft Corporation
- VTech Holdings Limited
- LeapFrog Enterprises, Inc.
- Xiaomi Corporation
- ASUSTeK Computer Inc.
- KD Group
- Contixo Inc.
- Dragon Touch
- Shenzhen Kewang Communication Co., Ltd.
- Micromax Informatics Ltd.
Recent Developments
- November 2025: Samsung launched the Galaxy Tab A11+ Kids Edition with Samsung Kids features, parental controls, a protective case, stylus support, and child-oriented accessories to strengthen its family tablet position.
- March 2025: TCL showcased the NXTPAPER 11 Plus tablet at Mobile World Congress 2025, expanding its child and education-friendly lineup with AI functions, personalized display modes, and paper-like viewing technology.
Geopolitical Impact Analysis
According to UNCTAD commentary on 2025 trade, protectionism and shifting strategies raise uncertainty for goods flows that include consumer electronics. Figures from related tariff tracking show US measures that lifted some China semiconductor-related levies toward 50% in 2025 from 25% in 2024 in discussed policy paths, while broader reciprocal frameworks left a standing 10% layer during pauses. Kids tablet BOMs rely on displays, memory, and processors that cross these lanes. As a result, landed cost volatility forces dual sourcing and higher inventory buffers for OEMs.
Data from ITU show global internet use near 74% of the population in 2025, or about 6 billion people, up from roughly 5.8 billion in 2024. This wider base still depends on stable device imports into emerging classrooms. Shipping and component delays from trade friction can stretch school delivery windows by weeks. Vendors who localize final assembly closer to India, Mexico, or ASEAN reduce tariff exposure and protect tender timelines.
Report Scope
| Report Features | Description |
|---|---|
| Market Value (2025) | USD 20.30 Billion |
| Forecast Revenue (2035) | USD 90.40 Billion |
| CAGR (2026-2035) | 16.1% |
| Base Year for Estimation | 2025 |
| Historic Period | 2020-2024 |
| Forecast Period | 2026-2035 |
| Report Coverage | Revenue Forecast, Market Dynamics, Market Opportunity Analysis, Technology and Innovation Landscape, Competitive Landscape, Recent Developments |
| Segments Covered | By Product Type (Full-featured kids tablets, Budget kids tablets, Hybrid tablets), By Connectivity (Wi-Fi only, Sim and cellular), By Operating System (Android, iOS, Amazon Fire OS, Other) |
| Regional Analysis | North America (US and Canada), Europe (Germany, France, The UK, Spain, Italy, and Rest of Europe), Asia Pacific (China, Japan, South Korea, India, Australia, and Rest of APAC), Latin America (Brazil, Mexico, and Rest of Latin America), Middle East and Africa (GCC, South Africa, and Rest of MEA) |
| Competitive Landscape | Amazon.com, Inc., Apple Inc., Samsung Electronics Co., Ltd., Lenovo Group Limited, Huawei Technologies Co., Ltd., Microsoft Corporation, VTech Holdings Limited, LeapFrog Enterprises, Inc., Xiaomi Corporation, ASUSTeK Computer Inc., KD Group, Contixo Inc., Dragon Touch, Shenzhen Kewang Communication Co., Ltd., Micromax Informatics Ltd. |
| Customization Scope | Customization for segments, region / country-level will be provided. Additional customization can be done based on requirements. |
| Purchase Options | We have three licenses to opt for: Single User License | Multi-User License (Up to 5 Users) | Corporate Use License (Unlimited User and Printable PDF) |





































