
Global Heatmap Analytics Software Market Size, Share, Growth Analysis By Component (Software [Cloud-Based, On-Premises], Services), By Application (Website Optimization, User Experience Analytics, Conversion Rate Optimization, Marketing Analytics, Others), By End-User (Small & Medium Enterprises (SMEs), Large Enterprises), By Industry Vertical (E-commerce, BFSI, Healthcare, Retail & Ecommerce, Media and Entertainment, IT and Telecom, Others), By Region and Companies - Industry Segment Outlook, Market Assessment, Competition Scenario, Statistics, Trends and Forecast 2025-2035
- Published date: Mar 2026
- Report ID: 183117
- Number of Pages: 338
- Format:
-
keyboard_arrow_up
Quick Navigation
- Report Overview
- Core Key Insights
- Software Analysis
- Future Predictions
- Market Outlook
- Key Market Segments
- Research-Based Segments
- By Component
- By Application
- By End-User
- By Industry Vertical
- Regional Analysis
- US Market Size
- Driving Factors
- Restraint Factors
- Growth Opportunities
- Trending Factors
- Competitive Analysis
- Recent Developments
- Report Scope
Report Overview
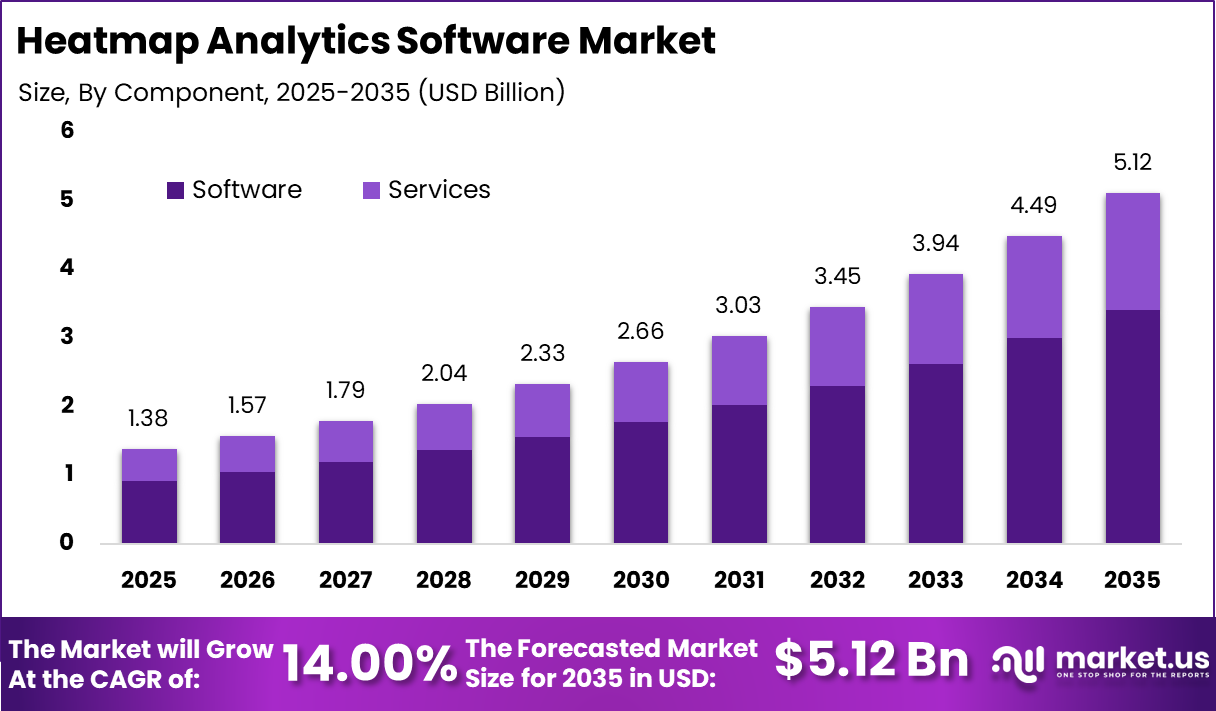
In the Heatmap Analytics Software Market, we are seeking clear, decision-oriented insights that support strategic planning and investment prioritization. The market demonstrates strong growth potential, with a value of USD 1.38 billion in 2025 and an expected expansion to USD 5.12 billion by 2035, reflecting a CAGR of 14.00%.
This trajectory indicates sustained demand for tools that enhance user experience visibility, digital optimization, and behavioral analytics across web and mobile platforms. From our perspective, the increasing reliance on data-driven decision-making across industries such as e-commerce, SaaS, and digital media is a key factor shaping market expansion.
Heatmap analytics software enables businesses to understand user interactions visually, helping improve conversion rates, interface design, and customer engagement. As digital competition intensifies, organizations are expected to allocate higher budgets toward analytics tools that provide actionable insights.
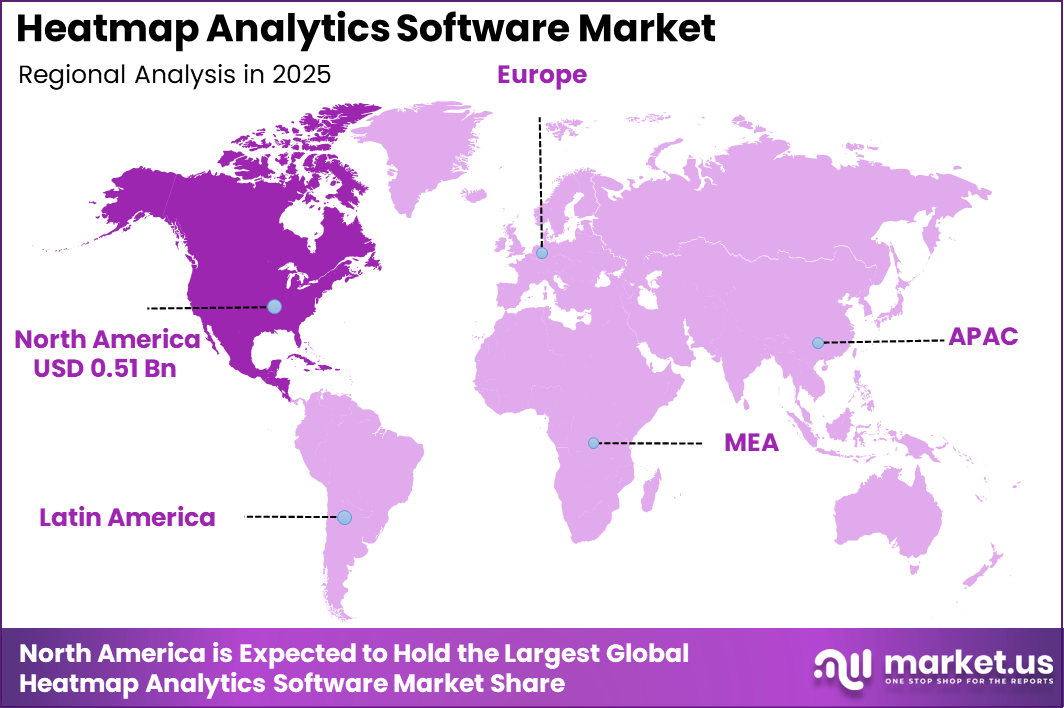
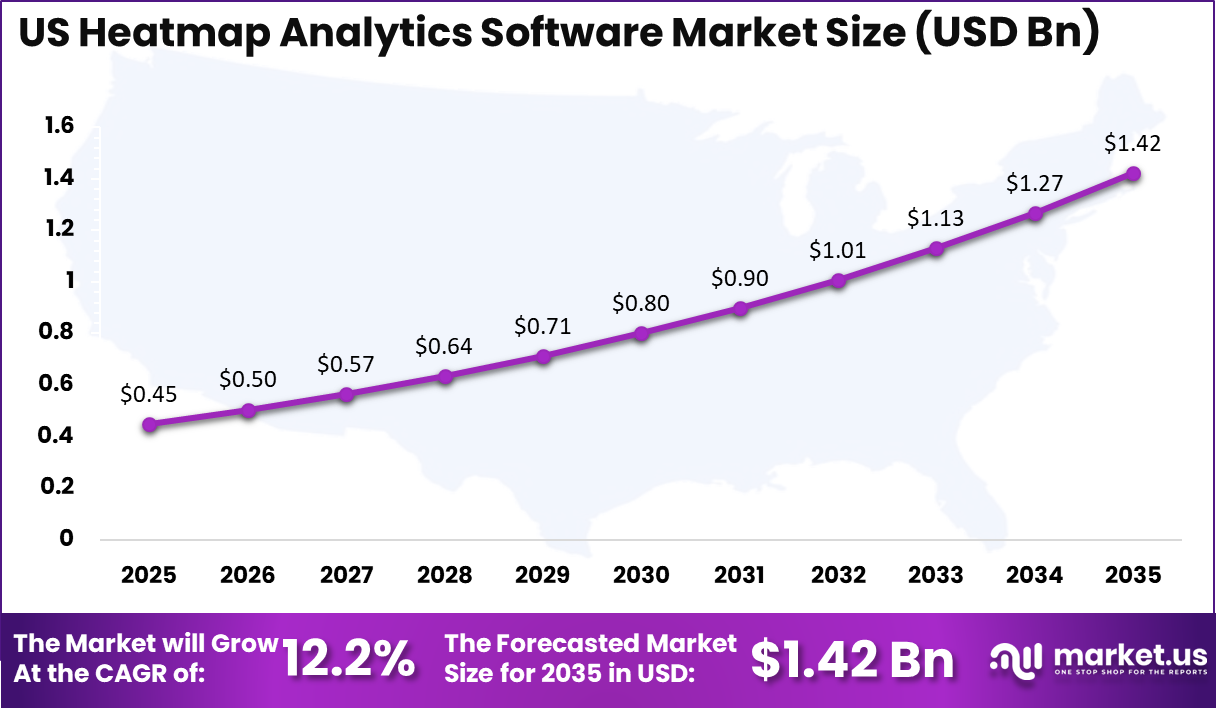
Regionally, North America holds a leading position with a 37.2% share, accounting for USD 0.51 Billion in 2025. The US remains the primary contributor, valued at USD 0.45 billion in 2025 and projected to reach USD 1.42 billion by 2035, growing at a CAGR of 12.2%.
This dominance reflects advanced digital infrastructure, early adoption of analytics technologies, and the strong presence of technology-driven enterprises. Overall, the market outlook aligns well with our requirements for scalable, insight-driven solutions supporting digital growth strategies.
From a client standpoint, the demand for heatmap analytics software aligns closely with broader digital behavior trends and measurable user interaction data. Studies indicate that over 88% of online users are less likely to return to a website after a poor user experience, which directly increases the need for tools that visually track engagement patterns.
Around 73% of businesses globally now consider user experience a critical factor in achieving conversion goals, reinforcing the importance of behavioral analytics solutions such as heatmaps. In terms of usage behavior, click-based heatmaps reveal that nearly 60–70% of user interactions are concentrated on the top half of a webpage, while scroll tracking data shows that only about 25% of users typically reach the bottom of a page.
This highlights a strong need for layout optimization and content positioning insights. Additionally, A/B testing supported by heatmap tools has been observed to improve conversion rates by 20–30% across e-commerce platforms.
On the enterprise side, approximately 65% of mid-to-large organizations have already integrated some form of behavioral analytics into their digital strategy, with adoption rates increasing steadily among small businesses. Mobile interaction tracking is also gaining traction, as mobile devices contribute to over 58% of global website traffic, making mobile heatmaps essential for performance optimization.
Core Key Insights
- The market is valued at USD 1.38 billion in 2025 and is projected to reach USD 5.12 billion by 2035, reflecting strong long-term expansion supported by a CAGR of 14.00%, indicating sustained demand for user behavior analytics and digital optimization tools.
- North America dominates with a 37.2% share, accounting for USD 0.51 Billion in 2025, driven by high digital maturity, strong adoption of analytics platforms, and widespread presence of technology-focused enterprises.
- The US remains the key contributor, valued at USD 0.45 billion in 2025 and expected to reach USD 1.42 billion by 2035, growing at a CAGR of 12.2%, supported by increasing focus on customer experience and conversion rate optimization.
- By component, software holds 66.7%, highlighting the growing preference for scalable, cloud-based, and integrated analytics solutions over standalone services.
- By application: website optimization leads with 38.4%, reflecting the critical role of heatmap tools in improving user journeys, reducing bounce rates, and enhancing engagement.
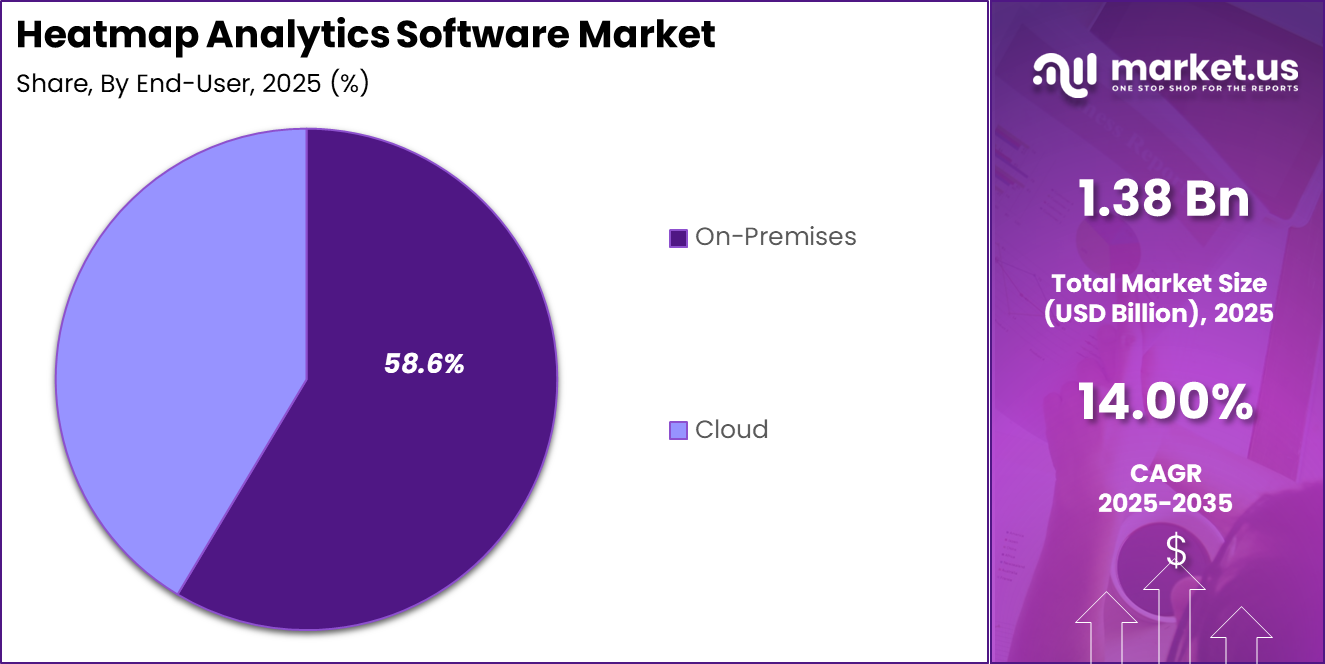
- By end-user, large enterprises account for 58.6%, as these organizations invest heavily in advanced analytics to support data-driven decision-making and digital transformation initiatives.
- By industry vertical: retail & ecommerce leads with 29.3%, driven by the need to analyze customer behavior, optimize product placement, and improve online conversion performance.
Software Analysis
Software forms the backbone of heatmap analytics adoption, as organizations prioritize real-time visibility into user behavior across digital platforms. Industry data shows that more than 70% of companies running customer-facing websites now deploy at least one analytics tool with visual tracking features.
Heatmap software is emerging as a preferred choice due to its intuitive insights. Nearly 62% of digital teams rely on session replay and click-tracking capabilities to identify usability gaps, while over 55% use scroll-depth analysis to optimize content placement.
Cloud-based deployment continues to dominate the software landscape, with approximately 68% of analytics tools delivered through SaaS models. This shift supports faster implementation, lower upfront costs, and seamless integration with platforms such as content management systems and customer data tools. Integration capability remains critical, as around 64% of enterprises prioritize software that connects with A/B testing tools, CRM systems, and marketing automation platforms.
Performance impact is also measurable. Businesses using heatmap software alongside optimization strategies report conversion improvements ranging between 18% and 32%. Additionally, page engagement time has been observed to increase by nearly 25% after implementing data-driven UI changes. Mobile-specific analytics is gaining traction, with over 57% of software users actively analyzing mobile user behavior, reflecting the growing dominance of mobile traffic in digital ecosystems.
Future Predictions
From a client perspective, the future of heatmap analytics software is expected to move beyond basic visualization toward predictive and automated decision-making. Over the next decade, close to 65% of digital analytics platforms are anticipated to embed artificial intelligence to automatically identify user friction points and recommend interface improvements.
This shift is likely to reduce manual analysis time by nearly 40%, allowing teams to focus more on execution and strategy. The integration of real-time analytics is also projected to expand significantly, with more than 60% of enterprises expected to adopt live user tracking to respond instantly to behavioral changes.
This will be particularly valuable for high-traffic platforms where even minor interface adjustments can influence thousands of user interactions per hour. Additionally, cross-device tracking capabilities are anticipated to improve, as nearly 75% of users now interact with brands across multiple devices before completing an action.
Privacy-focused analytics is expected to become a major priority, with over 68% of organizations planning to adopt cookieless tracking solutions to comply with evolving data regulations. At the same time, mobile-first analytics will continue to gain importance, as mobile usage is projected to exceed 65% of total web traffic. Overall, the market is expected to evolve toward smarter, faster, and more privacy-compliant analytics solutions that directly support business growth.
Market Outlook
From a client perspective, the outlook for the heatmap analytics software market remains highly positive, supported by the growing need for actionable user behavior insights and continuous digital optimization. As businesses increasingly compete on user experience, nearly 72% of organizations are expected to prioritize experience analytics tools as a core part of their digital strategy.
This shift is driven by the direct link between user engagement and revenue performance, especially in sectors such as retail, financial services, and SaaS platforms. Adoption is expected to expand across mid-sized businesses, with close to 58% of small and medium enterprises planning to invest in behavioral analytics tools to improve website performance and customer retention.
The rise of mobile and app-based ecosystems further strengthens market demand, as over 60% of digital interactions now occur on mobile devices, requiring more advanced tracking and visualization tools. In parallel, integration with broader analytics ecosystems is anticipated to accelerate, with around 67% of enterprises focusing on unified data platforms that combine heatmaps with customer journey analytics and personalization engines.
Emerging technologies such as AI-driven insights and automated optimization are expected to enhance efficiency and decision accuracy. Overall, the market outlook reflects steady expansion, driven by increasing digitalization, higher expectations for user experience, and the need for measurable performance improvements.
Key Market Segments
From a client perspective, the key market segments of heatmap analytics software reflect where demand is most concentrated and where investment returns are expected to be strongest. By component, software leads with a 66.7% share, indicating a strong preference for scalable, easy-to-deploy solutions that deliver real-time behavioral insights. Organizations are increasingly choosing integrated platforms that combine click tracking, scroll mapping, and session replay within a single interface.
By application, website optimization holds a 38.4% share, highlighting its critical role in improving user journeys and conversion rates. Businesses actively use heatmap tools to refine page layouts, identify drop-off points, and enhance content positioning based on actual user interaction patterns. This segment continues to expand as digital competition intensifies.
By end-user, large enterprises dominate with 58.6%, driven by their extensive digital presence and higher budgets for advanced analytics tools. These organizations rely heavily on data-driven insights to support decision-making, optimize customer experience, and manage large volumes of traffic across multiple platforms.
By industry vertical, retail and ecommerce account for 29.3%, reflecting the sector’s strong focus on conversion optimization and customer engagement. Heatmap analytics plays a key role in improving product visibility, navigation flow, and checkout processes, directly influencing online sales performance.
Research-Based Segments
By Component
- Software
- Cloud-Based
- On-Premises
- Services
By Application
- Website Optimization
- User Experience Analytics
- Conversion Rate Optimization
- Marketing Analytics
- Others
By End-User
- Small & Medium Enterprises (SMEs)
- Large Enterprises
By Industry Vertical
- E-commerce
- BFSI
- Healthcare
- Retail & Ecommerce
- Media and Entertainment
- IT and Telecom
- Others
By Component
66.7% of the market is captured by software, making it the most influential component in heatmap analytics adoption due to its ability to deliver real-time, scalable, and actionable user insights. Within this segment, cloud-based solutions are gaining strong traction, as nearly 68% of organizations prefer SaaS deployment models for their flexibility, faster implementation, and lower infrastructure costs.
Cloud-based platforms also enable seamless integration with marketing tools, content management systems, and analytics dashboards, which is critical for unified data visibility. On-premises solutions continue to hold relevance among enterprises with strict data security and compliance requirements.
Around 32% of large organizations still opt for on-premises deployment to maintain full control over sensitive user data, especially in regulated industries such as finance and healthcare. These solutions are often customized to align with internal IT frameworks and security protocols.
The services segment, although smaller, plays a supportive role in implementation, customization, and ongoing optimization. Approximately 40% of companies adopting heatmap software seek external support for integration, training, and performance analysis.
This highlights the growing need for expertise in translating behavioral data into actionable strategies. Overall, the software segment is expected to remain dominant, supported by continuous innovation in cloud capabilities and integration features.
By Application
38.4% of the market is driven by website optimization, making it the leading application area as businesses focus on improving digital performance and user engagement. Organizations increasingly rely on heatmap analytics to understand how users interact with web pages, identify friction points, and enhance layout effectiveness.
Data suggests that companies implementing heatmap-driven optimization strategies can improve page engagement by over 25%, reinforcing the importance of this segment. User experience analytics plays a critical supporting role, as nearly 70% of digital teams prioritize understanding user journeys to reduce bounce rates and improve navigation flow. Heatmaps help visualize user attention, enabling teams to refine interface design and content hierarchy.
Conversion rate optimization is another key application, where businesses use behavioral insights to improve call-to-action placement and checkout processes. Studies indicate that conversion rates can increase by 20–30% when data-driven adjustments are applied.
Marketing analytics also benefits significantly, with around 60% of marketers using heatmaps to evaluate campaign performance and landing page effectiveness. This helps in aligning content strategies with user behavior patterns.
Other applications, including product testing and content analysis, continue to expand as organizations seek deeper insights. Overall, the application segment is expected to grow steadily, driven by the need for continuous digital optimization and measurable performance improvements.
By End-User
58.6% of the market is held by large enterprises, reflecting their strong investment capacity and advanced digital infrastructure that supports large-scale analytics adoption. These organizations typically manage high-traffic platforms, where even small improvements in user experience can translate into significant revenue gains.
Nearly 72% of large enterprises rely on behavioral analytics tools to guide decision-making across marketing, product development, and customer experience teams. Their focus on data-driven strategies, combined with the need for real-time insights, makes heatmap software a critical component of their digital ecosystem.
Small and medium enterprises (SMEs) are steadily increasing adoption, driven by the growing availability of cost-effective and cloud-based solutions. Around 54% of SMEs now prioritize website optimization and user behavior tracking as part of their growth strategy. While budgets are comparatively limited, SMEs benefit from simplified tools that offer quick insights without complex implementation. The rise of subscription-based pricing models has further lowered entry barriers, enabling wider adoption.
Both segments are expected to see continued growth, with large enterprises focusing on advanced integrations and predictive analytics, while SMEs emphasize ease of use and affordability. This balanced demand across enterprise sizes is anticipated to support long-term market expansion.
By Industry Vertical
29.3% of the market is led by retail and ecommerce, driven by the sector’s strong focus on customer journey optimization and conversion improvement. Businesses in this segment actively use heatmap analytics to track user behavior across product pages, category layouts, and checkout flows. Nearly 68% of online retailers rely on behavioral insights to refine product placement and improve navigation, which directly influences purchase decisions and reduces cart abandonment rates.
E-commerce platforms continue to expand rapidly, with over 60% of digital transactions now occurring through online channels, increasing the need for detailed interaction tracking. In BFSI, adoption is rising as financial institutions focus on improving digital onboarding and user interface efficiency, with around 55% of banks prioritizing customer experience analytics.
Healthcare organizations are also integrating heatmap tools to enhance patient portal usability and appointment booking systems. Media and entertainment platforms leverage heatmaps to optimize content engagement, as nearly 65% of users interact with visual content differently based on layout and accessibility.
IT and telecom companies use these tools to improve service portals and customer support interfaces. Other industries, including education and travel, are gradually adopting heatmap analytics to enhance digital engagement. Overall, industry-wide demand is expected to grow steadily as user experience becomes a key competitive factor.
Regional Analysis
37.2% of the market is concentrated in North America, with a value of USD 0.51 Billion in 2025, reflecting the region’s strong leadership in digital technologies and analytics adoption. This dominance is supported by the high penetration of e-commerce platforms, advanced IT infrastructure, and early adoption of user experience optimization tools across industries.
Nearly 75% of enterprises in the region prioritize customer experience as a key business metric, which directly drives the demand for heatmap analytics solutions. The US plays a central role in regional growth, as organizations increasingly invest in tools that provide actionable insights into user behavior.
Around 70% of digital businesses in North America actively use behavioral analytics to improve website performance and conversion rates. The presence of large technology firms and a strong startup ecosystem further accelerates innovation and adoption.
In addition, regulatory awareness and a data-driven decision-making culture support the integration of advanced analytics tools. Mobile and multi-device tracking is also widely adopted, with over 65% of user interactions occurring across multiple platforms.
Overall, North America is expected to maintain its leading position, supported by continuous digital transformation, high analytics maturity, and strong demand for performance-driven insights.
US Market Size
The US heatmap analytics software market is valued at USD 0.45 Billion in 2025 and is projected to reach USD 1.42 billion by 2035, expanding at a CAGR of 12.2%, reflecting steady and sustained demand for advanced digital analytics solutions. This growth is supported by the strong presence of digital-first businesses and increasing investments in customer experience optimization across industries such as retail, financial services, and SaaS platforms.
From a client perspective, the US market demonstrates high maturity in analytics adoption, with nearly 74% of organizations already leveraging behavioral data to enhance website performance and user engagement.
Companies are actively using heatmap tools to refine user interfaces, reduce bounce rates, and improve conversion funnels. The growing importance of mobile optimization is also evident, as over 60% of web traffic in the US originates from mobile devices, driving demand for mobile-specific analytics capabilities.
Additionally, the integration of heatmap software with broader analytics ecosystems, including A/B testing and personalization platforms, is becoming increasingly common. Around 66% of enterprises prioritize unified data environments to streamline decision-making. Overall, the US market is expected to maintain strong momentum, supported by continuous innovation, high digital spending, and a strong focus on data-driven business strategies.
Regional Analysis and Coverage
- North America
- US
- Canada
- Europe
- Germany
- France
- The UK
- Spain
- Italy
- Russia
- Netherlands
- Rest of Europe
- Asia Pacific
- China
- Japan
- South Korea
- India
- Australia
- Singapore
- Thailand
- Vietnam
- Rest of Latin America
- Latin America
- Brazil
- Mexico
- Rest of Latin America
- Middle East & Africa
- South Africa
- Saudi Arabia
- UAE
- Rest of MEA
Driving Factors
The growth of the heatmap analytics software market is strongly supported by the rising importance of user experience in digital environments. Nearly 72% of businesses now consider customer experience a primary factor influencing revenue growth, which increases the need for tools that provide clear visibility into user behavior.
Heatmap analytics enables organizations to identify where users click, scroll, and drop off, helping improve engagement and conversion rates. Around 65% of companies report better website performance after implementing behavioral analytics tools. The rapid expansion of e-commerce and digital platforms also drives demand, as businesses compete to optimize every stage of the customer journey.
Additionally, mobile usage continues to rise, with more than 60% of web traffic coming from mobile devices, creating a strong need for mobile-specific interaction insights. Integration with marketing and analytics platforms further enhances the value of heatmap tools, allowing organizations to make faster and more informed decisions based on real-time data.
Restraint Factors
Despite strong growth, several factors limit the adoption of heatmap analytics software. One major concern is data privacy and compliance, as nearly 68% of organizations express challenges in managing user data responsibly under evolving regulations. Collecting and analyzing user interaction data requires strict adherence to privacy frameworks, which can increase operational complexity.
Additionally, around 45% of small businesses face budget constraints, making it difficult to invest in advanced analytics tools. Technical challenges also exist, as nearly 40% of companies report difficulties in integrating heatmap software with existing systems such as CRM and content management platforms.
There is also a skills gap, with approximately 35% of organizations lacking trained professionals to interpret behavioral data effectively. Misinterpretation of heatmap insights can lead to incorrect optimization decisions, reducing the effectiveness of implementation. These challenges collectively slow down adoption, particularly among smaller organizations and industries with strict regulatory requirements.
Growth Opportunities
The market presents significant opportunities driven by advancements in technology and expanding digital ecosystems. Nearly 67% of organizations are expected to invest in AI-powered analytics tools to enhance decision-making and automate user behavior analysis. Heatmap software integrated with artificial intelligence can identify patterns, predict user actions, and suggest improvements without manual intervention.
The rise of mobile applications and progressive web apps creates additional demand, as over 65% of users interact with brands across multiple devices. This increases the need for cross-platform heatmap tracking solutions. Emerging markets also offer strong growth potential, with digital adoption increasing by over 20% in developing regions.
Small and medium enterprises are becoming key contributors, as more than 55% plan to adopt cost-effective analytics solutions to improve online presence. Additionally, industries such as healthcare, education, and BFSI are expanding their digital interfaces, creating new use cases for heatmap analytics. These factors collectively create a favorable environment for sustained market expansion.
Trending Factors
Several key trends are shaping the evolution of the heatmap analytics software market. One of the most notable trends is the shift toward real-time analytics, with nearly 62% of organizations prioritizing instant insights to respond quickly to user behavior changes. Another emerging trend is the integration of heatmaps with session replay and journey analytics, enabling businesses to gain a more comprehensive understanding of user interactions.
Privacy-focused analytics is also gaining importance, as around 70% of companies explore cookieless tracking solutions to comply with global data regulations. The adoption of AI-driven insights continues to grow, allowing automated detection of usability issues and personalized recommendations.
Additionally, no-code and low-code platforms are becoming popular, with nearly 50% of users preferring tools that require minimal technical expertise. Mobile-first analytics is another critical trend, as mobile traffic dominates digital engagement. These trends indicate a shift toward smarter, more accessible, and privacy-compliant analytics solutions that align with evolving business needs.
Competitive Analysis
The competitive landscape of the heatmap analytics software market is moderately fragmented, with a mix of specialized heatmap providers and broader digital analytics platforms competing on innovation, integration, and user experience capabilities.
Key players such as Hotjar, Contentsquare, FullStory, Crazy Egg, and Microsoft Clarity have established strong positioning by offering a combination of heatmaps, session replay, and behavioral analytics features. Hotjar alone accounts for a significant share of usage among websites, indicating strong adoption due to ease of use and all-in-one functionality.
These companies focus on delivering intuitive dashboards and actionable insights that help businesses improve conversion rates and user engagement. Competition is primarily driven by feature differentiation and platform integration. Leading vendors are expanding beyond basic heatmaps to include AI-driven insights, journey analytics, and real-time tracking capabilities.
Enterprise-focused platforms such as Contentsquare and FullStory emphasize deep analytics and scalability, while tools like Crazy Egg and Microsoft Clarity target small and mid-sized businesses with cost-effective solutions. Additionally, vendors are increasingly integrating their tools with marketing automation, CRM systems, and A/B testing platforms to enhance value.
Overall, the market is highly innovation-driven, with continuous product upgrades, freemium models, and user-centric features shaping competition. Companies that offer seamless integration, real-time insights, and privacy-compliant analytics are expected to gain a stronger competitive advantage in the evolving digital ecosystem.
Top Key Players in the Market
- Hotjar
- Crazy Egg
- Contentsquare
- Clicktale (now part of Contentsquare)
- FullStory
- Lucky Orange
- Mouseflow
- Smartlook
- Inspectlet
- SessionCam (now part of Glassbox)
- Glassbox
- Zoho PageSense
- Others
Recent Developments
- In 2025, Contentsquare completed the acquisition of Loris AI, strengthening its capabilities in predictive analytics and customer behavior intelligence, further enhancing its position in experience analytics and heatmap-based insights.
- In 2025, Hotjar continued expanding its platform capabilities by integrating user feedback tools such as surveys and NPS tracking alongside heatmaps, helping organizations combine qualitative and quantitative insights for improved decision-making.
- In 2026, FullStory advanced its platform by integrating AI-powered analytics features such as StoryAI, enabling enterprises to analyze unsampled session data and attribute user behavior directly to revenue impact.
Report Scope
Report Features Description Market Value (2025) USD 1.38 Billion Forecast Revenue (2035) USD 5.12 Billion CAGR(2025-2035) 14.00% Base Year for Estimation 2025 Historic Period 2020-2024 Forecast Period 2026-2035 Report Coverage Revenue forecast, AI impact on Market trends, Share Insights, Company ranking, competitive landscape, Recent Developments, Market Dynamics, and Emerging Trends Segments Covered By Component (Software [Cloud-Based, On-Premises], Services), By Application (Website Optimization, User Experience Analytics, Conversion Rate Optimization, Marketing Analytics, Others), By End-User (Small & Medium Enterprises (SMEs), Large Enterprises), By Industry Vertical (E-commerce, BFSI, Healthcare, Retail & Ecommerce, Media and Entertainment, IT and Telecom, Others) Regional Analysis North America – US, Canada; Europe – Germany, France, The UK, Spain, Italy, Russia, Netherlands, Rest of Europe; Asia Pacific – China, Japan, South Korea, India, New Zealand, Singapore, Thailand, Vietnam, Rest of Latin America; Latin America – Brazil, Mexico, Rest of Latin America; Middle East & Africa – South Africa, Saudi Arabia, UAE, Rest of MEA Competitive Landscape Hotjar, Crazy Egg, Contentsquare, Clicktale (now part of Contentsquare), FullStory, Lucky Orange, Mouseflow, Smartlook, Inspectlet, SessionCam (now part of Glassbox), Glassbox, Zoho PageSense, Others Customization Scope Customization for segments, region/country-level will be provided. Moreover, additional customization can be done based on the requirements. Purchase Options We have three licenses to opt for: Single User License, Multi-User License (Up to 5 Users), Corporate Use License (Unlimited Users and Printable PDF)  Heatmap Analytics Software MarketPublished date: Mar 2026add_shopping_cartBuy Now get_appDownload Sample
 -
-
- Hotjar
- Crazy Egg
- Contentsquare
- Clicktale (now part of Contentsquare)
- FullStory
- Lucky Orange
- Mouseflow
- Smartlook
- Inspectlet
- SessionCam (now part of Glassbox)
- Glassbox
- Zoho PageSense
- Others
Our Clients
- 183117
- Mar 2026


