
Global Graph Analytics In Banking Market By Component (Software/Platforms, Services), By Deployment Mode (Cloud-based, On-premises), By Organization Size (Large Enterprises, Small and Medium-sized Enterprises (SMEs)), By Application (Fraud Detection & Financial Crime, Customer 360 & Relationship Analysis, Others), By End-User (Retail Banks, Investment Banks ), By Regional Analysis, Global Trends and Opportunity, Future Outlook By 2025-2035
- Published date: Feb. 2026
- Report ID: 176883
- Number of Pages: 296
- Format:
-
keyboard_arrow_up
Quick Navigation
- Report Overview
- Top Market Takeaways
- Key Statistics
- Drivers Impact Analysis
- Restraints Impact Analysis
- By Component
- By Deployment Mode
- By Organization Size
- By Application
- By End User
- Investor Type Impact Matrix
- Technology Enablement Analysis
- Key Market Segments
- Regional Analysis
- Emerging Trends Analysis
- Growth Factors Analysis
- Opportunity Analysis
- Challenge Analysis
- Customer Impact: Trends and Disruptors
- Competitive Analysis
- Future Outlook
- Recent Developments
- Report Scope
Report Overview
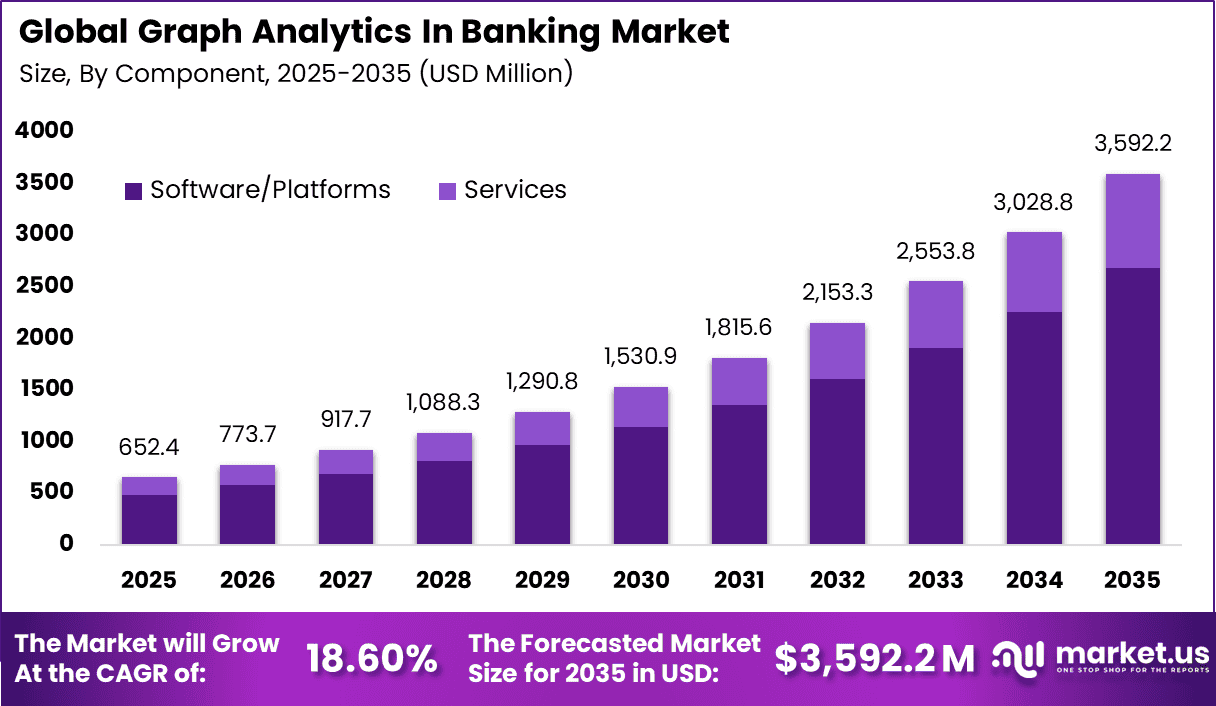
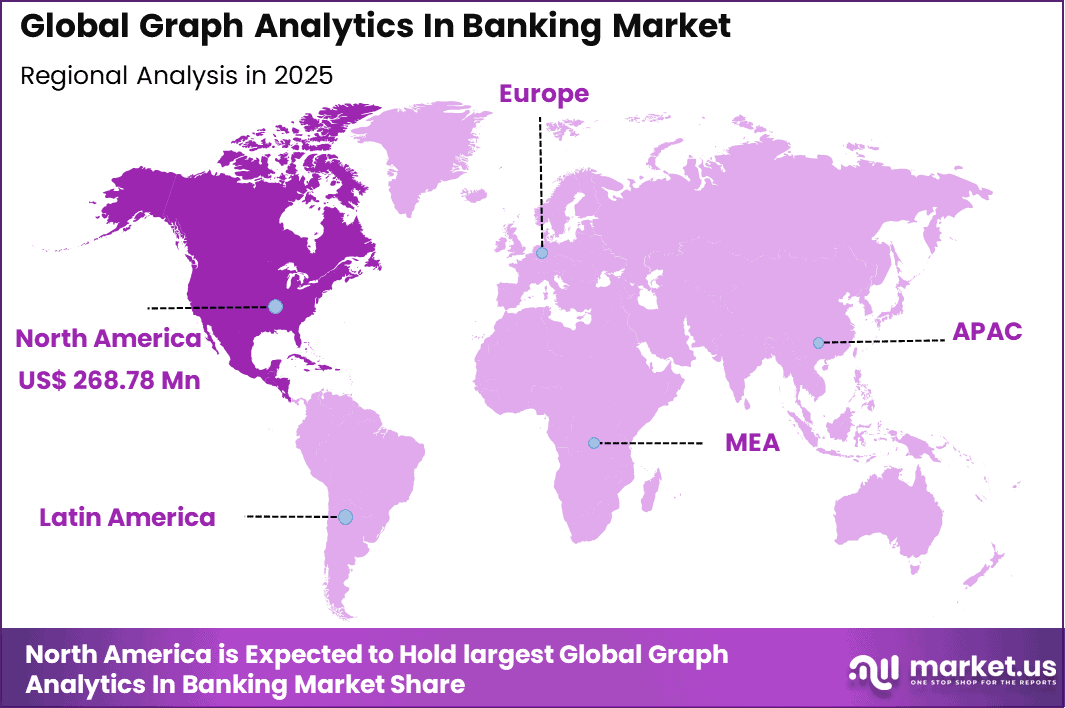
The Global Graph Analytics In Banking Market generated USD 652.4 million in 2025 and is predicted to register growth from USD 773.7 million in 2026 to about USD 3,592.2 million by 2035, recording a CAGR of 18.60% throughout the forecast span. In 2025, North America held a dominant market position, capturing more than a 41.2% share, holding USD 268.78 Million revenue.
The Graph Analytics in Banking Market refers to analytical platforms and methods that use graph based data structures to model, analyze, and interpret complex relationships within banking data. These systems represent entities such as customers, accounts, transactions, merchants, and devices as connected nodes and links. This structure allows banks to uncover hidden relationships and behavioral patterns that are difficult to detect with traditional tabular analytics.
Graph analytics is increasingly used to support fraud detection, risk management, and customer intelligence. By 2025, an estimated 80% of data and analytics innovations in banking are expected to leverage graph technologies. This shift reflects the growing need to understand complex relationships across customers, transactions, and accounts.
One of the main driving factors is the rise in sophisticated financial crime. Fraud and money laundering schemes now involve coordinated networks rather than isolated transactions. Traditional rule based systems struggle to identify these complex structures. Graph analytics enables banks to detect connected patterns and suspicious networks more effectively.
Demand for graph analytics is strongest among large banks handling high volumes of digital transactions. These institutions face greater exposure to fraud, compliance risk, and operational complexity. Graph based insights improve detection accuracy and investigation speed. This tangible operational value sustains demand.
Top Market Takeaways
- By component, software/platforms account for 74.6% of the market, delivering graph databases and visualization tools for mapping complex relationships in transaction networks.
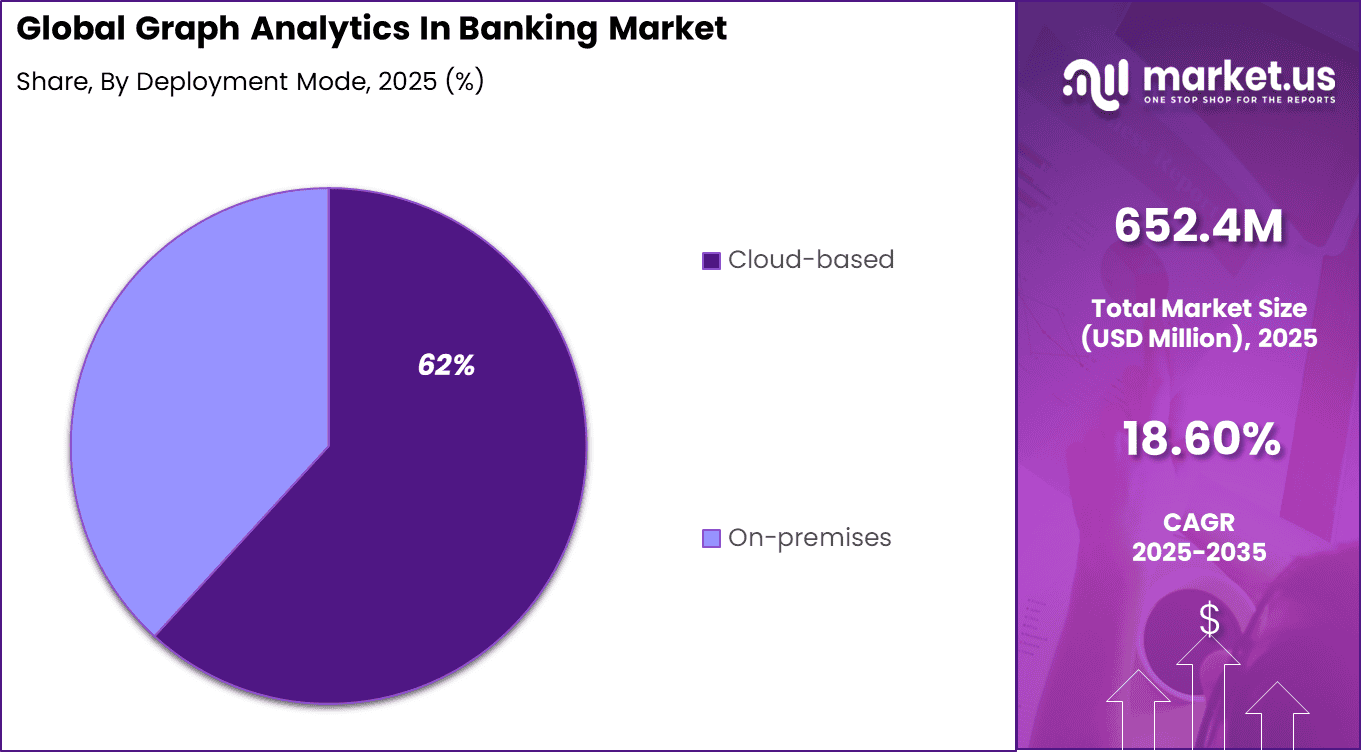
- By deployment mode, cloud-based solutions represent 61.8%, providing elasticity, advanced querying, and integration with big data ecosystems for real-time insights.
- By organization size, large enterprises hold 82.4% share, utilizing graph analytics for enterprise-scale fraud rings, customer 360 views, and compliance monitoring.
- By application, fraud detection & financial crime capture 47.3%, excelling at uncovering hidden patterns like money laundering rings and account takeovers through network analysis.
- By end-user, retail banks command 58.9%, leveraging these tools for anomaly detection in high-volume consumer transactions and personalized risk scoring.
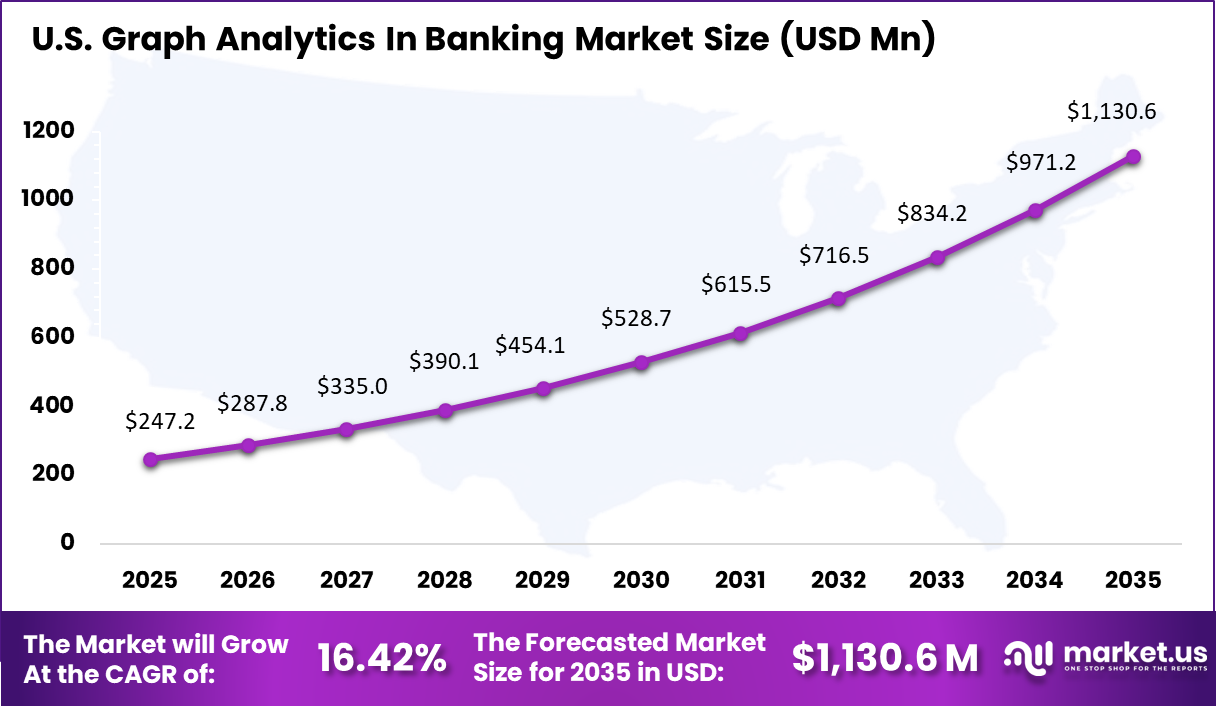
- By region, North America leads with 41.2% of the global market, where the U.S. is valued at USD 247.2 million with a projected CAGR of 16.42%, boosted by regulatory pressures and AI investments.
Key Statistics
- Graph technology adoption in enterprise projects is projected to increase from 10% in 2021 to nearly 80% by 2025, reflecting rapid expansion across analytics use cases.
- Implementation of graph analytics has resulted in up to a 200% increase in fraud detection capability for certain financial institutions.
- Major banks deploying advanced graph based models have reduced fraud related losses by approximately 20%, improving financial protection.
- Graph driven queries can perform 1 to 2 orders of magnitude faster than traditional SQL join operations, enhancing analytical speed and responsiveness.
- Investigators report time savings of 5 to 10 minutes per case through graph powered analysis, enabling quicker triage and more efficient case resolution.
Drivers Impact Analysis
Key Driver Impact on CAGR Forecast (~%) Geographic Relevance Impact Timeline Rising financial fraud, money laundering, and cybercrime risks +4.9% North America, Europe Short to medium term Growing adoption of advanced analytics for risk and compliance +4.1% Global Medium term Increasing regulatory scrutiny on transaction monitoring and AML +3.6% North America, Europe Medium term Expansion of digital banking and real-time payment networks +3.2% Global Medium term Need for relationship-based customer and entity analysis +2.8% North America, Asia Pacific Medium to long term Restraints Impact Analysis
Key Restraint Impact on CAGR Forecast (~%) Geographic Relevance Impact Timeline High implementation cost of graph analytics platforms -3.4% Emerging Markets Short to medium term Complexity in integrating graph engines with core banking systems -2.9% Global Medium term Shortage of skilled data science and graph analytics talent -2.4% Asia Pacific, Latin America Medium term Data privacy and governance challenges -2.0% Europe, North America Medium term Limited understanding of graph analytics among traditional banks -1.7% Emerging Markets Medium to long term By Component
Software and platform based solutions account for 74.6% of adoption in the graph analytics in banking market, as advanced analytics engines form the foundation of relationship based risk analysis. These platforms enable banks to map complex connections between accounts, transactions, and entities in real time. This capability is critical for uncovering hidden patterns that traditional rule based systems often miss.
Banks increasingly rely on integrated graph platforms to support faster investigations and scalable analysis. Standalone tools are being replaced by centralized platforms that combine visualization, analytics, and reporting. This shift continues to strengthen software led dominance across banking use cases.
By Deployment Mode
Cloud based deployment holds 62%, driven by the need for flexible computing power and rapid scalability. Graph analytics requires high processing capability to analyze large and dynamic data sets. Cloud environments support this requirement without heavy infrastructure investments.
Cloud deployment also enables faster model updates and easier integration with digital banking systems. Banks benefit from shorter deployment cycles and improved collaboration across risk and compliance teams. These operational advantages continue to support cloud adoption.
By Organization Size
Large enterprises represent 82.4% of total usage, reflecting their complex operational and risk environments. Large banks manage millions of customer relationships and transaction flows across multiple channels. Graph analytics helps these institutions detect interconnected risks at scale.
Regulatory expectations are also higher for large institutions. Advanced analytics tools support detailed monitoring and audit readiness. This keeps large enterprises as the primary adopters of graph based banking analytics.
By Application
Fraud detection and financial crime prevention account for 47.3% of applications, making it the leading use case. Graph analytics excels at identifying suspicious networks rather than isolated transactions. This is particularly effective against organized fraud, mule networks, and layered transactions.
As financial crime tactics become more sophisticated, banks require contextual risk insights. Graph based models improve accuracy and reduce false alerts. This strengthens their role in daily fraud monitoring operations.
By End User
Retail banks hold 58.9% of end user adoption, as they handle high volumes of consumer transactions. The scale and frequency of retail banking activity increase exposure to fraud and compliance risks. Graph analytics supports proactive monitoring across accounts and channels.
Retail banks also prioritize customer trust and service continuity. By improving fraud detection accuracy, these tools help reduce unnecessary transaction blocks. This balance between security and customer experience drives adoption in retail banking.
Investor Type Impact Matrix
Investor Type Growth Sensitivity Risk Exposure Geographic Focus Investment Outlook Banking analytics and risk software providers Very High Medium North America, Europe Strong long-term SaaS growth AI and big data platform vendors High Medium Global Platform-led expansion opportunity Banks and financial institutions Medium Low to Medium Global Strategic compliance investment Private equity firms Medium Medium North America, Europe Consolidation of analytics platforms Venture capital investors High High North America Innovation-led growth in graph AI Technology Enablement Analysis
Technology Enabler Impact on CAGR Forecast (~%) Primary Function Geographic Relevance Adoption Timeline Graph databases and relationship modeling engines +5.2% Complex network analysis Global Short to medium term AI and ML-based anomaly and pattern detection +4.4% Fraud and risk identification North America, Europe Medium term Real-time transaction graph analytics +3.9% Instant fraud prevention Global Medium term Cloud-based graph analytics platforms +3.3% Scalability and speed Global Medium to long term Explainable analytics and regulatory reporting tools +2.7% Compliance transparency Europe, North America Long term Key Market Segments
By Component
- Software/Platforms
- Services
By Deployment Mode
- Cloud-based
- On-premises
By Organization Size
- Large Enterprises
- Small and Medium-sized Enterprises (SMEs)
By Application
- Fraud Detection & Financial Crime
- Customer 360 & Relationship Analysis
- Know Your Customer & Anti-Money Laundering
- Credit Risk & Network Risk Assessment
- Others
By End-User
- Retail Banks
- Investment Banks
- Credit Card Companies
- Insurance Companies
Regional Analysis
North America holds a 41.2% share of the graph analytics in banking market, supported by advanced adoption of data analytics and strong focus on fraud prevention and risk intelligence. Banks in the region are increasingly using graph-based models to analyze complex relationships across transactions, accounts, and customer networks. Demand is reinforced by rising digital payment volumes and the need to detect hidden patterns linked to fraud, money laundering, and insider risks.
The United States market is valued at USD 247.2 Mn and is expanding at a CAGR of 16.42%, driven by large-scale investments in data-driven banking infrastructure. Adoption is influenced by regulatory pressure to strengthen transaction monitoring and improve transparency across financial networks. Growth is further supported by increased use of real-time analytics to enhance credit risk assessment, fraud detection accuracy, and operational decision-making.
Key Regions and Countries
- North America
- US
- Canada
- Europe
- Germany
- France
- The UK
- Spain
- Italy
- Russia
- Netherlands
- Rest of Europe
- Asia Pacific
- China
- Japan
- South Korea
- India
- Australia
- Singapore
- Thailand
- Vietnam
- Rest of APAC
- Latin America
- Brazil
- Mexico
- Rest of Latin America
- Middle East & Africa
- South Africa
- Saudi Arabia
- UAE
- Rest of MEA
Emerging Trends Analysis
An emerging trend in the graph analytics in banking market is the adoption of real-time graph processing. Traditional analytics often operate in batch mode, but fraud and risk detection benefit from near instant insights. Real-time graph updates and streaming graph analytics support faster detection of suspicious linkages as events occur. This trend improves responsiveness and operational agility.
Another trend is increased integration with explainable AI and model transparency frameworks. Banks require clear explanations for risk alerts and customer segment recommendations. Graph analytics supports interpretability by visually mapping relationships and highlighting specific connection paths that contribute to insights. This trend aligns with regulatory expectations for transparent AI use.
Growth Factors Analysis
One of the key growth factors for the graph analytics in banking market is rising investment in advanced risk and compliance programs. Regulatory enforcement around AML, fraud reporting, and KYC/CDD obligations has increased. Graph analytics plays a strategic role in improving risk coverage and audit documentation, driving adoption.
Another growth factor is the expansion of digital banking services and channels. Online, mobile, and API driven interactions generate complex behavioural and networked data. Understanding connections across channels and products supports unified customer views and informed decision making. Graph analytics enables this multi-dimensional insight, reinforcing its market relevance.
Opportunity Analysis
A significant opportunity in the graph analytics in banking market lies in enhanced regulatory compliance and risk reporting. Regulators increasingly expect banks to demonstrate robust surveillance of suspicious patterns and rapid identification of networked risk. Graph analytics improves AML, fraud detection, and sanctions screening by revealing complex entity connections. This capability supports regulatory audit readiness and improves oversight.
Another opportunity is the integration of graph analytics with machine learning and predictive modelling. Combining graph-based feature extraction with predictive algorithms improves accuracy of risk and churn models. Graph features such as centrality, connectivity, and cluster patterns enrich model inputs and support deeper analytics. This convergence expands use cases beyond detection into forecasting and segmentation.
Challenge Analysis
A major challenge for the graph analytics in banking market is ensuring data quality and consistency across sources. Graph analytics depends on accurate and complete entity resolution—linking records from disparate systems into unified nodes. Poor quality data can create incorrect relationships or mask significant connections. Strong data governance and cleansing are essential for reliable insight.
Another challenge is scaling performance for large enterprise graphs. Banking environments generate massive volumes of transactional and customer data. Processing high-volume graph queries in near real-time requires robust computational resources and optimised graph engines. Performance tuning and infrastructure design remain critical challenges.
Customer Impact: Trends and Disruptors
Customers leveraging graph analytics in banking see faster detection of fraud and financial crime, resulting in improved trust and reduced loss exposure. Real-time pattern detection helps banks react quickly to suspicious behaviour, which enhances overall security.
Customers also benefit from more personalised services as banks use relationship-driven insights to tailor offers and services. A major disruptor is the convergence of graph analytics with open banking data; this expands visibility into cross-institution relationships and increases analytical depth but requires harmonisation of external data sources.
Competitive Analysis
Specialized graph database vendors such as Neo4j, Inc. and TigerGraph, Inc. lead the graph analytics in banking market. Their platforms enable relationship mapping across accounts, transactions, and entities. These capabilities support fraud detection, anti money laundering, and risk modeling. DataStax, Inc. and Objectivity, Ltd. strengthen scalable graph processing. Demand is driven by the need to analyze complex financial networks in real time.
Cloud and enterprise technology providers such as Microsoft Corporation, Amazon Web Services, Inc., IBM Corporation, and Oracle Corporation integrate graph analytics into broader data ecosystems. SAS Institute, Inc. and Teradata Corporation enhance advanced modeling and compliance workflows. These players benefit from strong banking relationships and hybrid cloud deployments.
Visualization and analytics specialists such as Linkurious SAS, Cambridge Intelligence, Ltd., Tom Sawyer Software, Lynx Analytics, Ltd., and Expero, Inc. support investigative and intelligence use cases. Their tools improve decision clarity for compliance and fraud teams. Other vendors enhance innovation and regional adoption, supporting steady expansion of graph analytics in banking.
Top Key Players in the Market
- Neo4j, Inc.
- TigerGraph, Inc.
- Microsoft Corporation
- Amazon Web Services, Inc.
- IBM Corporation
- Oracle Corporation
- SAS Institute, Inc.
- Teradata Corporation
- DataStax, Inc.
- Linkurious SAS
- Cambridge Intelligence, Ltd.
- Tom Sawyer Software
- Lynx Analytics, Ltd.
- Expero, Inc.
- Objectivity, Ltd.
- Others
Future Outlook
The future outlook for the Graph Analytics in Banking Market is positive as banks increasingly use advanced data tools to uncover relationships and patterns in complex data. Demand for graph analytics solutions is expected to grow because these tools help detect fraud, improve customer insights, and enhance network analysis.
Adoption of machine learning and real-time processing capabilities will support more effective risk management and personalized services. Growth can be attributed to rising volumes of data, stronger focus on security, and the need for improved decision making. Overall, the market is anticipated to expand as financial institutions seek deeper analytical capabilities.
Recent Developments
- October, 2025 – Neo4j showcased GraphRAG with GenAI for financial fraud detection, helping over 150 institutions including BNP Paribas cut fraudulent transactions by 20% by exposing hidden rings, circular payments and synthetic identities via vector embeddings and hybrid search.
- October, 2025 – TigerGraph powered an online banking fraud detection system with Google Vertex AI, using multi-hop graph queries on users, cards, IPs and merchants to uncover fraud rings and assign millisecond risk scores with sub-second responses on large datasets.
Report Scope
Report Features Description Market Value (2025) USD 652.4 Milion Forecast Revenue (2035) USD 3,592.2 Million CAGR(2025-2035) 18.60% Base Year for Estimation 2024 Historic Period 2020-2024 Forecast Period 2025-2035 Report Coverage Revenue forecast, AI impact on Market trends, Share Insights, Company ranking, competitive landscape, Recent Developments, Market Dynamics and Emerging Trends Segments Covered By Component (Software/Platforms, Services), By Deployment Mode (Cloud-based, On-premises), By Organization Size (Large Enterprises, Small and Medium-sized Enterprises (SMEs)), By Application (Fraud Detection & Financial Crime, Customer 360 & Relationship Analysis, Others), By End-User (Retail Banks, Investment Banks ) Regional Analysis North America – US, Canada; Europe – Germany, France, The UK, Spain, Italy, Russia, Netherlands, Rest of Europe; Asia Pacific – China, Japan, South Korea, India, New Zealand, Singapore, Thailand, Vietnam, Rest of Latin America; Latin America – Brazil, Mexico, Rest of Latin America; Middle East & Africa – South Africa, Saudi Arabia, UAE, Rest of MEA Competitive Landscape Neo4j, Inc., TigerGraph, Inc., Microsoft Corporation, Amazon Web Services, Inc., IBM Corporation, Oracle Corporation, SAS Institute, Inc., Teradata Corporation, DataStax, Inc., Linkurious SAS, Cambridge Intelligence, Ltd., Tom Sawyer Software, Lynx Analytics, Ltd., Expero, Inc., Objectivity, Ltd., Others Customization Scope Customization for segments, region/country-level will be provided. Moreover, additional customization can be done based on the requirements. Purchase Options We have three license to opt for: Single User License, Multi-User License (Up to 5 Users), Corporate Use License (Unlimited User and Printable PDF)  Graph Analytics In Banking MarketPublished date: Feb. 2026add_shopping_cartBuy Now get_appDownload Sample
 -
-
- Neo4j, Inc.
- TigerGraph, Inc.
- Microsoft Corporation
- Amazon Web Services, Inc.
- IBM Corporation
- Oracle Corporation
- SAS Institute, Inc.
- Teradata Corporation
- DataStax, Inc.
- Linkurious SAS
- Cambridge Intelligence, Ltd.
- Tom Sawyer Software
- Lynx Analytics, Ltd.
- Expero, Inc.
- Objectivity, Ltd.
- Others
Our Clients
- 176883
- Feb. 2026


