
Quick Navigation
Report Overview
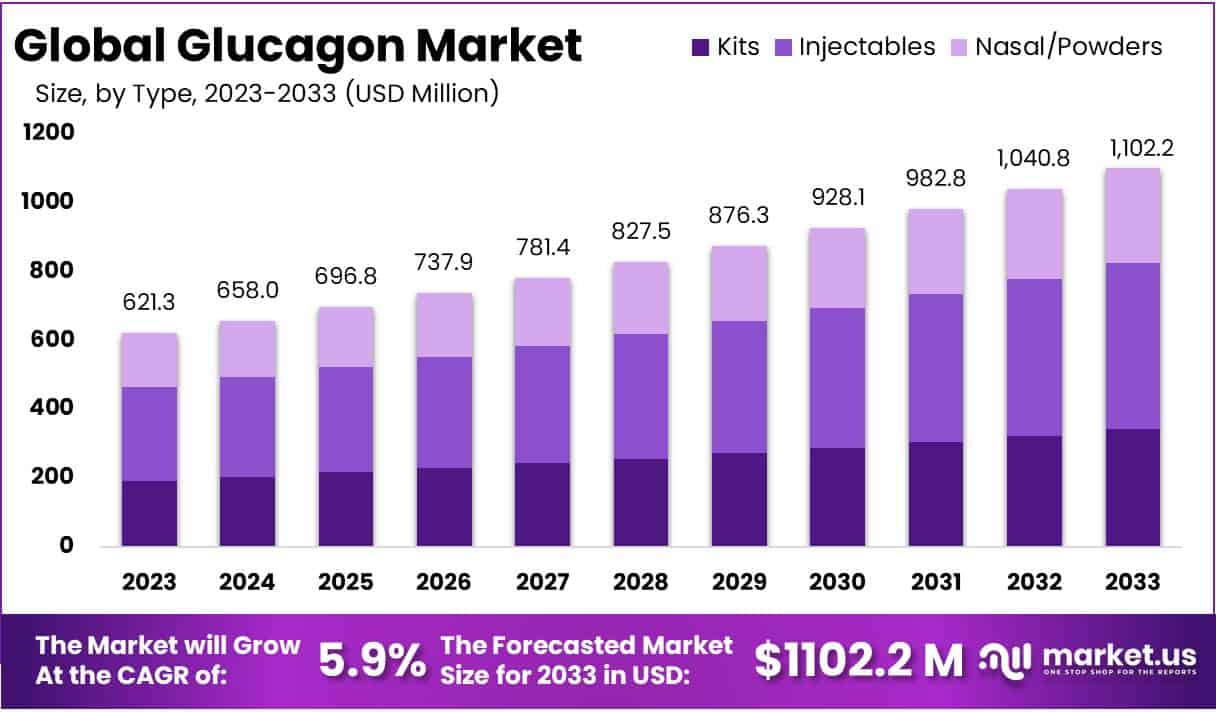
The Global Glucagon Market size is expected to be worth around USD 1102.2 Million by 2033, from USD 621.3 Million in 2023, growing at a CAGR of 5.9% during the forecast period from 2024 to 2033.
The global demand for glucagon is primarily driven by the increasing prevalence of diabetes, particularly in regions like North America and Asia-Pacific. The World Health Organization reports that diabetes rates have nearly doubled worldwide since 1980, which directly influences the need for effective hypoglycemia management solutions such as glucagon. This medication is crucial for treating severe hypoglycemia in diabetic patients, and its demand aligns with the growth of the healthcare industry.
In the United States, glucagon is regulated by the Food and Drug Administration (FDA), which enforces strict guidelines to ensure the safety and efficacy of glucagon emergency kits. These regulations are vital for market entry and maintaining high confidence levels in product effectiveness. Similarly, in Europe, the European Medicines Agency (EMA) imposes rigorous standards for manufacturing and distribution, shaping the operational activities of companies within the glucagon market. These stringent regulations ensure that only high-quality products are available to patients, thereby sustaining market stability and patient trust.
The import and export dynamics of glucagon are influenced by the pharmaceutical capabilities of various countries. Major pharmaceutical markets like the United States, Germany, and Switzerland are key exporters, while emerging markets often rely on imports to meet their healthcare needs. Trade regulations and tariffs also play a significant role in the accessibility and pricing of glucagon internationally, potentially increasing costs by up to 15% and affecting the availability of this essential medication.
Government initiatives aimed at improving emergency healthcare services also impact the glucagon market. These initiatives often focus on advancing diabetes care and enhancing the preparedness of medical personnel to manage diabetic emergencies effectively. Studies indicate that training programs for first responders have significantly improved the management of diabetic emergencies, increasing the demand for glucagon. Market research suggests that such governmental efforts are not only bolstering healthcare infrastructure but are also promoting a robust growth in the market for essential medications like glucagon.
Key Takeaways
- Global Glucagon Market anticipates a substantial increase from USD 621.3 Million in 2023 to approximately USD 1102.2 Million by 2033, reflecting a CAGR of 5.9%.
- Injectable glucagon leads with 43.9% market share in 2023, favored for emergency hypoglycemia treatment due to swift action.
- Therapeutic use segment holds over 57.3% market share, driven by widespread use in severe hypoglycemia emergencies.
- Advancements in delivery methods, like nasal sprays, offer opportunities for increased patient compliance.
- Strategic alliances and R&D investments drive innovation in glucagon formulations and applications.
- North America dominates with 34.5% market share in 2023, backed by robust healthcare infrastructure.
Product Type Analysis
In 2023, the Injectable Glucagon segment occupied a dominant position in the Glucagon Market’s Product Type Segment, securing over 43.9% of the market share. The preference for this segment is largely due to its user-friendly administration and swift action in treating emergency hypoglycemia, which is critical in diabetes management, especially during severe episodes.
The effectiveness of injectable glucagon in rapidly elevating blood glucose levels has established it as an essential component in emergency medical kits. Enhancements in the product’s formulation have improved patient adherence and ease of use. Innovations such as pre-filled syringes and auto-injectors have simplified the delivery process, making it less daunting for users unfamiliar with traditional syringe use. These advancements have broadened the user base to include not just patients but also caregivers and emergency personnel who need quick, dependable solutions.
Despite facing competition from newer forms like nasal and powder glucagon, which offer non-invasive administration, the injectable segment continues to lead due to its proven efficacy. The market for injectable glucagon is expected to grow, driven by an increasing global prevalence of diabetes and heightened awareness of the critical nature of managing hypoglycemia effectively.
Healthcare professionals emphasize the importance of rapid and effective treatment for hypoglycemia, ensuring continued demand for injectable glucagon. With ongoing technological advancements in injection devices, the segment is poised to maintain a substantial market share in the coming years, supported by strong demand and innovation.
Application Analysis
In 2023, the Therapeutic Use segment held a dominant market position in the Application Segment of the Glucagon Market, capturing more than a 57.3% share. This substantial market share can be attributed to the widespread use of glucagon in emergency treatments for severe hypoglycemia, predominantly in diabetic patients. The increasing prevalence of diabetes globally, coupled with growing awareness and the availability of glucagon emergency kits, has significantly driven the demand within this segment.
On the other hand, the Diagnostic Use segment also contributes notably to the market, albeit to a lesser extent. Glucagon is employed in diagnostic procedures to assess pancreatic function and diagnose issues related to the gastrointestinal tract. The segment’s growth is facilitated by advancements in diagnostic technologies and methodologies, which have enhanced the precision and efficacy of glucagon-based tests.
Looking ahead, the market is anticipated to see continued growth in the Therapeutic Use segment, propelled by ongoing research and development efforts aimed at enhancing glucagon formulations and delivery systems. Innovations such as nasal spray formulations of glucagon are emerging as pivotal developments, offering easier administration and better patient compliance compared to traditional injectable forms.
Furthermore, the Diagnostic Use segment is expected to expand as well, driven by increasing investments in healthcare infrastructure and the rising demand for more sophisticated diagnostic procedures in emerging markets. This expansion reflects a broader trend towards precision medicine, where glucagon’s role in diagnostic assessments is becoming increasingly vital.

Key Market Segments
Product Type
- Kits
- Injectable
- Nasal/Powder
Application
- Therapeutic Use
- Diagnostic Use
Drivers
Increasing Incidence of Diabetes
The increasing incidence of diabetes is a significant driver for the growth of the glucagon market. The International Diabetes Federation (IDF) reports that in 2021, approximately 537 million adults worldwide were living with diabetes, and this number is projected to rise to 643 million by 2030 and 783 million by 2045. This escalating prevalence, especially of type 2 diabetes, which accounts for over 90% of cases, is linked to factors such as urbanization, aging populations, and rising obesity rates.
These trends highlight a growing demand for diabetes management and emergency medications, including glucagon, which is crucial for treating severe hypoglycemic episodes in diabetic patients. The market expansion for glucagon is thus directly correlated with the rising global diabetes burden, emphasizing the need for effective diabetes management solutions across healthcare systems. This scenario underscores the urgent necessity for interventions that can mitigate the diabetes epidemic’s impact, thereby driving sustained demand for glucagon as an essential treatment option.
Restraints
High Cost of Glucagon Kits
The high cost of glucagon kits represents a significant constraint in the glucagon market, particularly impacting patients in lower-income regions. Over the decade from 2010 to 2020, the wholesale acquisition cost of glucagon kits increased dramatically by 192%, with costs escalating from around $100 per kit to nearly $300. Despite this increase, median out-of-pocket costs for patients have fluctuated slightly, often determined by insurance coverage and ranging from $25 to $40 for those in the highest 75th percentile of out-of-pocket expenses.
Moreover, patients currently owning glucagon kits report an average out-of-pocket cost of $73.40, with costs varying widely up to $400. This variability in cost and the significant expenditure involved can deter consistent access to glucagon, especially crucial for emergency treatment of severe hypoglycemia in diabetic patients. Such financial barriers not only affect direct patient care but also contribute to wider market limitations, reducing the overall accessibility and usage of glucagon kits.
Opportunities
Advancements in Glucagon Delivery Methods
Advancements in glucagon delivery methods, notably nasal sprays and pre-filled syringes, are creating significant opportunities in the glucagon market. These innovative approaches enhance the ease and speed of administration, vital in emergency hypoglycemia treatments, thus potentially increasing patient compliance and expanding the market to broader segments. For instance, the introduction of nasal glucagon provides a user-friendly option that simplifies administration, appealing especially to patients with needle phobia, thereby expanding its user base and market penetration.
Trends
Strategic Alliances and R&D Investments
In the glucagon market, strategic alliances and investments in research and development (R&D) are emerging as pivotal trends. Strategic alliances, which involve collaborations between organizations to achieve mutual goals, have nearly doubled in the past decade and are seen as crucial for market expansion and gaining competitive advantages. These alliances typically focus on sharing technology, accessing new markets, and reducing financial and political risks.
Regarding R&D investments, they are increasingly directed towards developing new formulations and applications of glucagon, particularly for severe hypoglycemia. The emphasis is on enhancing the efficacy and safety profiles of glucagon therapies, which remain crucial for treating hypoglycemia. Companies are not only modernizing their approaches but are also collaborating to pool their technological and scientific resources to accelerate innovation and market readiness.
Regional Analysis
In 2023, North America dominated the Glucagon market, securing over a 34.5% share and boasting a market value of USD 214.3 Million for the year. This significant foothold can be attributed to various factors, including the region’s well-established healthcare infrastructure, high incidence of diabetes, and heightened awareness regarding the critical need for emergency hypoglycemia treatment.
The region benefits from extensive research and development endeavors, leading to the introduction of innovative glucagon products and delivery methods. Additionally, favorable regulatory frameworks and reimbursement policies contribute to the widespread adoption of glucagon therapies across North America.
Looking ahead, North America is expected to uphold its leading position in the Glucagon market, fueled by ongoing advancements in medical technology, increased healthcare investments, and collaborative efforts between pharmaceutical firms and research institutions.
In contrast, regions such as Europe, Asia Pacific, and Latin America are witnessing steady growth in the Glucagon market, albeit at a slower pace compared to North America. These areas exhibit rising diabetic populations, improving healthcare infrastructures, and escalating healthcare expenditures, all driving demand for glucagon products.
Europe, for example, is experiencing a gradual uptake of glucagon therapies, supported by initiatives focused on diabetes management and heightened awareness among healthcare providers and patients. Similarly, the Asia Pacific region is witnessing accelerated growth in the Glucagon market due to increasing diabetes prevalence, better healthcare accessibility, and rising incomes.
Latin America also presents promising market expansion opportunities, driven by investments in healthcare infrastructure, growing healthcare spending, and initiatives to enhance diabetes management programs. Nevertheless, economic uncertainties and regulatory challenges may hinder growth to some extent.

Key Regions
- North America
- The US
- Canada
- Mexico
- Western Europe
- Germany
- France
- The UK
- Spain
- Italy
- Portugal
- Ireland
- Austria
- Switzerland
- Benelux
- Nordic
- Rest of Western Europe
- Eastern Europe
- Russia
- Poland
- The Czech Republic
- Greece
- Rest of Eastern Europe
- APAC
- China
- Japan
- South Korea
- India
- Australia & New Zealand
- Indonesia
- Malaysia
- Philippines
- Singapore
- Thailand
- Vietnam
- Rest of APAC
- Latin America
- Brazil
- Colombia
- Chile
- Argentina
- Costa Rica
- Rest of Latin America
- Middle East & Africa
- Algeria
- Egypt
- Israel
- Kuwait
- Nigeria
- Saudi Arabia
- South Africa
- Turkey
- United Arab Emirates
- Rest of MEA
Key Players Analysis
In the dynamic landscape of the Glucagon market, several influential players play pivotal roles, each contributing uniquely to its growth and development. One such major player is Fresenius Kabi, known for its expertise in pharmaceuticals and commitment to delivering high-quality glucagon products. Similarly, Eli Lilly and Company, a renowned pharmaceutical giant, utilizes its extensive research and development capabilities to continuously enhance existing products and introduce innovative solutions in the glucagon market. Xeris Pharmaceuticals Inc distinguishes itself with its focus on patient-centric formulations and convenient delivery methods, earning recognition as a significant contributor to market advancements.
Novo Nordisk A/S, a global leader in diabetes care, leverages its expertise to drive innovation and improve treatment options in the glucagon market. Additionally, companies like Avalon Pharma Pvt. Ltd, among other key players, bring diversity and unique perspectives, collectively shaping the market’s landscape. Together, these players form the backbone of the glucagon market, ensuring continued growth, accessibility, and innovation for the benefit of patients and healthcare providers alike.
Market Key Players
- Fresenius Kabi
- Eli Lilly and Company
- Xeris Pharmaceuticals Inc
- Novo Nordisk A/S
- Avalon Pharma Pvt. Ltd
- Other Key Players
Recent Developments
- In June 2023: Eli Lilly disclosed phase 2 findings for orforglipron, its inaugural nonpeptide oral glucagon-like peptide-1 (GLP-1) receptor agonist under investigation for chronic weight management in subjects dealing with obesity or overweight.
- In March 2022: marked the launch of Gvoke® Kit by Xeris Pharmaceuticals Inc, heralding the arrival of the inaugural ready-to-use liquid glucagon enclosed within a single-dose vial and syringe kit, tailored for emergency use.
- In September 2022: Novo Nordisk entered a collaborative agreement with Zealand Pharma and secured an in-licensing deal for Zegalogue’s development and commercialization, a next-generation glucagon designated for treating severe hypoglycemia.
Report Scope
| Report Features | Description |
|---|---|
| Market Value (2023) | USD 621.3 Mn |
| Forecast Revenue (2033) | USD 1102.2 Mn |
| CAGR (2024-2033) | 5.9% |
| Base Year for Estimation | 2023 |
| Historic Period | 2018-2022 |
| Forecast Period | 2024-2033 |
| Report Coverage | Revenue Forecast, Market Dynamics, COVID-19 Impact, Competitive Landscape, Recent Developments |
| Segments Covered | By Product Type (Kits, Injectable, Nasal/Powder), By Application (Therapeutic Use, Diagnostic Use) |
| Regional Analysis | North America – The US, Canada, & Mexico; Western Europe – Germany, France, The UK, Spain, Italy, Portugal, Ireland, Austria, Switzerland, Benelux, Nordic, & Rest of Western Europe; Eastern Europe – Russia, Poland, The Czech Republic, Greece, & Rest of Eastern Europe; APAC – China, Japan, South Korea, India, Australia & New Zealand, Indonesia, Malaysia, Philippines, Singapore, Thailand, Vietnam, & Rest of APAC; Latin America – Brazil, Colombia, Chile, Argentina, Costa Rica, & Rest of Latin America; Middle East & Africa – Algeria, Egypt, Israel, Kuwait, Nigeria, Saudi Arabia, South Africa, Turkey, United Arab Emirates, & Rest of MEA |
| Competitive Landscape | horizontal_comapnies |
| Customization Scope | Customization for segments, region/country-level will be provided. Moreover, additional customization can be done based on the requirements. |
| Purchase Options | We have three licenses to opt for: Single User License, Multi-User License (Up to 5 Users), Corporate Use License (Unlimited User and Printable PDF) |


