


Report Overview
Global Recreational Boating Market size is expected to be worth around USD 60.30 Billion by 2035 from USD 28.30 Billion in 2025, growing at a CAGR of 7.9% during the forecast period 2026 to 2035. This trajectory nearly doubles market value across ten years. Vendors who scale production capacity now will hold pricing power as demand outpaces supply.
The recreational boating market covers vessels built for leisure, sport, and personal water travel rather than commercial freight. This structure spans motorboats, personal watercraft, sailboats, yachts, pontoon boats, and inflatable boats across many propulsion types. Buyers range from private owners to rental fleets, so manufacturers must serve both purchase and service revenue streams to defend margins.
Key Takeaways
- Global market value reaches USD 60.30 Billion by 2035 from USD 28.30 Billion in 2025 at a CAGR of 7.9%.
- Motorboats lead the boat type segment with a 44.80% share.
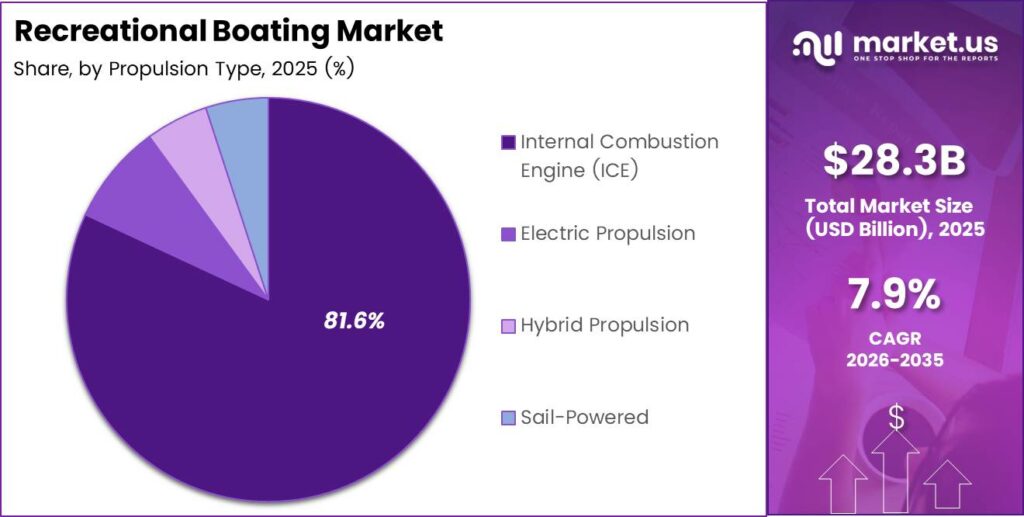
- Internal Combustion Engine propulsion holds a 81.60% share.
- Leisure and Cruising leads applications with a 51.40% share.
- Fiberglass dominates material type at a 63.20% share.
- Individual Owners lead end users with a 68.50% share.
- Dealer Network leads distribution with a 58.90% share.
- Below 100 Hp leads engine power with a 37.60% share.
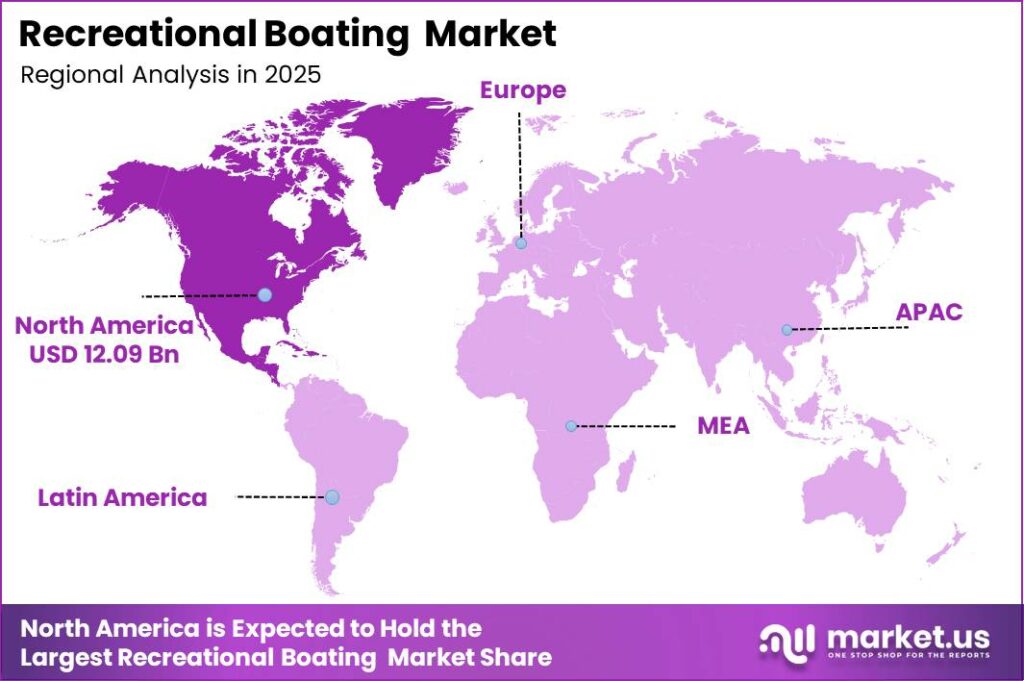
- North America dominates regionally with a 42.70% share, valued at USD 12.09 Billion.
Government agencies track fleet size and safety to guide waterway policy and marina permitting. As reported by NMMA, there were 11.6 Million registered or documented boats in the United States in 2023. This large installed base sustains aftermarket demand for parts, service, and upgrades. Suppliers who lock in dealer service contracts now will capture recurring revenue well beyond the initial sale.
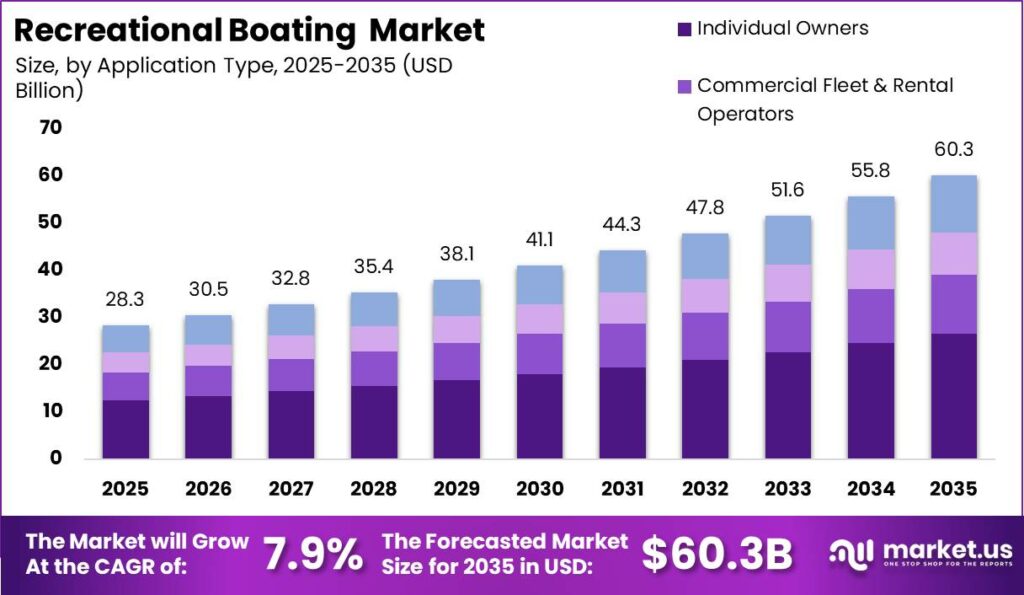
Economic weight strengthens the case for public investment in access infrastructure. Figures from NMMA show recreational boating generates an estimated USD 121.5 Billion in annual U.S. economic impact through direct, indirect, and induced spending. This scale attracts policymaker support for marina and waterway expansion. Consequently, manufacturers gain a longer runway as new access points convert latent interest into first boat purchases. In March 2026, Malibu Boats acquired Saxdor Yachts, expanding its global manufacturing footprint and adventure boat portfolio.
Boat Type Analysis
Motorboats dominate with 44.80% due to versatile powered leisure use.
In 2025, Motorboats held a dominant market position in the By Boat Type segment of Recreational Boating Market, with a 44.80% share. Data from NMMA shows powerboats make up around 62% of all registered recreational boats in the United States. This scale reflects broad buyer preference for engine-driven versatility. Manufacturers who standardize powertrain platforms across models will cut costs and defend this leading position.
Personal Watercraft serve buyers who want compact, high-thrill vessels for short outings and easy towing. As reported by U.S. Coast Guard, open motorboats accounted for 45% of all recreational boating accidents in 2023. This safety profile pushes makers to add stability and control features. Brands that lead on safety design will win risk-conscious first-time buyers entering the fastest growing sub-segment.
Sailboats attract owners seeking low fuel cost and skill-based recreation over speed. Figures from NMMA show the three most popular boating activities are cruising, fishing, and watersports. This activity mix favors vessels built for relaxed multi-hour outings. Sailboat makers who target cruising buyers directly will hold share against powered alternatives. In September 2025, Groupe Beneteau unveiled 19 new models at the Cannes Yachting Festival.
Yachts serve affluent buyers who value comfort, range, and status on the water. Pontoon Boats appeal to families through wide, stable decks suited for inland lakes. Inflatable Boats hold the remaining share collectively, serving buyers who need portable, low-storage vessels. Vendors covering all three niches gain resilience when any single premium or entry segment softens during rate cycles.
Propulsion Type Analysis
Internal Combustion Engine dominates with 81.60% due to established fueling and service networks.
In 2025, Internal Combustion Engine held a dominant market position in the By Propulsion Type segment of Recreational Boating Market, with a 81.60% share. Based on U.S. Coast Guard data, the national fleet exceeded 11.8 Million registered vessels in 2024, most running combustion engines. This installed base secures long-term parts and fuel demand. Engine makers who protect service networks now will slow the electric transition on their own terms.
Electric Propulsion attracts buyers on emission-controlled inland lakes and regulated marina zones. As reported by U.S. Coast Guard, operator inattention caused 586 accidents in 2023, driving demand for smart control systems that pair naturally with electric drivetrains. Makers who bundle electric power with digital helm features will capture the fastest growing propulsion buyers first.
Hybrid Propulsion serves owners who want emission gains without full range anxiety on longer trips. Sail-Powered vessels hold the remaining share collectively, appealing to cost-conscious and skill-focused buyers. Manufacturers who offer hybrid options across existing hulls will bridge combustion buyers toward cleaner propulsion without forcing an abrupt switch.
Application Analysis
Leisure and Cruising dominates with 51.40% due to broad recreational and family appeal.
In 2025, Leisure and Cruising held a dominant market position in the By Application segment of Recreational Boating Market, with a 51.40% share. Figures from NMMA show cruising ranks among the three most popular U.S. boating activities. This preference anchors demand for comfort-focused vessels. Builders who prioritize deck space and onboard amenities will hold this leading application share.
Watersports and Adventure Activities draw younger buyers seeking wakeboarding, tubing, and high-energy outings. As per our research, recreational boating participation reached 75 Million U.S. adults in a prior peak year, a base that fuels adventure demand growth. Makers who design wake-optimized hulls will lead the fastest growing application segment.
Fishing serves anglers who need stable platforms, rod storage, and shallow-water access. Marine Tourism and Charter supports operators renting vessels to visitors in coastal destinations. Racing holds the remaining share collectively, serving performance enthusiasts. Vendors who tailor purpose-built fishing and charter models will capture buyers underserved by general cruising boats.
Material Type Analysis
Fiberglass dominates with 63.20% due to durable low-maintenance hull performance.
In 2025, Fiberglass held a dominant market position in the By Material Type segment of Recreational Boating Market, with a 63.20% share. As per our research, the U.S. fleet included an estimated 17 Million boats in use, many with fiberglass hulls. This scale supports a mature repair and molding supply chain. Builders who secure resin supply contracts will protect margins against material cost swings.
Composite Materials such as carbon fiber attract buyers who value light weight and fuel efficiency. As per our research, alcohol was the leading factor in 79 fatal boating deaths in 2023, pushing demand for lighter, more responsive vessels that improve handling. Makers who master advanced composites will lead the fastest growing material segment.
Aluminum serves budget buyers who need rugged, corrosion-resistant hulls for fishing and utility. Steel and Wood hold the remaining share collectively, serving specialized and heritage buyers. Manufacturers who keep aluminum lines running will retain price-sensitive first-time owners entering the market.
End User Analysis
Individual Owners dominate with 68.50% due to strong private leisure ownership demand.
In 2025, Individual Owners held a dominant market position in the By End User segment of Recreational Boating Market, with a 68.50% share. Based on U.S. Coast Guard data, 3,844 recreational boating accidents in 2023 involved mostly privately owned vessels. This concentration keeps consumer demand central to sales. Brands that simplify ownership through service bundles will deepen loyalty among private buyers.
Commercial Fleet and Rental Operators buy vessels to monetize through per-use and subscription access. As per our research, around 62% of registered boats are powerboats, the category rental fleets favor for high turnover. Makers who offer fleet-grade durability packages will capture the fastest growing end-user segment.
Yacht Clubs and Marinas purchase vessels for member programs and dockside services. Tourism Operators hold the remaining share collectively, buying boats for charter and sightseeing. Vendors who target institutional buyers with volume pricing will diversify revenue beyond individual consumers.
Distribution Channel Analysis
Dealer Network dominates with 58.90% due to trusted local sales and service.
In 2025, Dealer Network held a dominant market position in the By Distribution Channel segment of Recreational Boating Market, with a 58.90% share. As per our research, the U.S. fleet of 11.6 Million registered boats depends on dealers for service and trade-ins. This reliance keeps dealers central to the buying journey. Makers who invest in dealer training will protect this leading channel.
Online Sales Platforms attract buyers who research and configure boats digitally before purchase. As per our research, boating supports an estimated 964,000 American jobs, many tied to expanding digital retail roles. Brands that build strong online configurators will lead the fastest growing channel.
Direct Sales let manufacturers reach buyers without dealer markup on premium models. Boat Shows and Exhibitions hold the remaining share collectively, driving concentrated seasonal demand. Vendors who blend direct and event selling will capture buyers who bypass traditional dealers.
Engine Power Analysis
Below 100 Hp dominates with 37.60% due to affordable entry-level boating access.
In 2025, Below 100 Hp held a dominant market position in the By Engine Power segment of Recreational Boating Market, with a 37.60% share. As per our research, 95% of U.S. boat owners report household incomes below USD 100,000, favoring low-power affordable engines. This income profile anchors entry-tier demand. Makers who keep small engines competitively priced will hold this leading power segment.
The 100 to 300 Hp range serves buyers upgrading toward larger cruising and watersports boats. As per our research, first-time owners often upgrade within 5 to 7 years, feeding demand for mid-power engines. Makers who target this upgrade path will lead the fastest growing power segment.
The 300 to 500 Hp range powers larger performance and offshore vessels for experienced owners. Above 500 Hp holds the remaining share collectively, serving high-performance and luxury buyers. Vendors who supply high-output engines will capture premium buyers seeking speed and range.
Key Market Segments
By Boat Type
- Motorboats
- Personal Watercraft (PWC)
- Sailboats
- Yachts
- Pontoon Boats
- Inflatable Boats
By Propulsion Type
- Internal Combustion Engine (ICE)
- Electric Propulsion
- Hybrid Propulsion
- Sail-Powered
By Application
- Leisure and Cruising
- Watersports and Adventure Activities
- Fishing
- Marine Tourism and Charter
- Racing
By Material Type
- Fiberglass
- Composite Materials (Carbon Fiber and Advanced Composites)
- Aluminum
- Steel
- Wood
By End User
- Individual Owners
- Commercial Fleet and Rental Operators
- Yacht Clubs and Marinas
- Tourism Operators
By Distribution Channel
- Dealer Network
- Online Sales Platforms
- Direct Sales
- Boat Shows and Exhibitions
By Engine Power
- Below 100 Hp
- 100 to 300 Hp
- 300 to 500 Hp
- Above 500 Hp
Regional Analysis
North America Dominates the Recreational Boating Market with a Market Share of 42.70%, Valued at USD 12.09 Billion
North America leads the recreational boating market with a 42.70% share, valued at USD 12.09 Billion. As per our research, the region carries a large registered fleet and deep dealer networks that sustain both sales and aftermarket demand. This maturity gives regional makers a stable base for upgrade cycles. Vendors who deepen service coverage here will defend share against new entrants.
Asia Pacific ranks as the fastest growing region as rising incomes push first-time boat ownership. As per our research, new coastal and inland access points expand the addressable buyer base across the region. This growth rewards early market entry before dealer networks mature. In March 2025, Yamaha Motor launched its next-generation HARMO electric boat control system for the Japanese market to improve maneuverability. Makers who build local partnerships now will secure lasting position.
Key Regions and Countries
North America
- US
- Canada
Europe
- Germany
- France
- The UK
- Spain
- Italy
- Rest of Europe
Asia Pacific
- China
- Japan
- South Korea
- India
- Australia
- Rest of APAC
Latin America
- Brazil
- Mexico
- Rest of Latin America
Middle East and Africa
- GCC
- South Africa
- Rest of MEA
Market Dynamics
Market Opportunity Analysis - Underserved end users, emerging regions, and low-power entry buyers open clear entry points for new players
Commercial Fleet and Rental Operators remain underexploited within the End User segment, where Individual Owners hold 68.50%. This concentration leaves fleet demand fragmented and open to purpose-built vessels. New entrants who design durable, high-turnover boats for rental use will capture a segment that incumbents treat as secondary. Consequently, first movers gain pricing power before larger brands pivot toward fleet buyers.
Asia Pacific stands as the most underexploited region against North America’s 42.70% share worth USD 12.09 Billion. Immature dealer networks leave room for early brand building. New entrants who establish local service and financing partnerships will lock in loyalty before the region matures. This means early investment converts directly into durable regional position.
Online Sales Platforms stay underexploited within distribution, where Dealer Network holds 58.90%. Digital-first buyers increasingly research and configure boats before contact. New entrants who build strong online configurators will reach buyers who bypass traditional dealers. Therefore, digital-native sellers can win share without heavy physical footprint investment.
Below 100 Hp buyers at a 37.60% share represent an underserved value tier as premium brands chase larger engines. This entry cohort feeds future upgrade demand. New entrants who serve affordable low-power buyers well will build a pipeline of loyal customers who trade up over time. As a result, entry-tier focus becomes a long-term revenue strategy rather than a low-margin trap.
Technology and Innovation Landscape - Electric propulsion, smart control systems, and advanced composites redefine competitive edges
Hybrid and electric propulsion systems now enter recreational boats at growing pace across regulated waterways. As per our research, marina emission zone mandates push adoption in Europe and North America. Makers who develop reliable electric drivetrains early will meet regulation ahead of rivals. This creates a durable compliance advantage as clean-water zones expand.
AI-enabled navigation, digital helm systems, and onboard connectivity increasingly become standard features. As per our research, these tools directly address operator inattention, a leading accident cause. Manufacturers who integrate smart safety systems will differentiate premium models. This signals a shift where software features drive purchase decisions alongside hull design.
Advanced composite materials improve fuel efficiency and vessel performance across new builds. As per our research, buyers increasingly value lighter, faster, more efficient boats. Makers who master carbon fiber and advanced composites will lead the fastest growing material segment. Therefore, material innovation becomes a core lever for both performance and margin.
Multifunctional crossover boats that combine cruising, fishing, and watersports gain consumer preference. As per our research, this versatility matches the three most popular boating activities. Manufacturers who build flexible crossover platforms will serve multiple use cases with one hull. This creates production efficiency while widening buyer appeal.
Drivers
The COVID era permanently reset recreational boating participation above pre-2020 levels rather than reverting as leisure markets usually do. As reported by NMMA, U.S. retail sales hit about 310,000 new powerboats in 2020, a 12% yearly gain, then peaked near 320,000 units in 2021. Volumes stabilized at roughly 285,000 to 295,000 units in 2023 and 2024, a floor about 3 to 7% above the pre-pandemic average.
A first-time buyer cohort sustains this elevated floor and signals a future upgrade wave. Data from NMMA shows about 34% of boats bought between 2020 and 2022 went to first-time owners, adding an estimated 320,000 to 400,000 new boating households. These buyers show a 60 to 70% chance of upgrading within 5 to 7 years. Dealers earn 18 to 26% gross on certified pre-owned units versus 12 to 18% on new boats, extending per-household revenue by 40 to 65%.
| Driver | (~) % Impact on CAGR Forecast | Geographic Relevance | Impact Timeline |
|---|---|---|---|
| Post-Pandemic Outdoor & Water Recreation Participation Normalization at Structurally Elevated Levels | +2.4% | United States, Canada, Australia, Western Europe, Scandinavia | Short term (≤ 2 years) |
| Rising Disposable Income & Middle-Class Expansion Driving First-Time Boat Ownership in Emerging Markets | +1.9% | India, China, Brazil, Southeast Asia, GCC, Eastern Europe | Short term (≤ 2 years) |
| Electric & Hybrid Recreational Boat Adoption Accelerated by Marina Emission Zone Mandates | +1.4% | European Union (especially Netherlands, Germany, France), United States, Australia | Short term (≤ 2 years) |
| Digital Connectivity & Smart Boat Technology Driving Upgrade & Replacement Purchase Cycles | +1.0% | United States, United Kingdom, Scandinavia, Australia, Japan | Medium term (2–4 years) |
| Coastal & Inland Tourism Infrastructure Expansion Opening New Boating Access Points | +0.7% | India (NWD & PM Gati Shakti), Southeast Asia, GCC, Eastern Mediterranean | Medium term (2–4 years) |
Restraints
Central bank rate cycles feed directly into marine financing, a discretionary category acutely sensitive to monthly payment size. As reported by the U.S. Federal Reserve, the policy rate peaked at 5.25 to 5.50% in 2023, pushing marine loan APRs to 8.5 to 12.5% from 4.5 to 6.5% in 2021. This raised the monthly payment on a USD 65,000 boat by 27 to 43%, suppressing purchase conversion.
High financing costs reach most buyers because dealers finance about 70 to 75% of new boats in the USD 25,000 to USD 150,000 tier. Data from NMMA shows new powerboat sales fell from about 320,000 units in 2021 to roughly 278,000 in 2024, a 13% drop. As reported by MRAA, 58% of dealers named financing rates the top deal-killer. Rate buydowns now compress factory EBITDA margins by 150 to 280 basis points on subsidized units.
| Restraint | (~) % Impact on CAGR Forecast | Geographic Relevance | Impact Timeline |
|---|---|---|---|
| Elevated Consumer Financing Rates Suppressing Discretionary Boat Purchase Conversion | -2.1% | United States, Canada, Australia, United Kingdom, Western Europe | Short term (≤ 2 years) |
| Fuel Price Volatility Raising Total Cost of Boat Ownership & Deterring New Buyers | -1.2% | Global, most acute for outboard-motor-dependent recreational boating markets | Short term (≤ 2 years) |
| Waterway Access Restrictions & Environmental Zoning Closing Key Recreational Boating Areas | -0.8% | European Union (Netherlands, Germany, France), United States (state-level protected waters) | Medium term (2–4 years) |
| Marine Import Tariffs & Trade Policy Disruptions Elevating Boat & Component Acquisition Costs | -0.6% | United States (tariffs on aluminum, steel, engines); EU & Asia cross-border | Short term (≤ 2 years) |
| Insurance Premium Escalation for Recreational Marine Coverage Deterring First-Time Owners | -0.4% | United States, Australia, Caribbean, Mediterranean | Short term (≤ 2 years) |
Challenges
A decades-long imbalance between fleet growth and berth supply worsened after the 2020 to 2022 demand surge. As reported by U.S. Coast Guard, the registered fleet topped 11.8 Million vessels by 2024, adding 400,000 to 500,000 net new units since 2020, while U.S. berths stayed flat near 950,000 to 1,000,000 slips. New dock infrastructure costs USD 50,000 to USD 180,000 per slip, held back by coastal zoning.
Berth scarcity acts as a soft ceiling on new boat sales in constrained markets. Data from marina industry surveys shows top U.S. market occupancy reached 92 to 96% in 2024, with waitlists of 2 to 4 years in South Florida and over 7 years in the San Francisco Bay Area. This creates a clear opening. Automated dry-stack facilities store 500 to 1,500 boats per acre and earn USD 1,800 to USD 4,500 per boat yearly in fees.
| Challenge | (~) % CAGR Friction Drag | Geographic Relevance | Mitigation Horizon |
|---|---|---|---|
| Marina Berth Scarcity & Storage Infrastructure Deficit | -1.1% | United States (coastal), Western Europe, Australia, Southeast Asia | Long term (≥ 4 years) |
| Marine Technician & Skilled Service Workforce Shortage | -0.8% | United States, United Kingdom, Australia, Canada, Scandinavia | Long term (≥ 4 years) |
| Fiberglass & Composite Material Recycling & End-of-Life Disposal Complexity | -0.6% | European Union, United States, Australia — primary fiberglass hull markets | Long term (≥ 4 years) |
| Seasonal Demand Concentration Constraining Dealer Cash Flow Management | -0.4% | United States, Canada, Northern Europe — markets with strong boating seasonality | Medium term (2–4 years) |
| Outboard Engine Emission Standard Compliance Cost Escalation | -0.3% | European Union (EU Stage V), United States (EPA Tier 3), California (CARB) | Medium term (2–4 years) |
Opportunities
The market has long offered only ownership or per-day charter, leaving a gap for regular users who cannot justify full ownership. As per our research, new boats sell for USD 47,000 to USD 120,000 in the 20 to 30 foot segment, while daily charter runs USD 300 to USD 1,200. A subscription model at USD 399 to USD 799 monthly converts boating into a recurring lifestyle expense.
Subscription unit economics beat traditional sales at steady utilization. As per our research, a 20 boat fleet worth USD 1.1 Million can support 120 to 180 subscribers at USD 549 monthly, yielding 55 to 72% gross margins versus 20 to 35% on one-time sales. This white space stays open because operators must build multi-hub fleets across 15 to 25 metro markets. First movers who standardize fleets during the 2026 to 2029 window will lock in platform advantage.
| Opportunity | (~) % Potential CAGR Upside | Geographic Relevance | Execution Window |
|---|---|---|---|
| Boat-as-a-Service & Subscription Membership Model Unlocking Non-Owner Boating Participation | +1.8% | United States, United Kingdom, Australia, Western Europe, Urban India | Medium term (2–4 years) |
| India Inland Waterway & Coastal Recreational Boating Market Development as Greenfield Category | +1.3% | India — Goa, Kerala, Andaman & Nicobar, Maharashtra, Gujarat coastlines & NW1/NW3 waterways | Medium term (2–4 years) |
| Peer-to-Peer Boat Rental Platform Growth Monetizing Existing Underutilized Registered Fleet | +0.9% | United States, France, Italy, Australia, United Kingdom, Spain | Short term (≤ 2 years) |
| Autonomous & AI-Assisted Navigation System Integration as a Premium Aftermarket & OEM Upgrade Category | +0.6% | United States, Europe, Japan, Australia, South Korea | Long term (≥ 4 years) |
| Women & Underrepresented Demographic Boating Access Programs Expanding Addressable Participation Base | +0.3% | United States, United Kingdom, Australia, Canada | Medium term (2–4 years) |
Key Company Insights
Brunswick Corporation anchors its position through a wide brand portfolio and Mercury Marine propulsion leadership across recreational segments. As per our research, around 62% of registered boats are powerboats, the core category Brunswick serves through engines and hulls. This vertical integration lets Brunswick capture value at both boat and powertrain levels. However, heavy combustion exposure creates transition risk as electric propulsion adoption accelerates in regulated zones.
Yamaha Motor Co., Ltd. builds strength through engine engineering and steady acquisitions that widen its marine footprint. As per our research, 95% of U.S. owners earn below USD 100,000, matching Yamaha’s affordable, reliable engine focus. In April 2025, Yamaha completed the acquisition of Australian builder Telwater to strengthen its dealer network. This move expands regional reach, though tight cost control remains essential to serve price-sensitive buyers.
Key Players
- Brunswick Corporation
- Yamaha Motor Co., Ltd.
- Groupe Beneteau
- Malibu Boats, Inc.
- Mastercraft Boat Holdings, Inc.
- Correct Craft
- Marine Products Corporation
- Polaris Inc.
- Bombardier Recreational Products Inc.
- Azimut Benetti Group
- Ferretti S.P.A.
- Sunseeker International
- Princess Yachts Limited
- Hanseyachts Ag
- Bavaria Yachtbau Gmbh
Recent Developments
- January 2025: Saxdor Yachts introduced the Saxdor 340 GTWA and showcased the Fathom e-power system at boot Düsseldorf 2025, becoming the first non-U.S. boatbuilder to integrate the technology with Mercury Marine propulsion.
- May 2025: Brunswick Corporation received six Boating Industry 2025 Top Product Awards, recognizing innovations across its recreational boating brands and marine technologies.
- December 2025: Mercury Marine, a division of Brunswick Corporation, and Saxdor Yachts signed a new five-year exclusive supply agreement, extending their long-term partnership for Mercury propulsion systems across Saxdor recreational boats.
Geopolitical Impact Analysis
Trade policy shifts directly raise recreational boat production costs through metal and engine tariffs. According to WTO, global merchandise trade growth slowed sharply amid rising tariff measures, pressuring cross-border marine component flows. U.S. tariffs on imported aluminum reached 25% and steel duties held near 25%, raising hull and trailer input costs. Makers who localize aluminum sourcing will shield margins as these duties persist across the forecast period.
Supply chain rerouting and energy volatility further strain marine logistics and outboard fueling costs. As reported by IEA, crude oil prices swung above USD 90 per barrel during recent supply disruptions, lifting boat operating costs for fuel-dependent owners. Based on World Shipping Council data, Red Sea diversions added 10 to 14 days to some Asia to Europe routes, delaying engine and component deliveries. Manufacturers who hold buffer inventory will protect dealer supply against these transit shocks.
Report Scope
| Report Features | Description |
|---|---|
| Market Value (2025) | USD 28.30 Billion |
| Forecast Revenue (2035) | USD 60.30 Billion |
| CAGR (2026-2035) | 7.9% |
| Base Year for Estimation | 2025 |
| Historic Period | 2020-2024 |
| Forecast Period | 2026-2035 |
| Report Coverage | Revenue Forecast, Market Dynamics, Market Opportunity Analysis, Technology and Innovation Landscape, Competitive Landscape, Recent Developments |
| Segments Covered | By Boat Type (Motorboats, Personal Watercraft, Sailboats, Yachts, Pontoon Boats, Inflatable Boats), By Propulsion Type (Internal Combustion Engine, Electric Propulsion, Hybrid Propulsion, Sail-Powered), By Application (Leisure and Cruising, Watersports and Adventure Activities, Fishing, Marine Tourism and Charter, Racing), By Material Type (Fiberglass, Composite Materials, Aluminum, Steel, Wood), By End User (Individual Owners, Commercial Fleet and Rental Operators, Yacht Clubs and Marinas, Tourism Operators), By Distribution Channel (Dealer Network, Online Sales Platforms, Direct Sales, Boat Shows and Exhibitions), By Engine Power (Below 100 Hp, 100 to 300 Hp, 300 to 500 Hp, Above 500 Hp) |
| Regional Analysis | North America (US and Canada), Europe (Germany, France, The UK, Spain, Italy, and Rest of Europe), Asia Pacific (China, Japan, South Korea, India, Australia, and Rest of APAC), Latin America (Brazil, Mexico, and Rest of Latin America), Middle East and Africa (GCC, South Africa, and Rest of MEA) |
| Competitive Landscape | Brunswick Corporation, Yamaha Motor Co., Ltd., Groupe Beneteau, Malibu Boats, Inc., Mastercraft Boat Holdings, Inc., Correct Craft, Marine Products Corporation, Polaris Inc., Bombardier Recreational Products Inc., Azimut Benetti Group, Ferretti S.P.A., Sunseeker International, Princess Yachts Limited, Hanseyachts Ag, Bavaria Yachtbau Gmbh |
| Customization Scope | Customization for segments, region / country-level will be provided. Additional customization can be done based on requirements. |
| Purchase Options | We have three licenses to opt for: Single User License | Multi-User License (Up to 5 Users) | Corporate Use License (Unlimited User and Printable PDF) |





































