


Report Overview
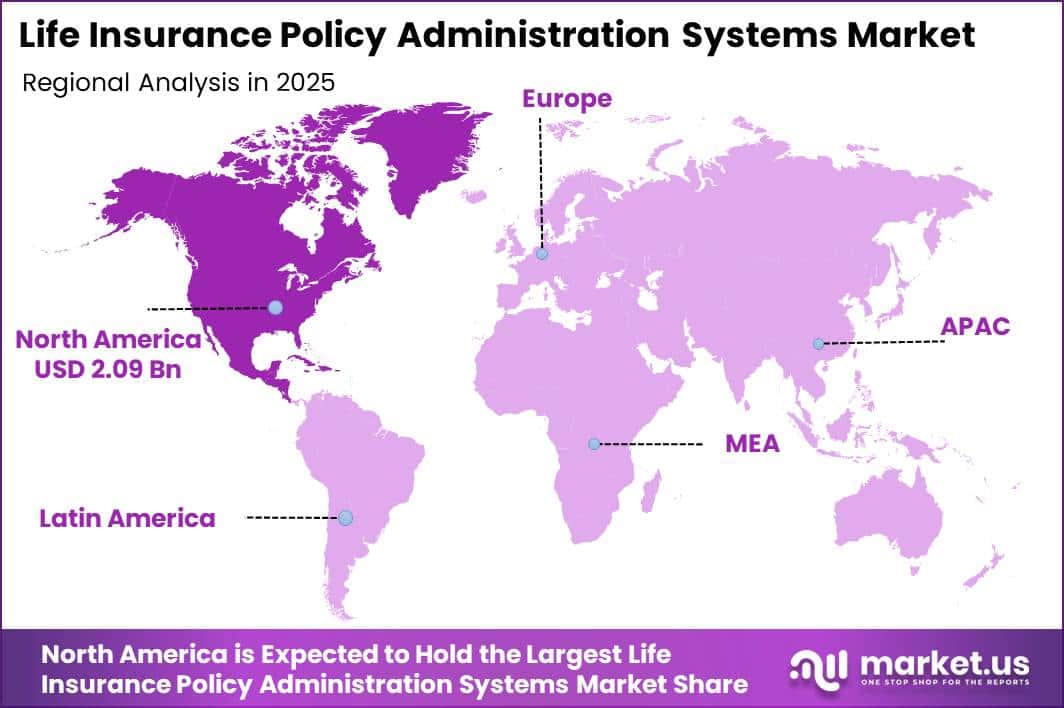
In 2025, the Global Life Insurance Policy Administration Systems Market was valued at USD 5.0 billion. The market is projected to grow at a CAGR of 7.9% during 2life insurance026–2035, reaching approximately USD 10.7 billion by 2035. North America dominated the global market in 2025, accounting for more than 41.7% of the total market share and generating approximately USD 2.09 billion in revenue.
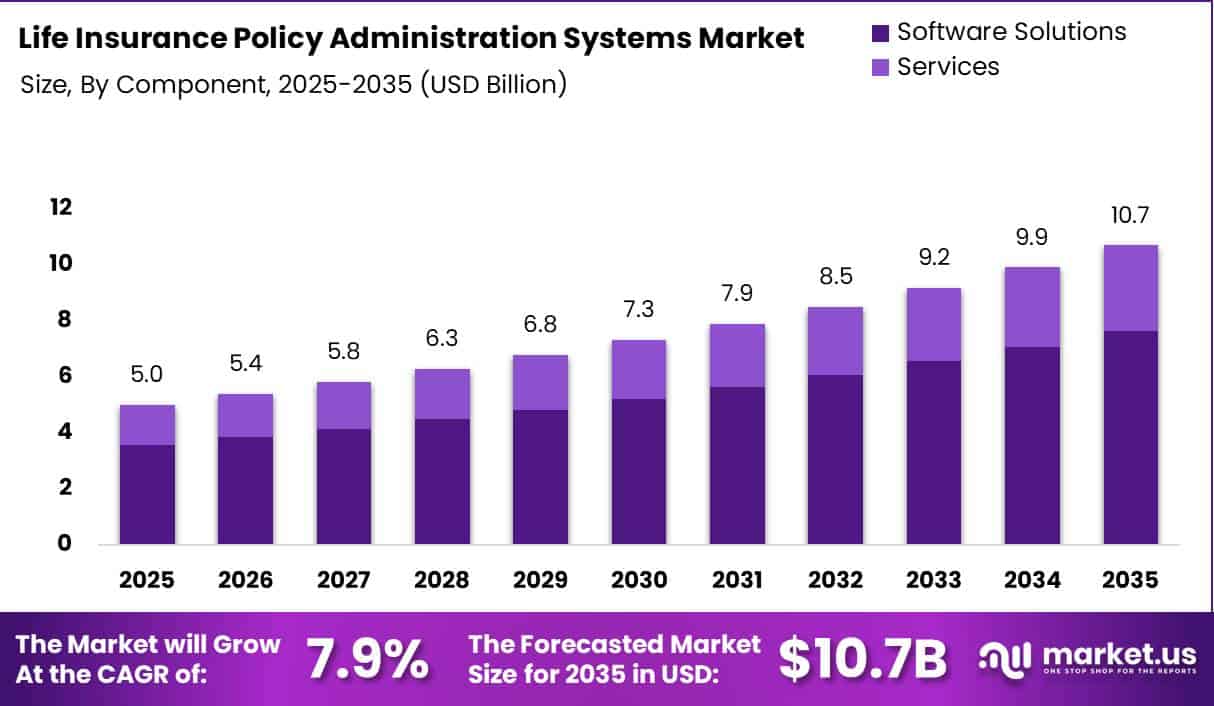
This growth is supported by the rising demand for insurance IT spending, retirement plans, and long-term financial protection. The global population aged 65 and above continues to increase, while at least one third of the world’s population is expected to be over 60 by 2050. This demographic shift is encouraging consumers to purchase products that provide income security, savings, and protection during retirement.
The growing number of policies also creates a direct need for efficient administration technology. In 2023, around 42.5 million life insurance policies were purchased in the United States, while total life insurance coverage reached a record USD 22.2 trillion. Every policy requires continuous processing, including issuance, premium collection, renewals, beneficiary updates, claims support, and regulatory reporting.
North American region’s leadership is supported by its large insurance base, advanced digital infrastructure, and strong focus on regulatory compliance. Insurers are increasingly replacing older platforms with cloud-based systems that support automation, real-time data access, customer portals, analytics, and AI-enabled processes. These investments are expected to maintain steady market growth through 2035.
Key Takeaway
- The Life Insurance Policy Administration Systems market is expected to grow from USD 5.0 billion in 2025 to USD 10.7 billion by 2035, at a 7.9% CAGR.
- Software solutions dominated the component segment with a 71.4% market share.
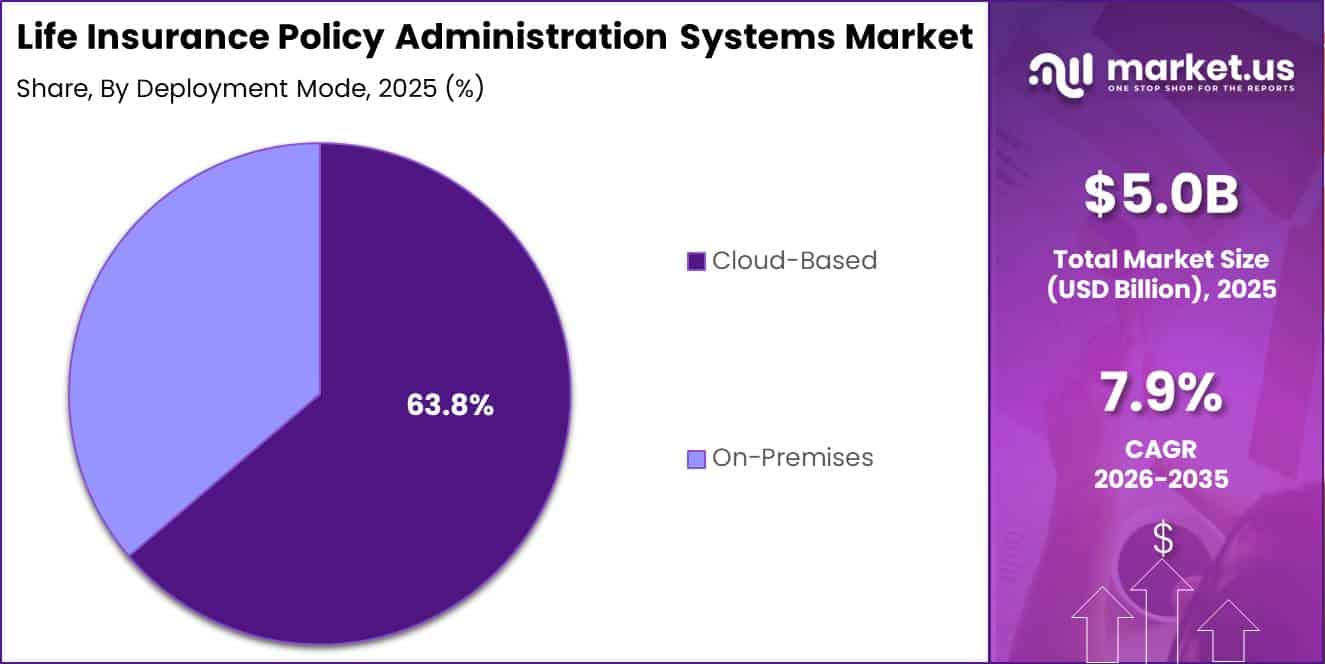
- Cloud-based deployment held a 63.8% share, supported by scalability, lower infrastructure costs, and flexible capacity.
- Policy administration and lifecycle management solutions led the solution type segment with a 37.6% share.
- Individual life insurance dominated the insurance type segment with a 58.2% market share.
- Core policy administration platforms accounted for 42.5% of the market by technology.
- Large insurance carriers represented 68.9% of total spending by enterprise size.
- Policy issuance and administration led the application segment with a 34.8% share.
- Life insurance companies dominated the end-user segment with a 74.3% market share.
- North America led the market with a 41.7% share, generating approximately USD 2.09 billion in 2025.
By Component
The software solutions segment accounted for approximately 71.4% of the Life Insurance Policy Administration Systems market by component. Its leading position is supported by the growing need for centralized platforms that manage policy issuance, pricing, billing, claims support, compliance, and customer records.
Insurance penetration across OECD countries increased from 6.0% of GDP in 2023 to 6.2% in 2024, showing that premium activity continues to expand. The services segment is expected to grow at the fastest rate because insurers require technical support before, during, and after system deployment.
Worldwide insurance IT spending, including software and services, is projected to exceed USD 213.5 billion. A large part of this spending supports consulting, system integration, data migration, platform customization, cloud management, employee training, and ongoing maintenance.
By Deployment Mode
Cloud-based deployment accounted for approximately 63.8% of the Life Insurance Policy Administration Systems market. Its leading position is supported by insurers’ need to manage large and changing workloads without making heavy investments in physical data centers. Life insurers process millions of policy records, premium payments, customer updates, claims, and compliance transactions.
Cloud deployment also lowers upfront infrastructure costs by shifting spending from capital expenditure to operating expenditure. This helps insurers control technology costs, improve the use of financial resources, and launch new products more quickly. A centrally managed cloud platform can support several business units, countries, and insurance products while maintaining common data, security, and governance standards.
Security and system reliability further support cloud adoption. Major public cloud providers invest billions of dollars each year in cybersecurity, data protection, backup systems, resilience, and compliance certifications. Insurers can use these capabilities instead of developing every security function internally.
By Solution Type
Policy administration and lifecycle management solutions held approximately 37.6% of the Life Insurance Policy Administration Systems market by solution type. The segment leads because these platforms manage the full life of an insurance contract, from product design and underwriting to policy issuance, premium collection, amendments, lapses, reinstatements, and claim settlement.
Every stage must follow solvency, tax, reporting, and customer protection rules set by national regulators and international bodies such as the International Association of Insurance Supervisors. As insurers expand individual life, group insurance, annuity, and retirement portfolios, policy-related transactions can reach hundreds of millions worldwide.
By Insurance Type
Individual life insurance accounted for approximately 58.2% of the Life Insurance Policy Administration Systems market by insurance type. The segment leads because each policy is issued separately to an individual or household, creating a large number of contracts that must be managed for many years. Every policy contains different underwriting details, premium schedules, beneficiaries, riders, tax rules, and payment terms.
Insurers also need to process regular changes such as lapses, reinstatements, policy loans, address updates, and claims. In mature insurance markets, millions of households hold at least 1 individual life policy, often together with savings or retirement products. As incomes rise and more first-time customers purchase coverage, the number of active individual policies continues to increase.
Group life insurance is the fastest-growing segment because employers and other organizations are expanding protection and retirement benefits for their workers. A single group policy may cover thousands of employees under 1 master contract. However, the insurer must still manage frequent changes in employee numbers, salaries, job roles, beneficiaries, and benefit levels. Group life administration systems must also connect with payroll and human resource platforms to update records and premiums quickly.
By Technology
Core policy administration platforms accounted for approximately 42.5% of the Life Insurance Policy Administration Systems market by technology. The segment leads because these platforms manage the main policy records and financial calculations used for reserving, solvency control, accounting, and regulatory reporting. In North America, life insurers handle billions of dollars in annual premium income and maintain long-term obligations that must be tracked at the individual policy level.
Core systems store policy terms, beneficiaries, riders, premium histories, guarantees, surrender values, and cash-flow schedules. They also provide data to accounting, tax, risk management, and compliance systems. As regulators strengthen capital, reporting, and data-quality requirements, insurers need accurate and auditable records across every active contract.
By Enterprise Size
Large insurance carriers accounted for approximately 68.9% of Life Insurance Policy Administration Systems spending by enterprise size. Their leading position is supported by the scale of their policy portfolios, premium income, and regulatory duties. In many developed insurance markets, the top 10 carriers generate more than 50–60% of total life insurance business, while individual insurers may collect tens of billions of dollars in premiums each year.
A large carrier can manage tens of millions of active individual and group policies, each with different premium terms, guarantees, beneficiaries, riders, and benefit options. This creates heavy workloads across underwriting, renewals, policy changes, claims, commissions, and regulatory reporting. System errors at this scale can cause major financial, compliance, and customer service risks.
By Application
Policy issuance and administration accounted for approximately 34.8% of Life Insurance Policy Administration Systems spending by application. The segment leads because every new and active policy must be created, recorded, updated, and maintained throughout its full term. In major insurance markets, administration platforms support millions of contracts and process renewals, endorsements, cancellations, premium payments, and coverage changes.
Customer self-service portals are the fastest-growing application segment as policyholders increasingly prefer online services. These portals allow customers to update contact details, change beneficiaries, download statements, make payments, and track claims without contacting a branch or call centre. Large insurers may process millions of digital logins and service transactions each year.
By End User
Life insurance companies accounted for approximately 74.3% of Life Insurance Policy Administration Systems spending by end user. The segment leads because insurers directly manage long-term policy liabilities, premium collections, benefits, reserves, and claims. In major markets such as North America, life insurers handle policy administration spending worth billions of dollars and process annual premium flows that can reach hundreds of billions of dollars.
They also maintain large portfolios of active policies that may remain in force for several decades. Each contract generates continuous data related to underwriting, premium payments, policy options, beneficiaries, surrender values, and claims. These records must be accurate because they support reserving, profit testing, audit work, and regulatory reporting.
Key Market Segments
By Component
- Software Solutions
- Services
By Deployment Mode
- Cloud-Based
- On-Premises
By Solution Type
- Policy Administration & Lifecycle Management
- Digital Customer Management
- Underwriting Management
- Billing & Premium Management
- Claims Administration
By Insurance Type
- Individual Life Insurance
- Group Life Insurance
By Technology
- Core Policy Administration Platforms
- AI & Advanced Analytics Integration
- Robotic Process Automation (RPA)
- Low-Code/No-Code Platforms
By Enterprise Size
- Large Insurance Carriers
- Small & Mid-Sized Insurers
By Application
- Policy Issuance & Administration
- Customer Self-Service Portals
- Compliance & Regulatory Reporting
- Product Configuration & Management
By End User
- Life Insurance Companies
- Brokers & Agencies
- Third-Party Administrators (TPAs)
Geopolitical Impact Analysis
Geopolitical tensions are increasing the cost and operating risk of Life Insurance Policy Administration Systems because these platforms depend on cloud infrastructure, data centres, imported hardware, and international software supply chains. WTO and IMF tariff tracking indicates that import duties on some ICT and electronic products have increased by 10–25 percentage points in major economies since 2018.
These tariffs raise the cost of servers, storage systems, and networking equipment used in policy administration environments. Red Sea and Suez Canal disruptions have also extended transit times on major Asia–Europe routes by 10–15 days when ships travel around the Cape of Good Hope. Freight rates on some routes have more than doubled during periods of severe disruption. These pressures can delay system installations, increase hardware inventories, and raise implementation and maintenance costs for insurers.
Energy price volatility is also affecting cloud and data-centre expenses. According to the International Energy Agency, data centres consumed around 415 TWh of electricity in 2024, equal to approximately 1.4% of global electricity demand. Consumption could approach 950 TWh by 2030, representing nearly 2.3 times the 2024 level.
The United States and China together account for almost 69% of data-centre electricity use. Higher power prices and grid risks force cloud providers to invest in backup systems, additional capacity, and regional infrastructure. For insurers, this results in higher computing and storage costs, longer hardware lead times, and greater demand for multi-region backup, stronger supplier contracts, and careful capacity planning.
Regional Analysis
North America held the leading position in the Life Insurance Policy Administration Systems market, accounting for approximately 41.7% of global revenue and generating about USD 2.09 billion in 2025. The region’s dominance is supported by a mature life insurance industry, high policy volumes, and continued investment in core system modernization across the United States and Canada.
North America generally represents around 35–38% of comparable policy administration technology markets, showing its early adoption of digital insurance platforms. Large insurers in the region manage complex portfolios covering individual life, group insurance, annuities, and retirement products. These operations require advanced systems for policy servicing, tax calculations, regulatory reporting, billing, and claims support.
Asia-Pacific is expected to be the fastest-growing region. The regional market was valued at approximately USD 1.9 billion in 2024 and is projected to reach about USD 5.6 billion by 2032, expanding at a CAGR of 14.3%. Growth is supported by wider insurance access, rising household incomes, digital distribution, and a middle-class population expected to reach 3.5 billion by 2030.
Asia-Pacific represents about 23% of the global software-focused policy administration market. China contributes nearly 39% of regional demand, while India accounts for around 27%. Double-digit growth in cloud-based policy management adoption is encouraging insurers to replace manual and fragmented systems.
Key Regions and Countries
North America
- US
- Canada
Europe
- Germany
- France
- The UK
- Spain
- Italy
- Rest of Europe
Asia Pacific
- China
- Japan
- South Korea
- India
- Australia
- Rest of APAC
Latin America
- Brazil
- Mexico
- Rest of Latin America
Middle East & Africa
- GCC
- South Africa
- Rest of MEA
Market Dynamics
Drivers
| Driver | (~) % CAGR | Geographic Relevance | Impact Timeline |
|---|---|---|---|
| Digital-first distribution and underwriting | +3.0% | North America, Europe, Asia-Pacific | Short term (≤ 2 years) |
| Rising household financialization | +2.0% | Global, strongest in Asia-Pacific | Medium term (2–4 years) |
| Ageing populations and longevity risk | +1.5% | Europe, East Asia, North America | Long term (≥ 4 years) |
| Tax-incentivized savings products | +1.2% | OECD, select emerging markets | Medium term (2–4 years) |
| Expansion of protection gaps in emerging markets | +1.0% | Asia, Latin America, Africa | Long term (≥ 4 years) |
| Shift from guaranteed to unit-linked products | +0.8% | Europe, Asia-Pacific | Short term (≤ 2 years) |
Digital-first distribution and underwriting
The acceleration of digital distribution and automated underwriting in life insurance since 2024 is reshaping front-end and back-end business models by compressing acquisition and servicing costs by roughly 10–20% per policy while cutting average onboarding times from around 2–3 weeks to under 48 hours in markets with mature e-KYC and health-data rails, which materially supports an incremental growth contribution of about +3.0% to the baseline CAGR in 2026 as digital channels capture an increasing share of new policies.
This shift is enabled by cloud-native policy administration, API-based integration with banks and fintechs, and expanded use of rules engines and predictive models to automate up to roughly 70–80% of standard risk decisions for low-sum-assured and simplified-issue products, thereby reducing manual underwriting hours per case and allowing carriers to profitably serve smaller-ticket, mass-market segments that were previously uneconomic.
Strategically, this reallocation from agent-heavy, commission-based channels to mixed or fully digital models lowers combined expense ratios by an estimated 3–5 percentage points and supports higher marginal ROE on incremental premium growth, incentivizing incumbents to invest CapEx into platform modernization and partnerships with insurtechs while redesigning compensation structures, surrender charges, and product riders around continuous digital engagement rather than one-off policy sales.
Restraints
| Restraint | (~) % CAGR | Geographic Relevance | Impact Timeline |
|---|---|---|---|
| Higher-for-longer interest rate environment | -2.8% | North America, Europe, key emerging markets | Short term (≤ 2 years) |
| Capital strain from evolving solvency regimes | -2.2% | Europe, Asia-Pacific | Medium term (2–4 years) |
| Consumer trust deficits and mis-selling legacies | -1.8% | Selected Asian and European markets | Medium term (2–4 years) |
| Distribution concentration in tied-agent networks | -1.5% | Asia, parts of Europe | Long term (≥ 4 years) |
| Regulatory product design constraints | -1.3% | Global | Short term (≤ 2 years) |
| Tax changes reducing product attractiveness | -1.0% | Selected OECD markets | Medium term (2–4 years) |
Higher-for-longer interest rate environment
Persistently elevated policy rates through 2025–2026 in major economies, with central bank benchmarks in several markets remaining roughly 150–250 basis points above pre-2020 averages, are creating a structural squeeze between credited rates to policyholders and achievable portfolio yields, subtracting an estimated -2.8% from the baseline life insurance CAGR as some savings-type products become less competitive versus bank deposits and money-market funds.
On the liability side, existing blocks of guaranteed-rate policies written in the low-yield era now require higher credited rates or enhanced benefits to retain customers, while on the asset side, reinvestment into fixed income occurs at spreads that, after hedging and capital charges, may only widen net investment margins by about 30–60 basis points, leading to margin compression and stricter pricing of new guarantees.
Challenges
| Challenge | (~) % CAGR | Geographic Relevance | Mitigation Horizon |
|---|---|---|---|
| Complex solvency regime transitions | -2.5% | Europe, Asia-Pacific | Medium term (2–4 years) |
| Legacy IT and data fragmentation | -2.0% | Global | Long term (≥ 4 years) |
| Talent gaps in actuarial and data science | -1.7% | Global, especially emerging markets | Medium term (2–4 years) |
| Rising cyber and operational risk | -1.4% | Global | Short term (≤ 2 years) |
| Slow adaptation to changing customer expectations | -1.3% | Global, stronger in developed markets | Long term (≥ 4 years) |
| Macroeconomic and geopolitical volatility | -1.0% | Global | Medium term (2–4 years) |
Complex solvency regime transitions
The phased implementation and recalibration of risk-based capital and Solvency II-style frameworks through 2024–2026 in several Asian and European markets, including new or revised regimes that in some cases require roughly up to double the capital for certain long-duration guarantees versus legacy formulas, are exerting an estimated friction drag of about -2.5% on the life sector’s maximum attainable CAGR by forcing carriers to devote incremental equity to regulatory capital rather than growth investments.
Structural vulnerability arises because changes in interest-rate and lapse-risk calibration, matching-adjustment eligibility, and treatment of illiquid assets can shift required capital ratios by 50–200 basis points for large portfolios, prompting pre-emptive derisking of asset allocations and product redesign that slows new business issuance even where demand is strong.
In response, insurers must adjust over a 2–4-year horizon by rebalancing toward capital-light protection and unit-linked lines, optimizing reinsurance and portfolio hedging, and investing in more granular ALM, scenario modeling, and reporting capabilities, all of which add 5–10% to related operating and compliance costs in the transition period and cap near-term growth below what underlying demographics and financialization would otherwise support.
Opportunities
| Opportunity | (~) % CAGR | Geographic Relevance | Execution Window |
|---|---|---|---|
| Embedded life cover in digital ecosystems | +2.7% | Global, strongest in Asia-Pacific | Short term (≤ 2 years) |
| Protection products for under-40 customers | +2.3% | Global | Medium term (2–4 years) |
| Longevity and retirement solutions innovation | +2.0% | Europe, North America, East Asia | Long term (≥ 4 years) |
| Data-driven personalization and wellness-linked life products | +1.8% | Global | Medium term (2–4 years) |
| Cross-border and regional consolidation plays | +1.5% | Europe, Asia-Pacific, Latin America | Long term (≥ 4 years) |
| Islamic and value-based life offerings | +1.2% | Middle East, Southeast Asia, selected African markets | Medium term (2–4 years) |
Embedded life cover in digital ecosystems
Embedded life insurance distributed through digital ecosystems such as e-commerce, neobanking, payroll platforms, and super-apps represents an untapped channel that could add roughly +2.7% upside to the baseline CAGR if scaled, as less than about 10–15% of global life premiums currently originate from fully digital partner channels despite rapidly rising digital engagement and insurtech enablement.
Unlike the existing digital-first driver, which mainly reflects carriers digitizing their own channels, this opportunity hinges on new monetization models and revenue-sharing structures where partners can access recurring commission or fee streams with minimal balance-sheet risk, while insurers gain access to large user bases, sometimes exceeding 50–100 million active users per platform, at acquisition costs that can be 30–50% lower than traditional agency-based CAC.
Executed effectively, embedding simple term or micro-protection products into everyday financial and commerce journeys can improve persistency by 5–10 percentage points through auto-debit and contextual nudging, support underwriting margin expansion of around 2–3 percentage points via better transactional and behavioral data, and shift unit economics toward capital-light fee income.
Key Players Analysis
Tier-1 companies are estimated to control around 55–65% of Life Insurance Policy Administration Systems-related revenue. This group includes Oracle, SAP, Accenture, Tata Consultancy Services, Infosys, Cognizant, DXC Technology, and Capgemini. Their leadership comes from large global delivery networks, established insurance platforms, and the ability to manage complex, multi-year transformation projects.
Oracle generated USD 11.7 billion from cloud services and license support in the fourth quarter of fiscal 2025, representing 14% year-on-year growth. TCS reported FY 2025 revenue of ₹255,324 crore, or about USD 30 billion, with ₹94,597 crore, approximately 37%, coming from banking, financial services, and insurance clients.
Infosys recorded ₹162,990 crore, or roughly USD 19.5 billion, in FY 2025 revenue and achieved a 21.1% operating margin. DXC’s Global Business Services segment generated USD 1.6 billion in quarterly revenue, while its insurance software and business process services business grew 2.7% organically.
Tier-2 providers, including FINEOS, Sapiens, Insurity, Majesco, EIS, Guidewire, and Zinnia, are estimated to represent 25–35% of the specialized market. These companies commonly generate USD 100–500 million in annual revenue and may spend 10–18% on research and development, equal to around USD 10–70 million annually. Their spending focuses on cloud-native policy platforms, APIs, analytics, and digital customer tools. Large integrators also secure multi-year insurance modernization contracts valued at hundreds of millions of dollars.
Top Key Players in the Market
- FINEOS
- DXC Technology
- Sapiens International
- Insurity
- Majesco
- Oracle
- SAP
- Tata Consultancy Services
- Infosys
- Cognizant
- Accenture
- EIS Group
- Guidewire Software
- Capgemini
- Zinnia
Recent Developments
- In 2026, Oracle reported that its fiscal-year revenue increased by 17% to USD 67.4 billion, while cloud revenue rose by 39% to USD 34.0 billion. Cloud infrastructure revenue expanded by 77% to USD 18.1 billion, strengthening Oracle’s capacity to support large, cloud-based workloads such as life insurance policy administration, data processing, analytics, and secure record management.
- In 2025, Tata Consultancy Services generated USD 30.1 billion in revenue, representing 3.8% year-on-year growth, and recorded a total contract value of USD 39.4 billion. Banking, financial services, and insurance contributed 30.9% of annual revenue, equal to approximately USD 9.3 billion, highlighting TCS’s strong exposure to core banking and insurance technology modernization.
- In 2025, DXC Technology reported USD 393 million in fourth-quarter revenue from Insurance Software and Business Process Services, compared with USD 388 million one year earlier, representing growth of approximately 1.3%. Its Global Business Services division generated USD 1.6 billion during the quarter, showing continued demand for insurance software, policy administration, and operational support despite weaker performance across the wider segment.
Report Scope
| Report Features | Description |
|---|---|
| Market Value (2025) | USD 5.0 Billion |
| Forecast Revenue (2035) | USD 10.7 Billion |
| CAGR (2026-2035) | 7.9% |
| Base Year for Estimation | 2025 |
| Historic Period | 2020-2024 |
| Forecast Period | 2026-2035 |
| Report Coverage | Revenue Forecast, Market Dynamics, Competitive Landscape, Recent Developments |
| Segments Covered | By Component (Software Solutions, Services); By Deployment Mode (Cloud-Based, On-Premises); By Solution Type (Policy Administration & Lifecycle Management, Digital Customer Management, Underwriting Management, Billing & Premium Management, Claims Administration); By Insurance Type (Individual Life Insurance, Group Life Insurance); By Technology (Core Policy Administration Platforms, AI & Advanced Analytics Integration, Robotic Process Automation, Low-Code/No-Code Platforms); By Enterprise Size (Large Insurance Carriers, Small & Mid-Sized Insurers); By Application (Policy Issuance & Administration, Customer Self-Service Portals, Compliance & Regulatory Reporting, Product Configuration & Management); By End User (Life Insurance Companies, Brokers & Agencies, Third-Party Administrators) |
| Regional Analysis | North America – US, Canada; Europe – Germany, France, The UK, Spain, Italy, Rest of Europe; Asia Pacific – China, Japan, South Korea, India, Australia, Singapore, Rest of APAC; Latin America – Brazil, Mexico, Rest of Latin America; Middle East & Africa – GCC, South Africa, Rest of MEA |
| Competitive Landscape | FINEOS, DXC Technology, Sapiens International, Insurity, Majesco, Oracle, SAP, Tata Consultancy Services, Infosys, Cognizant, Accenture, EIS Group, Guidewire Software, Capgemini, Zinnia |
| Customization Scope | Customization for segments, region/country-level will be provided. Moreover, additional customization can be done based on the requirements. |
| Purchase Options | We have three licenses to opt for: Single User License, Multi-User License (Up to 5 Users), Corporate Use License (Unlimited Users and Printable PDF) |





































