


Report Overview
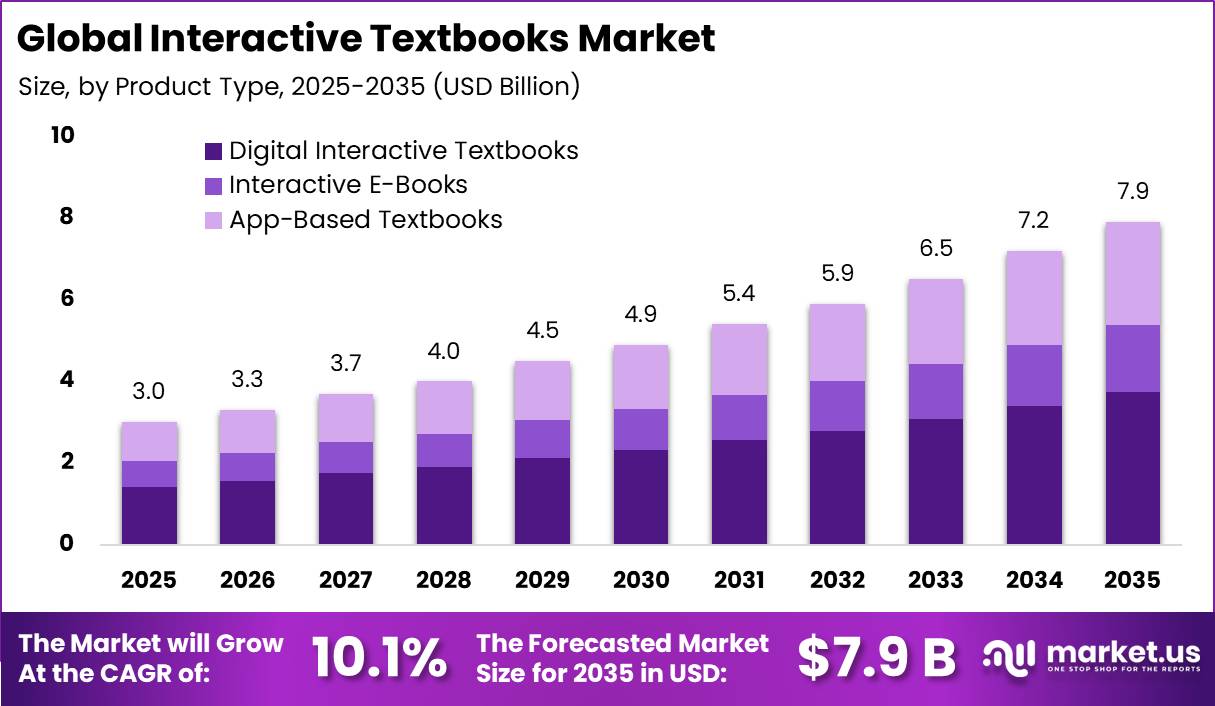
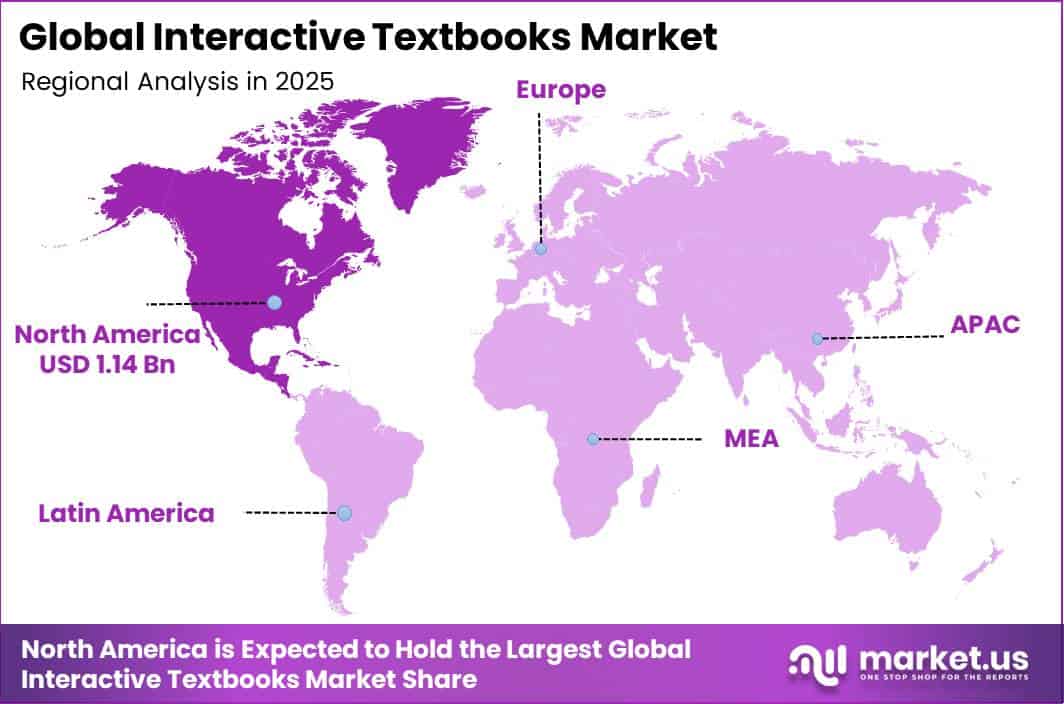
In 2025, the Global Interactive Textbooks Market was valued at USD 3.0 billion. The market is projected to grow at a CAGR of 10.1% during 2026–2035, reaching approximately USD 7.9 billion by 2035. North America dominated the global market in 2025, accounting for more than 38.1% of the total market share and generating approximately USD 1.14 billion in revenue.
UNESCO reports that 40% of primary schools, 50% of lower-secondary schools, and 65% of upper-secondary schools worldwide have internet access for teaching. UNESCO also indicates that distance-learning programs during school closures had the potential to reach more than 1 billion learners, highlighting the large user base for structured digital learning solutions.
In the United States, public elementary and secondary school systems generated USD 994.9 billion in revenue and recorded USD 983.7 billion in expenditure in fiscal year 2024, while current spending reached USD 842.3 billion. Per-student current spending increased by 6.6% year over year to USD 17,619.
Key Takeaway
- The Interactive Textbooks Market was valued at USD 3.0 billion in 2025 and is projected to reach USD 7.9 billion by 2035 at a 10.1% CAGR.
- Digital Interactive Textbooks held a dominant 47.3% share of the product-type segment.
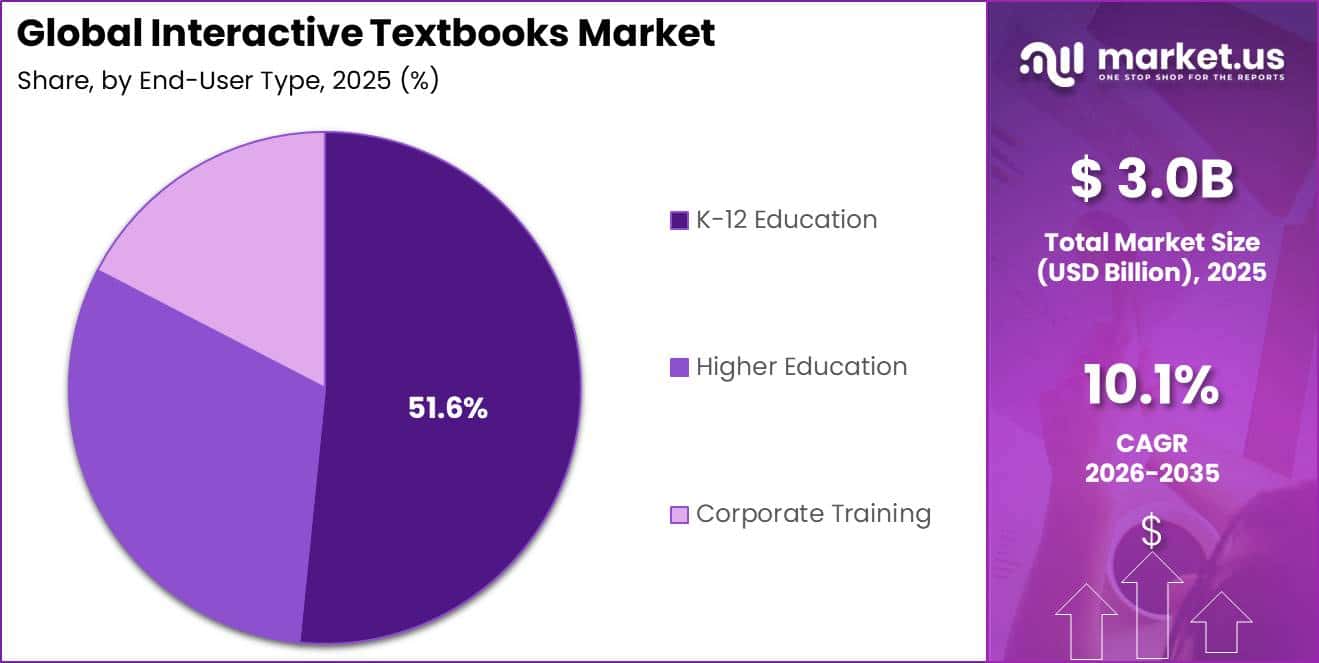
- K–12 Education held a dominant 51.6% share of the end-user segment.
- Android held a dominant 54.2% share of the platform segment.
- North America led the market in 2025 with a 38.1% share, worth approximately USD 1.14 billion.
By Product Type
Digital Interactive Textbooks hold a dominant 47.3% market share, supported by their ability to provide a complete digital learning experience rather than simply reproducing printed books in electronic form. These platforms combine lessons with video, audio, quizzes, simulations, search functions, note-taking tools, and real-time student progress tracking.
This helps teachers assess learning performance more quickly, while publishers can update curriculum content without the cost of printing and distributing new editions. The European Commission reported that more than 90% of European students attended schools with broadband access, providing a strong infrastructure base for cloud-based learning materials.
The region’s digital education strategy also encourages greater investment in connectivity, devices, and digital learning content. OECD’s PISA 2022 assessment covered 81 education systems, showing that digital devices are already widely present across schools. As education providers increasingly focus on using these devices for structured academic learning, digital interactive textbooks are gaining importance.
By End-User
K–12 Education holds a dominant 51.6% share of the Interactive Textbooks Market, mainly because it represents the largest and most consistent group of textbook users. UNESCO reported that global primary and secondary school enrolment reached 1.4 billion learners in 2024, increasing by 327 million, or 30%, compared with 2000.
This large student population creates recurring demand for grade-specific and subject-specific learning materials each academic year. In the United States, public schools enrolled 49.6 million students from pre-kindergarten through grade 12 in 2022, including 34.1 million students in pre-K–8 and 15.5 million students in high school.
By Platform
Android holds a dominant 54.2% share of the Interactive Textbooks Market, supported by its wide use across smartphones and tablets and its suitability for mobile-first learning. The International Telecommunication Union reported 9.1 billion mobile-cellular subscriptions and 95 mobile-broadband subscriptions per 100 people in 2024, while 4 in 5 people aged above 10 owned a mobile phone.
This large mobile user base makes Android-based interactive textbooks easier to access, especially in areas where personal computer availability is limited. GSMA estimated that smartphones accounted for 80% of global mobile connections in 2024 and are expected to reach 91% by 2030. Android also supports a broad range of low-cost devices, helping schools and families reduce hardware expenses.
Key Market Segments
By Product Type
- Digital Interactive Textbooks
- Interactive E-Books
- App-Based Textbooks
By End-User
- K-12 Education
- Higher Education
- Corporate Training
By Platform
- Android
- iOS
- Windows
Geopolitical Impact Analysis
Geopolitical disruption mainly affects the Interactive Textbooks Market through the hardware supply chain, including tablets, smartphones, laptops, displays, batteries, memory chips, chargers, and network equipment. UNCTAD reported that Red Sea shipping diversions around the Cape of Good Hope increased voyage distances by 42%.
Between early December 2023 and early February 2024, average container spot freight rates from Shanghai increased by 122%, while Shanghai–Northern Europe rates rose by 256% to USD 2,648 per TEU. These higher logistics costs can increase the delivered price of Android tablets and other learning devices imported from Asian manufacturing hubs.
UNCTAD also reported that global shipping ton-miles increased by 17% in 2024, as longer routes reduced effective shipping capacity and raised fuel and charter expenses. This can delay school procurement, increase inventory requirements, and raise the cost of bundled devices and digital textbook subscriptions.
Energy-price volatility creates another risk because semiconductor manufacturing, display production, freight transport, and data-centre operations require significant energy. The World Bank projected its energy price index to decline by 12% in 2025 and a further 10% in 2026. However, under supply-shortfall conditions, its April 2025 outlook indicated that average energy prices could increase by 24% in 2026.
Regional Analysis
North America led the global Interactive Textbooks Market in 2025, accounting for 38.1% of total revenue and approximately USD 1.14 billion in market value. The region benefits from strong digital readiness across K–12 schools, colleges, and professional learning institutions, supported by mature cloud, device, and education-software infrastructure.
In the United States, 88% of public schools operated one-to-one computing programs during the 2024–25 school year, providing each student with access to a school-issued laptop or tablet. Among these schools, 89% provided laptops and 27% supplied tablets.
Canada also supports regional growth, with 96.4% of households having access to unlimited broadband at speeds of at least 50/10 Mbps in 2024. Average monthly internet data usage reached 585.5 GB, increasing 9.7% from 2023, supporting wider use of video, simulations, assessments, and other rich-media textbook features.
Asia Pacific is expected to be the fastest-growing regional market, supported by its large student population, rising smartphone ownership, improving broadband coverage, and expanding digital education programs. The International Telecommunication Union reported 95 mobile-broadband subscriptions per 100 inhabitants in 2024, highlighting the broad mobile connectivity base available for digital learning.
Key Regions and Countries
North America
- US
- Canada
Europe
- Germany
- France
- The UK
- Spain
- Italy
- Rest of Europe
Asia Pacific
- China
- Japan
- South Korea
- India
- Australia
- Rest of APAC
Latin America
- Brazil
- Mexico
- Rest of Latin America
Middle East & Africa
- GCC
- South Africa
- Rest of MEA
Market Dynamics
Drivers
| Driver | (~) % CAGR | Geographic Relevance | Impact Timeline |
|---|---|---|---|
| Institutional device availability | +2.0% | North America, Europe, urban Asia Pacific | Short term (2 years or less) |
| Recurring digital curriculum adoption | +1.6% | Global | Short term (2 years or less) |
| Assessment-led content demand | +1.2% | North America, Europe, Middle East | Medium term (2 to 4 years) |
| Workforce skills digitisation | +0.9% | Global | Medium term (2 to 4 years) |
| Multilingual curriculum localisation | +0.7% | Asia Pacific, Latin America, Africa | Medium term (2 to 4 years) |
Institutional device availability
Institutional device availability is a major demand driver because interactive textbooks depend on reliable access to laptops, tablets, or smartphones. In the United States, 88% of public schools operated a one-to-one computing program in the 2024–25 school year, while 89% of these schools provided laptops and 27% provided tablets.
Connectivity further strengthens digital textbook adoption. Statistics Canada reported that 96.4% of households had access to unlimited broadband at speeds of at least 50/10 Mbps in 2024, while ITU data showed 95 mobile-broadband subscriptions per 100 inhabitants in 2024. This strong device and connectivity base supports recurring digital licenses, embedded assessments, and data-driven learning tools, helping sustain the market’s 10.1% CAGR.
Restraints
| Restraint | (~) % CAGR | Geographic Relevance | Impact Timeline |
|---|---|---|---|
| Public-school budget pressure | -1.7% | North America, Europe | Short term (2 years or less) |
| Accessibility compliance costs | -1.1% | United States, Europe | Short term (2 years or less) |
| Student data-protection limits | -0.9% | Global | Medium term (2 to 4 years) |
| Print-curriculum procurement cycles | -0.8% | North America, Latin America | Medium term (2 to 4 years) |
| Unequal household affordability | -0.7% | Low- and middle-income economies | Long term (4 years or more) |
Public-school budget pressure
Public-school budget pressure remains a major restraint because spending on digital curriculum competes with staffing, transport, facilities, and student-support costs. U.S. public elementary and secondary school current expenditure reached USD 842.3 billion in fiscal 2024, but much of this funding is allocated before digital-content purchasing decisions are made.
OECD data also show that 6.5% of qualified teachers left the profession in 2022/23 across 19 reporting systems, increasing staffing and retention costs. The World Bank projected global commodity prices to decline by around 5% in 2025, although financial pressure remains uneven across education systems.
Challenges
| Challenge | (~) % CAGR | Geographic Relevance | Mitigation Horizon |
|---|---|---|---|
| Content interoperability gaps | -1.3% | Global | Medium term (2 to 4 years) |
| Teacher implementation capacity | -1.1% | Global | Medium term (2 to 4 years) |
| Cybersecurity assurance burden | -1.0% | North America, Europe, Asia Pacific | Medium term (2 to 4 years) |
| Offline access reliability | -0.8% | Asia Pacific, Africa, Latin America | Long term (4 years or more) |
| Curriculum version fragmentation | -0.7% | Global | Medium term (2 to 4 years) |
Content interoperability gaps
Content interoperability remains a key operational challenge because schools often use multiple learning-management, identity, assessment, and student-information systems that must exchange data securely. UNESCO highlights the need for common digital standards that protect privacy and reduce data misuse, while many countries still lack clear national rules for generative AI in education.
In the U.S., the Department of Justice’s 2024 Title II rule requires covered public-sector websites and mobile apps to meet WCAG 2.1 Level AA, with compliance for larger state and local governments starting on April 24, 2026. OECD data also show qualified-teacher attrition averaged 6.5% in 2022/23, limiting staff capacity for platform training.
Opportunities
| Opportunity | (~) % CAGR | Geographic Relevance | Execution Window |
|---|---|---|---|
| AI-enabled adaptive courseware | +2.1% | Global | Medium term (2 to 4 years) |
| Workforce credential bundles | +1.5% | North America, Europe, Asia Pacific | Medium term (2 to 4 years) |
| Accessibility-first content replacement | +1.2% | United States, Europe | Short term (2 years or less) |
| Low-bandwidth offline products | +1.0% | Africa, Latin America, South Asia | Long term (4 years or more) |
| Institutional content licensing | +0.8% | Global | Medium term (2 to 4 years) |
AI-enabled adaptive courseware
AI-enabled adaptive courseware is a future growth opportunity, as many education systems are still developing rules for generative AI use. UNESCO notes that most countries do not yet have national AI regulations.
OECD data shows teacher vacancies remain below 3% in 12 of 14 reporting systems, while teacher attrition averaged 6.5% in 2022/23, increasing demand for tools that reduce marking and lesson-planning work.
The ITU reported that 5.5 billion people were online in 2024, creating a large potential user base for AI-supported learning. Adaptive courseware can improve learning through personalized practice, automated feedback, and analytics. A potential 10%–15% reduction in teacher administrative time could support premium pricing and contribute up to 2.1% additional growth above the 10.1% baseline CAGR.
Key Players Analysis
Tier-1 leaders in the Interactive Textbooks Market include Pearson, McGraw Hill, Cengage, and Apple, supported by broad digital-content portfolios, strong institutional sales networks, and established learning ecosystems. Pearson remains a major content provider, reporting £3.57 billion in sales in 2025, including £775 million from Higher Education, £511 million from Virtual Learning, and £1.6 billion from Assessment & Qualifications.
Virtual Learning increased 8% on an underlying basis, while adjusted operating profit reached £614 million, supporting further investment in AI-based courseware, assessments, and digital subscriptions. Pearson is estimated to hold around 20–25% of the commercial interactive-textbook segment, although this is an analyst estimate rather than a company-reported figure.
McGraw Hill and Cengage compete through adaptive courseware, inclusive-access models, and strong U.S. higher-education networks. Houghton Mifflin Harcourt remains important in K–12 education following its 2022 acquisition, while Apple supports digital learning through iPad and its education ecosystem.
Tier-2 players include Wiley, Scholastic, and Smart Sparrow. Wiley reported USD 585 million in fiscal 2025 Learning revenue, up 2%, while a USD 23 million AI licensing agreement highlighted the rising value of educational content. Scholastic reported USD 309.8 million in fiscal 2025 Education Solutions revenue, down 12% from USD 351.2 million, showing growing pressure on education budgets and demand for measurable learning outcomes.
Top Key Players in the Market
- Pearson
- McGraw Hill
- Cengage Learning
- Houghton Mifflin Harcourt
- VitalSource (Ingram Content Group)
- Scholastic
- Wiley
- Smart Sparrow
- Cambridge University Press
- Apple
Recent Developments
- In 2026, Wiley acquired Emerald Publishing Limited from Cambridge Information Group in an all-cash transaction valued at £337 million (USD 452 million). The deal expanded Wiley’s journal portfolio to approximately 2,500 titles and strengthened its proprietary academic content across business, economics, finance, education, and other subjects.
- In 2025, Pearson completed the acquisition of eDynamic Learning on July 24 for cash consideration of £168 million. eDynamic Learning serves more than 885,000 K–12 students across over 9,000 K–12 schools and higher-education institutions, offering 325 digital courses covering more than 40 career pathways.
Report Scope
| Report Features | Description |
|---|---|
| Market Value (2025) | USD 3.0 Billion |
| Forecast Revenue (2035) | USD 7.9 Billion |
| CAGR (2026-2035) | 10.1% |
| Base Year for Estimation | 2025 |
| Historic Period | 2020-2024 |
| Forecast Period | 2026-2035 |
| Report Coverage | Revenue Forecast, Market Dynamics, Competitive Landscape, Recent Developments |
| Segments Covered | By Product Type (Digital Interactive Textbooks, Interactive E-Books, App-Based Textbooks); By End-User (K-12 Education, Higher Education, Corporate Training); By Platform (Android, iOS, Windows) |
| Regional Analysis | North America – US, Canada; Europe – Germany, France, The UK, Spain, Italy, Rest of Europe; Asia Pacific – China, Japan, South Korea, India, Australia, Singapore, Rest of APAC; Latin America – Brazil, Mexico, Rest of Latin America; Middle East & Africa – GCC, South Africa, Rest of MEA |
| Competitive Landscape | Pearson, McGraw Hill, Cengage Learning, Houghton Mifflin Harcourt, VitalSource (Ingram Content Group), Scholastic, Wiley, Smart Sparrow, Cambridge University Press, Apple |
| Customization Scope | Customization for segments and region/country-level will be provided. Additional customization can be done based on requirements. |
| Purchase Options | We have three licenses to opt for: Single User License, Multi-User License (Up to 5 Users), Corporate Use License (Unlimited Users and Printable PDF) |





























