
Quick Navigation
Report Overview
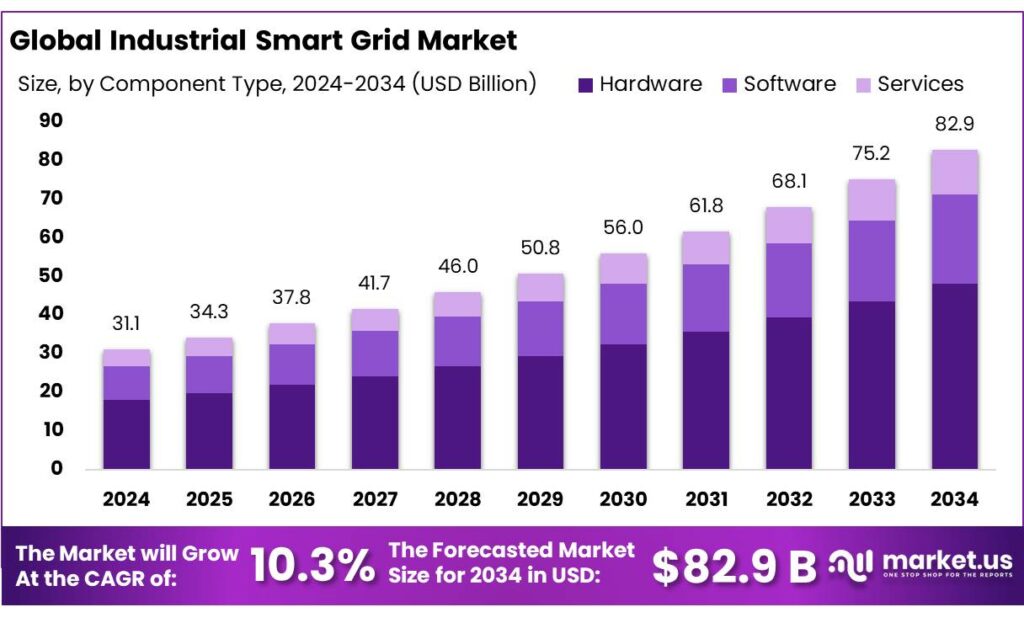
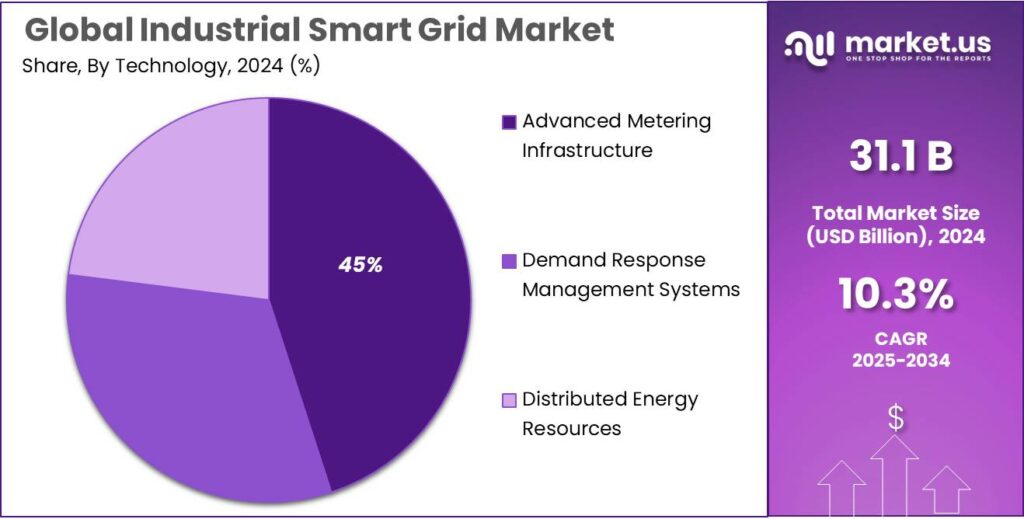
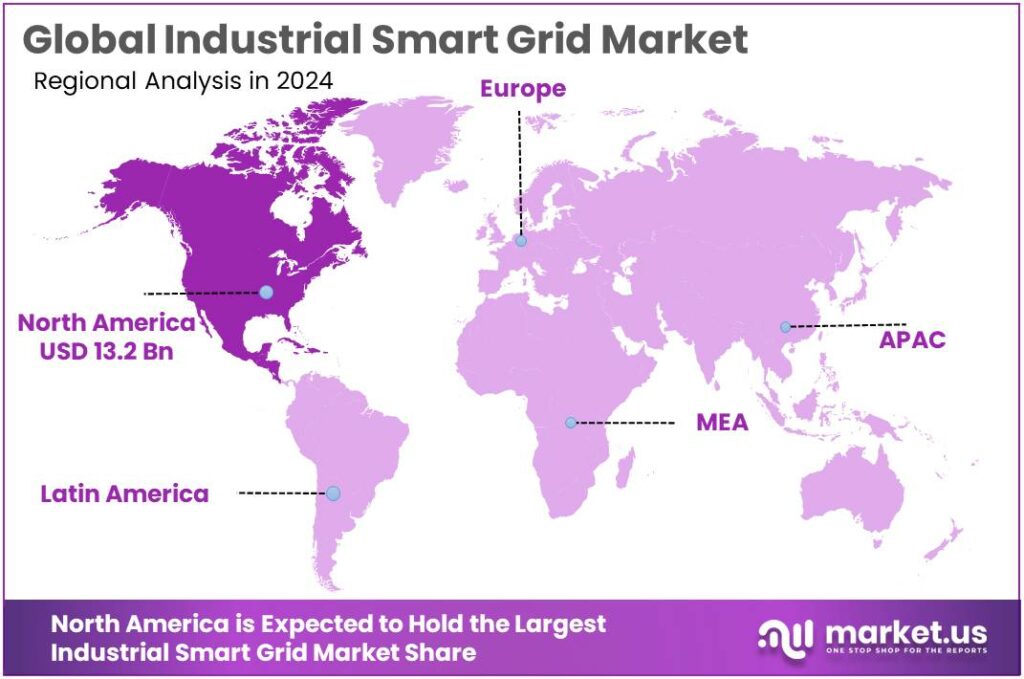
The Global Industrial Smart Grid Market size is expected to be worth around USD 82.9 Billion by 2034, from USD 31.1 Billion in 2024, growing at a CAGR of 10.3% during the forecast period from 2025 to 2034. In 2024, North American held a dominant market position, capturing more than a 42.70% share, holding USD 13.2 Billion revenue.
- Large government-backed programmes are accelerating industrial smart grid deployment. Under China’s 14th Five-Year Plan, State Grid Corporation announced around USD 77 billion of transmission investment in 2023 and USD 329 billion for 2021-2025, with China Southern Power Grid adding about USD 99 billion, taking total planned grid investment to approximately USD 442 billion over the period. The IEA also reports that global transmission investment itself rose by about 10% in 2023 to reach USD 140 billion, supported by policies in Europe, the United States, China, India and parts of Latin America that explicitly prioritise grids for energy transition and industrial competitiveness.
Key Takeaways
- Industrial Smart Grid Market size is expected to be worth around USD 82.9 Billion by 2034, from USD 31.1 Billion in 2024, growing at a CAGR of 10.3%.
- Hardware held a dominant market position, capturing more than a 58.9% share.
- Advanced Metering Infrastructure (AMI) held a dominant market position, capturing more than a 45.2% share.
- Energy and Utilities held a dominant market position, capturing more than a 39.3% share.
- North America retained a dominant position in the industrial smart grid market, accounting for 42.70% of the global share with an estimated market value of USD 13.2 billion.
By Component Type Analysis
Hardware dominates with 58.9% as physical infrastructure drives smart grid adoption.
In 2024, Hardware held a dominant market position, capturing more than a 58.9% share. This leadership was driven by the essential role of devices such as smart meters, sensors, transformers, controllers, and substations in enabling industrial smart grid operations. Industrial facilities relied on these hardware components to monitor, control, and optimize energy distribution, ensuring efficiency, reliability, and reduced downtime.
The demand was further supported by ongoing upgrades to legacy electrical infrastructure and increased adoption of automated and IoT-enabled devices for real-time monitoring. Investment in robust hardware solutions was prioritized in 2024 to support the integration of renewable energy sources, improve load management, and ensure compliance with regulatory standards. Looking into 2025, the hardware segment is expected to maintain its lead as industrial operators continue to modernize their electrical systems, expand smart infrastructure, and adopt scalable and durable devices to strengthen grid intelligence and operational resilience.
By Technology Analysis
Advanced Metering Infrastructure leads with 45.2% as real-time energy monitoring drives adoption.
In 2024, Advanced Metering Infrastructure (AMI) held a dominant market position, capturing more than a 45.2% share. The technology was widely adopted across industrial facilities to provide accurate, real-time measurement of energy consumption and facilitate remote monitoring, billing, and analytics. AMI deployment enabled better load management, demand forecasting, and operational efficiency while supporting integration with renewable energy sources and automated grid controls.
The technology also helped industrial operators detect faults and reduce energy losses, improving overall reliability and cost-effectiveness. In 2024, procurement was driven by regulatory incentives, sustainability goals, and the need for data-driven decision-making in energy management. Looking into 2025, AMI is expected to maintain its leading position as industries continue to modernize energy infrastructure, invest in smart metering technologies, and leverage data insights to optimize consumption and improve grid performance.
By End User Analysis
Energy and Utilities lead with 39.3% as large-scale industrial demand drives smart grid adoption.
In 2024, Energy and Utilities held a dominant market position, capturing more than a 39.3% share. This segment’s leadership was driven by large-scale industrial and utility customers investing in smart grid technologies to improve energy efficiency, monitor consumption, and enhance grid reliability. Deployment of advanced metering infrastructure, sensors, automation systems, and energy management platforms enabled operators to optimise load distribution, integrate renewable energy, and reduce operational costs.
In 2024, procurement was heavily influenced by regulatory incentives, sustainability initiatives, and the need to modernise aging infrastructure, particularly in high-demand industrial zones. The adoption of smart grid solutions also supported predictive maintenance, fault detection, and faster response times, increasing overall system resilience. Looking into 2025, the Energy and Utilities segment is expected to maintain its leading position as large-scale operators continue upgrading infrastructure, integrating renewable sources, and leveraging data-driven insights for smarter energy management.
Key Market Segments
By Component Type
- Hardware
- Software
- Services
By Technology
- Advanced Metering Infrastructure (AMI)
- Demand Response Management Systems (DRMS)
- Distributed Energy Resources (DER)
By End User
- Manufacturing
- Energy and Utilities
- Transportation and Logistics
- Mining and Metals
- Others
Emerging Trends
Data-Driven Food-Energy Platforms Shape Smart Grids
A clear latest trend in industrial smart grids is the move from “generic energy projects” to data-driven platforms built around food and cold-chain operations. Instead of just installing meters and solar panels, large dairies, breweries, bakeries and cold stores are now designing smart-grid projects that follow every kilowatt-hour through their lines, chillers and warehouses. The goal is simple and very human: stop wasting energy, protect products, and stay ahead of climate rules without hurting margins.
- The pressure is real. FAO’s latest update shows agrifood systems emitted about 16.5 billion tonnes CO₂-eq in 2023, equal to 32% of all human-made emissions. At the same time, FAO notes that producing and moving food from farm to fork uses around 30% of global energy and generates over 30% of greenhouse-gas emissions. When one sector carries roughly a third of energy use and emissions, it naturally becomes a priority sandbox for advanced, sector-specific smart-grid solutions.
Another part of the trend is zooming in on where that energy is actually used. FAO and IRENA estimate that agrifood systems consume about 30% of the world’s energy, and roughly 70% of this is burned after harvest in processing, transport, packaging and retail. These are exactly the activities that sit inside industrial parks, logistics hubs and export terminals. Smart-grid pilots in these sites are no longer just about cutting bills; they are built to give managers live visibility of every compressor, freezer tunnel and packaging line.
On the energy side, digital technology is finally getting serious money. The IEA notes that grid-related investment in digital technologies has grown by more than 50% since 2015 and is expected to reach about 19% of total grid investment in 2023, with distribution networks taking over 75% of that digital spend. This is exactly the layer that connects factories, warehouses and ports. Utilities and industrial park developers are using this wave of digital funding to roll out smart meters, feeder automation and data platforms that can talk directly to food companies’ own energy-management systems.
Drivers
Decarbonising Food Chains as a Key Smart-Grid Driver
A powerful driving force behind industrial smart grids is the pressure on food and beverage companies to cut energy use and emissions across their value chains. The Food and Agriculture Organization (FAO) estimates that producing and moving food “from farm to fork” uses about 30% of global energy and generates roughly 30–31% of total greenhouse-gas emissions. FAO’s latest agrifood emissions update shows these systems emitted 16.5 Gt CO₂-eq in 2023, or about 32% of all human-made emissions.
Energy use in food systems is also highly concentrated in processing, storage, and distribution – the parts that rely most on stable, high-quality power. Analyses based on FAO’s “energy-smart food” work indicate that about 70% of energy in agrifood systems is consumed beyond the farm gate, in activities such as processing, refrigeration, and transport. For a dairy plant, meat processor, or beverage bottler, any voltage fluctuation or outage risks product spoilage and lost batches. Industrial smart grids – with real-time monitoring, automated load control, and backup storage – give these facilities tighter control over power quality, peak-demand charges, and fuel switching.
Governments and international agencies are responding directly to this nexus of food, energy, and climate. FAO’s Energy-Smart Food and Energy-Smart Agrifood Systems initiatives explicitly promote the use of renewables, energy efficiency, and modern power management across food chains, highlighting that around 30% of global energy use and “over 30%” of emissions now sit in agrifood systems. In parallel, the International Energy Agency (IEA) estimates overall energy investment at about USD 2.8 trillion in 2023, with more than USD 1.7 trillion flowing into clean energy technologies such as renewables, grids, storage and electrification – the backbone of smart-grid deployments in industry.
These policy signals translate into very practical decisions on factory floors. When a large bakery, brewery, or frozen-foods complex plans to add rooftop solar, biogas from waste, or fast-charging for electric trucks, it quickly faces grid constraints: variable generation, demand spikes, and complex tariffs. Industrial smart-grid solutions – microgrids, advanced metering, demand response, and AI-based load scheduling – help them match high-load equipment with the cleanest or cheapest power available in real time, while keeping within contracted grid limits. That optimisation becomes a core business driver when electricity can make up 20–30% of operating costs in energy-intensive food processing, as various national energy audits have shown.
Restraints
High Upfront Costs and Weak Finance Slow Industrial Smart Grids
A major brake on industrial smart grids is simple: the money is hard to find, especially in food and agrifood industries. These systems need advanced meters, sensors, software platforms, and often on-site storage. The technology is proven, but the first cheque is big. For many food processors, margins are thin and power bills already feel like a heavy fixed cost, so an extra capital project can easily slip down the priority list.
A major brake on industrial smart grids is simple: the money is hard to find, especially in food and agrifood industries. For many food processors, margins are thin and power bills already feel like a heavy fixed cost, so an extra capital project can easily slip down the priority list. A joint FAO–IRENA report also notes that agri-food systems consume around 30% of total energy demand worldwide, most of it still fossil-based. These numbers show how big the decarbonisation task is, but they also highlight how much investment is needed inside factories, mills and cold stores.
On top of this, energy upgrades must compete with many other needs: new processing lines, food-safety compliance, packaging changes, or basic storage. FAO-linked analysis of productive use of renewable energy notes that about 70% of energy in agrifood systems is consumed after harvest—in transport, processing, storage and retail. These are exactly the stages where industrial smart grids could do the most good, but they are also where capital spending is already stretched.
Globally, money is flowing into clean energy, but not always to these mid-sized food players. The International Energy Agency expects total energy investment to exceed USD 3 trillion in 2024, with about USD 2 trillion going into clean energy technologies, grids and storage. However, much of this is channelled through large utilities, state-owned companies and big corporates. For a regional dairy cooperative or frozen-foods processor, tapping that capital often requires navigating complex tenders, guarantees and collateral requirements that they are not set up for.
Opportunity
Smart Food Hubs and Cold Chains as a Growth Engine
One of the strongest growth opportunities for industrial smart grids lies in food parks, cold-chain hubs, and large processing clusters. These sites run energy-hungry refrigeration, steam, compressed air and packaging lines all day. Connecting them through a smart industrial grid – with local renewables, storage and digital controls – can cut waste, emissions and costs at the same time.
The size of the prize is huge. FAO estimates that agrifood systems emitted about 16.5 billion tonnes CO₂-eq in 2023, roughly 32% of all human-made emissions. . At the same time, FAO’s Energy-Smart Food work shows that food chains use around 30% of the world’s total end-use energy, and more than 70% of that energy is consumed beyond the farm gate in processing, transport and storage. Food loss and waste make the case even stronger. FAO’s classic estimate is that about one-third of food produced for people – roughly 1.3 billion tonnes a year – is lost or wasted.
Cooling is a special opportunity. A joint UNEP–FAO report finds that the food cold chain alone is responsible for around 4% of global greenhouse-gas emissions, from both refrigeration technologies and food that spoils when cooling is not available or reliable. . Industrial smart grids can turn cold stores, pack-houses and distribution centres into “smart food hubs” that manage loads dynamically, share on-site solar or biogas power, and use batteries or ice storage to ride through grid disturbances.
Regional Insights
North America leads with 42.70% share and approx. USD 13.2 billion in 2024
In 2024, North America retained a dominant position in the industrial smart grid market, accounting for 42.70% of the global share with an estimated market value of USD 13.2 billion. This leadership was supported by substantial grid modernisation efforts across the United States and Canada, where utilities and manufacturers invested heavily in advanced metering infrastructure, automation and energy management technologies to improve efficiency, reliability and resilience.
The maturity of North American manufacturing and energy sectors, coupled with high per capita electricity usage, underpinned strong demand for solutions that reduce costs and enhance operational visibility. Regulatory frameworks and incentives also encouraged adoption of smart technologies that support decarbonisation and load balancing, particularly in heavy industrial clusters and urban centres. The United States was the largest contributor within the region, driven by targeted funding and policy initiatives aimed at modernising legacy grids and integrating renewables at scale.
Key Regions and Countries Insights
- North America
- US
- Canada
- Europe
- Germany
- France
- The UK
- Spain
- Italy
- Rest of Europe
- Asia Pacific
- China
- Japan
- South Korea
- India
- Australia
- Rest of APAC
- Latin America
- Brazil
- Mexico
- Rest of Latin America
- Middle East & Africa
- GCC
- South Africa
- Rest of MEA
Key Players Analysis
Siemens — In 2024, Siemens reported USD 82.0 billion in revenue with a net income of USD 9.7 billion, demonstrating strong financial scale and broad industrial capabilities. Its Smart Infrastructure and energy automation solutions support industrial smart grid deployments through advanced sensors, grid automation platforms and control systems that enable real‑time monitoring, efficiency improvements and grid resilience.
Schneider Electric — Schneider Electric achieved €38.1 billion in revenues in 2024, with robust growth in energy management and industrial automation. Its smart grid products integrate power control, automation, and digital services to enhance energy efficiency and operational resilience in industrial infrastructure.
Cisco — Cisco Systems reported USD 57.5 billion in revenues in 2024, including strong networking and cybersecurity segments that support smart grid communications and secure data exchange. Its solutions are critical for industrial connectivity, IoT integration, and secure grid management platforms.
Top Key Players Outlook
- Siemens
- GE
- ABB
- Schneider Electric
- Cisco
- Honeywell
- Eaton
- Mitsubishi Electric
- Itron
- NRG Energy
Recent Industry Developments
In 2024, GE’s energy arm—GE Vernova—reported USD 34.9 billion in revenue, USD 44.1 billion in total orders, and USD 1.6 billion in net income, reflecting solid performance in power, grid and electrification equipment that supports industrial smart grid deployments.
In 2024, Siemens AG generated €75.9 billion in revenue and €9.0 billion in net income, supported by a global workforce of around 312,000 people, illustrating the company’s broad industrial scale and financial strength.
Report Scope
| Report Features | Description |
|---|---|
| Market Value (2024) | USD 31.1 Bn |
| Forecast Revenue (2034) | USD 82.9 Bn |
| CAGR (2025-2034) | 10.3% |
| Base Year for Estimation | 2024 |
| Historic Period | 2020-2023 |
| Forecast Period | 2025-2034 |
| Report Coverage | Revenue Forecast, Market Dynamics, Competitive Landscape, Recent Developments |
| Segments Covered | By Component Type (Hardware, Software, Services), By Technology (Advanced Metering Infrastructure (AMI), Demand Response Management Systems (DRMS), Distributed Energy Resources (DER)), By End User (Manufacturing, Energy and Utilities, Transportation and Logistics, Mining and Metals, Others) |
| Regional Analysis | North America – US, Canada; Europe – Germany, France, The UK, Spain, Italy, Rest of Europe; Asia Pacific – China, Japan, South Korea, India, Australia, Singapore, Rest of APAC; Latin America – Brazil, Mexico, Rest of Latin America; Middle East & Africa – GCC, South Africa, Rest of MEA |
| Competitive Landscape | Siemens, GE, ABB, Schneider Electric, Cisco, Honeywell, Eaton, Mitsubishi Electric, Itron, NRG Energy |
| Customization Scope | Customization for segments, region/country-level will be provided. Moreover, additional customization can be done based on the requirements. |
| Purchase Options | We have three licenses to opt for: Single User License, Multi-User License (Up to 5 Users), Corporate Use License (Unlimited User and Printable PDF) |


