Report Overview
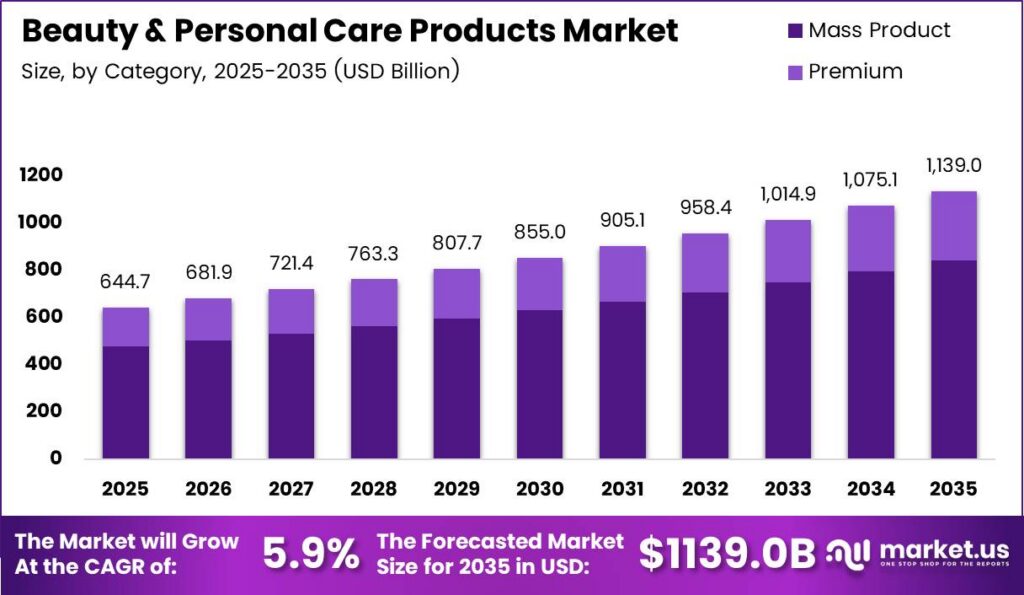
Global Beauty and Personal Care Products Market size is expected to be worth around USD 1,139.0 Billion by 2035 from USD 644.7 Billion in 2025, growing at a CAGR of 5.9% during the forecast period 2026 to 2035. Beauty and personal care products encompass topical skin, hair, oral, hygiene, fragrance, and color formulations that cleanse, protect, and enhance human appearance daily. Habitual consumer replenishment routines insulate manufacturer cash flows from wider retail downturns.
Commercial buyers span mass grocers, pharmacy chains, dermatology clinics, professional salons, and digital marketplaces. According to Personal Care Products Council, the US personal care industry generated USD 495.6 Billion in economic output, supported 2.6 Million jobs, and added USD 242.4 Billion to GDP. This reflects deep integration across specialty chemical manufacturing, packaging logistics, and retail merchandising. Consequently, investors gain defensive cash flows backed by recurring household hygiene budgets.
Key Takeaways
- Global Beauty and Personal Care Products Market was valued at USD 644.7 Billion in 2025.
- Global market revenue reaches USD 1,139.0 Billion by 2035.
- Revenue expands at a compound annual growth rate of 5.9% from 2026 to 2035.
- Personal Care Products led the product segment with a 41.23% market share in 2025, while Cosmetics/Makeup Products registers the fastest category expansion.
- Mass Product captured a dominant 73.45% share of the category segment in 2025, whereas Premium represents the fastest growing tier.
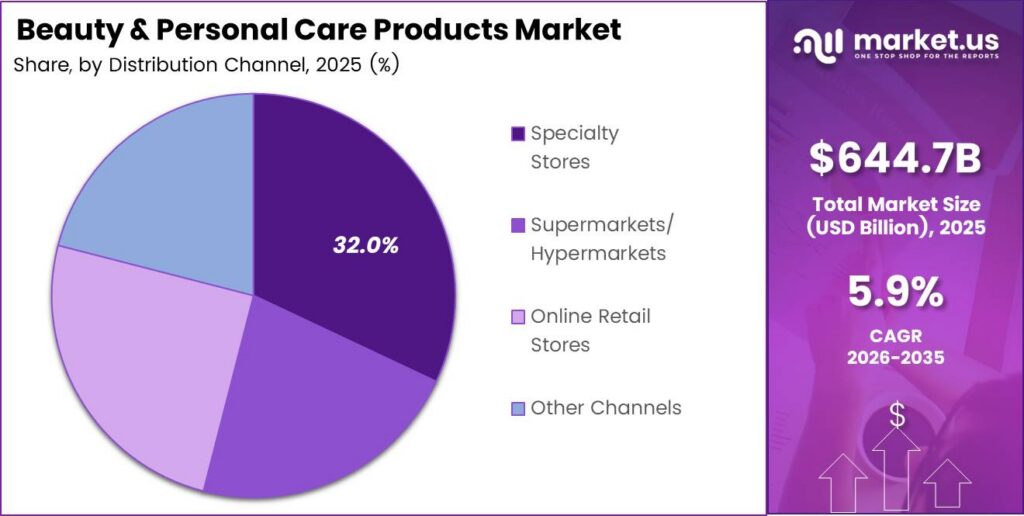
- Specialty Stores held a leading 32.00% share of distribution channels in 2025, while Online Retail Stores posts the fastest channel expansion.
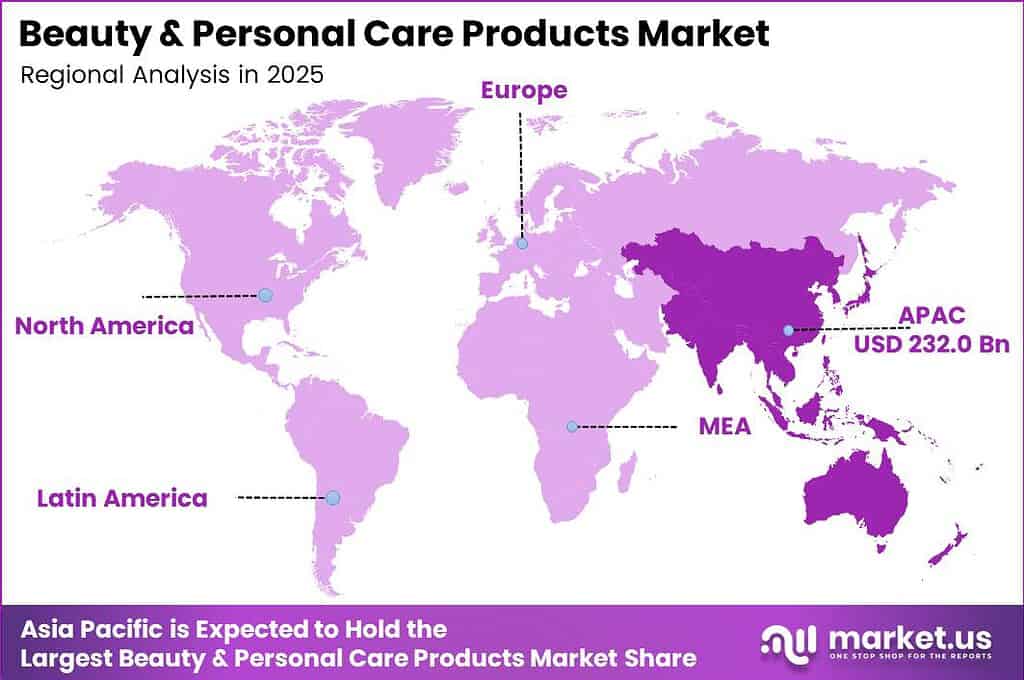
- Asia-Pacific dominated global demand in 2025 with a 36.06% share valued at USD 232.0 Billion and remains the fastest growing region through 2035.
- The analytical forecast period runs from 2026 to 2035, benchmarked against the 2025 base estimation year.
Strict statutory safety mandates govern formulation approvals and manufacturing compliance worldwide. Data from the US Food and Drug Administration shows 16,398 active cosmetic facility registrations and 1,298,361 active product listings under the Modernization of Cosmetics Regulation Act by June 2026. Mandatory biennial renewals and adverse event tracking raise compliance costs for undercapitalized indie labels. Therefore, scale manufacturers with dedicated toxicology teams capture shelf space from noncompliant rivals.
Strategic consolidation is reshaping portfolio scale across consumer health and beauty categories. In November 2026, a major consumer goods group completed an enterprise acquisition valued at USD 48.7 Billion, uniting 10 billion dollar personal care and skin health brands. The transaction targets USD 2.1 Billion in annual run rate synergies across clinical distribution networks. This signals that conglomerates are buying established dermatological equity to lower customer acquisition costs.
Asia-Pacific leads global consumption with a 36.06% revenue share in 2025, outpacing mature Western economies. As reported by Cosmetics Europe, European cosmetics retail sales reached EUR 110 Billion in 2025 on steady 4.6% annual expansion. By contrast, Asia-Pacific combines rapid middle class urbanization, high mobile social commerce conversion, and dense domestic formulation ecosystems. Consequently, global brand owners prioritize localized active skincare launches across Asian metropolitan hubs.
Luxury fashion houses are monetizing prestige scent and skincare equity through long term licensing alliances. In March 2026, a leading French beauty group closed a EUR 4 Billion cash buyout of a luxury fashion conglomerate’s beauty division, securing 50 year exclusive brand licenses. High gross margins in artisanal fragrances fund clinical longevity ventures for licensing partners. Therefore, capital allocators favor prestige scent assets to offset mass retail price compression.
Product Analysis
Personal Care Products dominates with 41.23% share in 2025 due to daily household hygiene replenishment cycles.
In 2025, Personal Care Products held a 41.23% share in the Product segment of the Beauty and Personal Care Products Market. Cosmetics Europe indicates that European skin care reached EUR 32.3 Billion and toiletries hit EUR 26.4 Billion in 2025, while Procter & Gamble Beauty net sales rose 7.1% to USD 16,023 Million in fiscal 2026. Based on Colgate-Palmolive data, 2025 net sales hit USD 20,382 Million with Oral Care at 44%, alongside Procter & Gamble’s USD 150 Million Oral-B plant expansion across 150,000 square feet adding 100 jobs. Daily epidermal barrier protection and enamel remineralization require continuous surfactant and fluoride replenishment, securing predictable baseline factory utilization for suppliers.
Men’s Grooming Products, Deodorants and Antiperspirants, and Perfumes and Fragrances anchor daily odor control, precision shaving, and personal scent layering routines. Figures from Procter & Gamble Form 10-K filings show Grooming segment net sales reached USD 6,918 Million in fiscal 2026, while L’Oreal committed EUR 60 Million in November 2025 to scale its Gauchy fragrance plant toward 200 Million bottles yearly. Fine fragrance extrait formulations require higher essential oil concentrations and extended ethanol maceration tanks, whereas aluminum free deodorants rely on specialized antimicrobial esters. Consequently, contract fillers expanding automated glass bottling and stick molding lines capture higher margin prestige contracts.
Cosmetics/Makeup Products represents the fastest growing product tier, spanning facial foundations, eye mascaras, and lip and nail colorants. Data from Cosmetics Europe shows European decorative cosmetics generated EUR 13.6 Billion in 2025 retail sales following 8.2% expansion in 2024, while e.l.f. Beauty acquired hybrid cosmetics brand rhode for up to USD 1 Billion in August 2025. Modern hybrid color formulations suspend surface treated iron oxides inside peptide and ceramide emulsions to deliver simultaneous pigment coverage and barrier hydration. This means color brands integrating clinical skincare actives command higher average unit prices and stronger repeat purchase loyalty.
Category Analysis
Mass Product dominates with 73.45% share in 2025 due to broad retail affordability and penetration.
In 2025, Mass Product held a 73.45% share in the Category segment of the Beauty and Personal Care Products Market. According to L’Oreal Annual Report filings, the Consumer Products Division generated EUR 16,089.7 Million in 2025 consolidated sales, representing 37% of total group revenue. High speed continuous emulsion batching and standardized commodity surfactant procurement lower unit manufacturing costs for everyday cleansers, shampoos, and lotions. Therefore, mass manufacturers preserve shelf dominance during inflationary cycles by offering accessible price tiers across emerging and developed households.
Premium represents the fastest growing category segment as ingredient literate shoppers trade up to dermatologist validated serums and artisanal scents. As reported by The Estee Lauder Companies Form 10-K filings, prestige portfolio net sales climbed 5% to USD 15,049 Million in fiscal 2026. Clinical prestige formulations require encapsulated retinoids, stabilized vitamin C derivatives, and airless dispensing systems that prevent oxidative degradation. Consequently, specialty ingredient suppliers holding patented active delivery molecules secure superior gross margins and multiyear supply exclusivity with premium brand owners.
Luxury and masstige crossover formulations bridge selective couture counters and transparent active ingredient labels for aspirational buyers. LVMH Full Year Results found that the Perfumes and Cosmetics division recorded EUR 8,174 Million in 2025 revenue, while Hindustan Unilever acquired a 90.5% stake in actives brand Minimalist at an INR 2,955 Crore valuation in January 2025. Combining pharmaceutical grade niacinamide or peptide concentrations with streamlined packaging allows masstige brands to match luxury efficacy at accessible mid tier pricing. As a result, conglomerates acquire digital native active brands to capture younger consumers migrating from commodity mass products.
Distribution Channel Analysis
Specialty Stores dominates with 32.00% share in 2025 due to guided shade matching and diagnostics.
In 2025, Specialty Stores held a 32.00% share in the Distribution Channel segment of the Beauty and Personal Care Products Market. Data from the US Census Bureau shows monthly sales at US health and personal care specialty stores reached USD 39,248 Million in August 2026, while Ulta Beauty acquired UK retailer Space NK and its 83 stores in July 2025. High price serums, foundations, and prestige fragrances require physical tester sampling, optical skin diagnostics, and trained beauty advisors to overcome buyer hesitation. Therefore, prestige brands prioritize specialty retail exclusivity to protect pricing power and build brand equity.
Supermarkets/Hypermarkets serve as high traffic physical anchors for routine family replenishment of oral care, bath soaps, shampoos, and mass moisturizers. Based on US Census Bureau data, US supermarket and grocery store sales totaled USD 74,191 Million in August 2026, while warehouse clubs and supercenters generated USD 787.4 Billion in 2025. Consolidating personal hygiene purchases into weekly grocery trips lowers per unit distribution logistics costs through full pallet cross docking. This means mass manufacturers must fund prominent endcap slotting and multipack value formats to defend volume share against private label grocers.
Online Retail Stores represents the fastest growing retail channel, alongside direct sales, salons, and travel retail outlets. Figures from the US Census Bureau show US retail ecommerce sales jumped 12.2% year over year to USD 340.2 Billion in Q2 2026 for a 17.1% retail share. Eurostat indicates that 20% of European Union internet users bought cosmetics online within 3 months as overall online shopping penetration reached 77%. Algorithmic shade finder tools and replenishment subscriptions eliminate physical store overhead, enabling brands to capture first party consumer data and higher direct margins.
Key Market Segments
By Product
- Personal Care Products
- Hair Care
- Shampoo
- Conditioner
- Hair Colorant
- Hair Styling Products
- Others
- Skin Care
- Facial Care Products
- Body Care Products
- Lip and Nail Care Products
- Bath and Shower
- Shower Gels
- Soaps
- Others
- Oral Care
- Toothbrush
- Toothpaste
- Mouthwashes and Rinses
- Others
- Hair Care
- Men’s Grooming Products
- Deodorants and Antiperspirants
- Perfumes and Fragrances
- Cosmetics/Makeup Products
- Facial Cosmetics
- Eye Cosmetics
- Lip and Nail Makeup Products
By Category
- Mass Product
- Premium
By Distribution Channel
- Specialty Stores
- Supermarkets/Hypermarkets
- Online Retail Stores
- Other Channels
Regional Analysis
Asia-Pacific Dominates the Beauty and Personal Care Products Market with a Market Share of 36.06% in 2025, Valued at USD 232.0 Billion
Asia-Pacific captured a 36.06% global revenue share valued at USD 232.0 Billion in 2025 and stands as the fastest growing region. According to the US Food and Drug Administration, mandatory facility data recorded 4,260 registered cosmetic factories in China, 617 in South Korea, and 309 in India among 7,732 foreign sites. Dense regional contract manufacturing ecosystems shorten product formulation cycles and supply rapid livestream ecommerce demand across urbanizing Asian cities. Therefore, multinational brands localize research hubs across Asia-Pacific to accelerate speed to market.
North America maintains high per capita beauty spending anchored by clinical dermocosmetics, prestige fragrances, and specialty chain retailing. Personal Care Products Council found that US cosmetic and personal care exports reached USD 15.8 Billion in 2025, with Canada, Mexico, and China absorbing 41.6% of export value. Integrated North American supply chains allow domestic formulators to scale clinical skincare and wellness lines across cross border retail networks without duty friction. Consequently, manufacturers investing in automated US production lines protect regional margins against transoceanic freight volatility.
Europe, Latin America, and Middle East and Africa provide diversified export and consumption engines for beauty producers. As reported by Cosmetics Europe, intra European trade topped EUR 52.3 Billion and extra European exports passed EUR 29.4 Billion, supporting 2.9 Million jobs. Data from the World Bank shows Brazil GDP reached USD 2.28 Trillion on 2.3% expansion in 2025, while Middle East and North Africa GDP growth accelerates from 2.8% in 2025 to 3.3% in 2026. Rising Gulf tourism and Latin American pharmacy retail reward climate adapted sunscreens and prestige oud fragrances.
Key Regions and Countries
North America
- US
- Canada
Europe
- Germany
- France
- The UK
- Spain
- Italy
- Rest of Europe
Asia Pacific
- China
- Japan
- South Korea
- India
- Australia
- Rest of APAC
Latin America
- Brazil
- Mexico
- Rest of Latin America
Middle East and Africa
- GCC
- South Africa
- Rest of MEA
Market Dynamics
Global competitive positioning hinges on balancing clinical active innovation against tightening chemical safety and sustainable packaging laws. Based on European Chemicals Agency data, European Union restrictions enforcing a 0.1% weight limit on cyclic siloxanes D4, D5, and D6 after June 2026 impact 17,838 tonnes of annual cosmetic volume to cut emissions by 90%. Removing legacy silicone emollients forces widespread reformulation across leave on hair serums, deodorants, and foundations. Consequently, bio based ester producers gain immediate commercial leverage with global formulators.
Drivers
Consumers shifted from discretionary color and botanical creams toward dermatologist backed active skincare between 2024 and 2026. Brands redirected marketing budgets from celebrity campaigns into medical detailing networks covering over 320,000 healthcare professionals worldwide. Multinationals filed more than 725 formulation patents in 2025, driving leading dermocosmetic organic sales up 5.5% to 11.7% while mass personal care slowed to 2.5%. This reflects enduring buyer preference for clinically proven skin barrier and pigment repair.
Clinically validated barrier repair and photoprotection products command 25% to 40% retail price premiums over standard mass moisturizers. Proven efficacy lifts repeat purchase rates by 18% to 22% and cuts customer acquisition costs by 350 to 500 basis points of revenue. Consequently, dermocosmetic divisions expand operating margins above 24%, rewarding investors who back patent protected clinical portfolios and pharmacy channel distribution.
| Driver | (~) % Impact on CAGR Forecast | Geographic Relevance | Impact Timeline |
|---|---|---|---|
| Clinical Dermocosmetics Adoption | +1.6% | Global | Short term (≤ 2 years) |
| Social Commerce Shoppable Video | +1.2% | Asia-Pacific & North America | Short term (≤ 2 years) |
| Prestige Fragrance Wardrobing | +0.9% | Europe, Middle East & North America | Medium term (2–4 years) |
| Scalp Skinification Formulations | +0.8% | North America & Europe | Medium term (2–4 years) |
| Tier-2 & Tier-3 Urbanization | +0.7% | South Asia, Southeast Asia & Latin America | Long term (≥ 4 years) |
| Male Grooming Routine Expansion | +0.5% | Global | Medium term (2–4 years) |
Restraints
Statutory chemical bans across Europe halt retail sales of noncompliant beauty stock. Prohibitions cover 22 toxic substances including gel nail photoinitiators from September 1, 2025, nanomaterials from November 1, 2025, and French cosmetic fluoroalkyl bans from January 1, 2026. European Union undecafluorohexanoic acid limits start October 10, 2026 before rinse off microplastic phaseouts on October 16, 2027. These deadlines force immediate delistings across 12% to 18% of legacy sunscreens, nail gels, and long wear makeup.
Replacing fluorinated film formers and cyclic silicones requires 14 to 22 months of stability retesting per product and raises unit raw material costs by USD 0.18 to USD 0.45. Manufacturers absorb inventory write downs of 80 to 140 basis points of gross sales while shifting 30% to 45% of research budgets into defensive compliance. As a result, beauty producers delay planned capacity expansions by 4 to 6 quarters, slowing near term revenue momentum.
| Restraint | (~) % Impact on CAGR Forecast | Geographic Relevance | Impact Timeline |
|---|---|---|---|
| Mandatory Chemical & PFAS Bans | -1.1% | European Union & North America | Short term (≤ 2 years) |
| Cross-Border Import Tariff Escalation | -0.9% | North America, China & Europe | Short term (≤ 2 years) |
| Mainland China Duty-Free Contraction | -0.7% | Asia-Pacific Travel Retail | Medium term (2–4 years) |
| Facility Registration Suspension Enforcement | -0.5% | United States | Short term (≤ 2 years) |
| Substantiation Crackdowns on Green Claims | -0.4% | European Union & United Kingdom | Medium term (2–4 years) |
| High-Cost Indie Venture Financing | -0.3% | North America & Europe | Short term (≤ 2 years) |
Challenges
Severe shortages of cosmetic grade recycled resin create operational bottlenecks after European Union Regulation 2025/40 took general effect on August 12, 2026. Exporters must retain conformity files for 5 to 10 years and meet January 1, 2030 mandates for 30% recycled polyethylene terephthalate and 10% recycled other plastics. Rules also cap ecommerce empty carton space at 50% and ban decorative double walled jars across European retail shelves.
Odor free recycled cosmetic resins carry a 28% to 45% price premium over virgin plastics with 16 to 24 week lead times. Multi material airless pumps and metallized compacts fail recyclability grades and trigger 15% to 35% Extended Producer Responsibility fee surcharges. Therefore, brands face USD 1.2 Million to USD 3.5 Million per line in mono material molding retooling and 5 year resin supply lockups, squeezing smaller competitors.
| Challenge | (~) % CAGR Friction Drag | Geographic Relevance | Mitigation Horizon |
|---|---|---|---|
| Recyclable Packaging Compliance Bottlenecks | -0.9% | European Union & Global Exporters | Medium term (2–4 years) |
| Paid Digital Acquisition Inflation | -0.7% | North America & Europe | Short term (≤ 2 years) |
| Botanical Feedstock Climate Volatility | -0.6% | Global Supply Chains | Long term (≥ 4 years) |
| Grey-Market Prestige Price Erosion | -0.5% | Asia-Pacific & Europe | Medium term (2–4 years) |
| Cosmetic Toxicologist Talent Deficit | -0.4% | United States & European Union | Medium term (2–4 years) |
| Counterfeit E-Commerce Marketplace Proliferation | -0.3% | Global | Short term (≤ 2 years) |
Opportunities
Precision fermentation remains largely untapped across beauty supply chains because fewer than 8% of mass and masstige formulas currently use bioengineered proteins, lipids, or enzymatic actives. Scaling industrial bioreactors to 50,000 liter runs cuts active unit production costs by 40% to 65% versus wild botanical extraction. Industrial fermentation also lowers water and land usage by over 85% while delivering 99% molecular purity for recombinant human collagen, squalane, and exosome peptides.
Early movers that acquire biotech synthesis startups or patent custom microbial strains unlock lucrative ingredient licensing revenue streams. Bioengineered prestige launches command 20% to 30% retail price uplifts and expand gross margins by 300 to 450 basis points over a 2 to 4 year execution window. Consequently, formulators adopting fermentation shield their cost of goods sold from erratic agricultural harvests and petrochemical price swings.
| Opportunity | (~) % Potential CAGR Upside | Geographic Relevance | Execution Window |
|---|---|---|---|
| Precision-Fermented Biotech Actives | +1.3% | Global | Medium term (2–4 years) |
| GLP-1 Aesthetic Companion Skincare | +1.1% | North America & Europe | Short term (≤ 2 years) |
| Standardized Refillable Vessel Ecosystems | +0.9% | Europe, Japan & North America | Medium term (2–4 years) |
| Longevity & Menopause Personal Care | +0.8% | North America, Europe & East Asia | Medium term (2–4 years) |
| AI Micro-Dosed Diagnostic Customization | +0.6% | North America, Europe & South Korea | Long term (≥ 4 years) |
| Contract Manufacturer Roll-Up Consolidation | +0.5% | North America & Europe | Short term (≤ 2 years) |
Key Company Insights
L’Oréal SA
L’Oreal SA operates as the world’s largest pure play beauty manufacturer across Consumer Products, Luxe, Dermatological Beauty, and Professional Salon channels in over 150 countries. Figures from L’Oreal 2025 Annual Results show consolidated sales reached EUR 44.05 Billion on 4.0% like for like expansion, generating EUR 8.89 Billion in operating profit for a 20.2% margin. Balanced channel diversification allows L’Oreal to fund heavy clinical research while defending mass shelf share.
L’Oreal is scaling proprietary artificial intelligence diagnostics and computational formulation platforms to widen its commercial moat. In January 2026, L’Oreal announced an initial investment exceeding INR 35 Billion, or USD 383.4 Million, to establish a global Beauty Tech hub in Hyderabad, India, creating 2,000 technology jobs through 2030, according to Reuters and L’Oreal disclosures. Centralizing data engineering lowers digital customer acquisition costs and accelerates personalized active skincare development worldwide.
Unilever PLC
Unilever PLC commands global personal hygiene, hair care, deodorant, and prestige beauty shelves across emerging and developed retail markets through billion euro power brands. According to Unilever 2025 Annual Report filings, continuing group turnover totaled EUR 50.5 Billion, led by EUR 13.2 Billion in Personal Care at 4.7% underlying growth and EUR 12.8 Billion in Beauty and Wellbeing at 4.3% growth. Divesting noncore food assets sharpens capital allocation toward higher margin prestige skin and scalp care.
Unilever is upgrading North American laboratory infrastructure to accelerate biotechnology, fragrance design, and packaging automation. In May 2026, as reported by Unilever official press releases, Unilever committed USD 270 Million inside a USD 300 Million funding package to build an AI powered Global Innovation Centre in New Haven, Connecticut, housing 300 specialists. Co locating robotics formulation labs near US retail partners shortens launch lead times and boosts North American gross margins.
Key Players
- L’Oréal SA
- Unilever PLC
- Procter & Gamble Company
- Beiersdorf AG
- Colgate-Palmolive Company
- The Estée Lauder Companies Inc.
- Shiseido Company, Ltd.
- ITC Limited
- Kenvue Inc.
- Kao Corporation
- Henkel AG & Co. KGaA
- LVMH Moët Hennessy Louis Vuitton SE
- Other Key Players
Recent Developments
2026
- November 2026: Unilever PLC investment committed EUR 35 Million or USD 38.9 Million to upgrade its Mumbai and Bengaluru R&D centers into AI hubs including a EUR 5 Million Bio Futures Partnership according to Global Cosmetics News and Unilever
- October 2026: The Estée Lauder Companies Inc. acquisition completed the buyout of the remaining 51% equity stake in Indian luxury Ayurvedic skincare brand Forest Essentials following its prior 49% holding according to Estée Lauder Official Press Release
- October 2026: The Estée Lauder Companies Inc. investment allocated EUR 5.7 Million for water circularity systems at its Oevel Belgium campus to cut water intensity to 3.6 liters per kilogram and save 25 Million liters annually according to Estée Lauder Official Press Release
- September 2026: L’Oréal SA capacity expansion announced an EGP 240 Million or EUR 4 Million plant upgrade in Cairo Egypt to increase regional haircare, skincare, and hair colorant export output according to Zawya Press Release
- August 2026: Procter & Gamble Company acquisition signed a definitive agreement closed in October 2026 to purchase personalized wellness and supplement maker Thorne for USD 3.8 Billion in cash according to PR Newswire and P&G Release
- July 2026: Coty Inc. and Kering SA agreement executed an early transition returning the Gucci Beauty license to Kering for USD 400 Million in total consideration including USD 250 Million upfront cash according to Coty Investor Relations
- May 2026: ITC Limited acquisition purchased a second equity tranche in Ayurvedic personal care brand Mother Sparsh Baby Care for INR 30 Crore to raise its fully diluted shareholding to 49.32% according to ITC Stock Exchange Filing
- April 2026: Henkel AG & Co. KGaA acquisition completed the purchase of US consumer hair care brand Not Your Mother’s adding EUR 190 Million in annual sales across over 40,000 retail doors according to Henkel Official Press Release
- March 2026: Henkel AG & Co. KGaA acquisition signed a definitive merger agreement completed in July 2026 to acquire 100% of premium hair care brand Olaplex Holdings at USD 2.06 per share for USD 1.4 Billion according to Henkel Official Press Release
- February 2026: L’Oréal SA investment completed the purchase of an additional 10% equity stake in dermatological leader Galderma Group AG to double its total ownership stake to 20% according to L’Oréal Official Press Release
2025
- June 2025: Beiersdorf AG investment began construction on a EUR 139 Million sustainable skincare innovation center spanning 14,000 square meters at its Hamburg campus scheduled for 2028 completion according to Hamburg Business and Beiersdorf
Geopolitical Impact Analysis
Maritime chokepoint detours and tariff frontloading are reshaping cross border logistics for beauty packaging components and finished prestige exports. According to the World Trade Organization, world merchandise trade volume grew 4.6% in 2025 and reaches 3.9% in 2026, while Asia to North America container spot rates hit USD 6,200 to USD 8,000 per forty foot unit by June 2026. Data from UNCTAD shows global goods trade hit USD 13.7 Trillion in first half 2026 as traded goods prices climbed 3.6% in Q1 and 5% in Q2 2026. World Shipping Council found that 1,478 containers were lost at sea among 280 Million shipped in 2025, up from 576 in 2024. Elevated freight surcharges inflate landed costs for Asian airless cosmetic pumps, glass perfume flacons, and mica pigments, forcing beauty brands to near-shore filling plants.
Import tariff escalations and Middle East energy disruptions directly pressure petrochemical cosmetic raw materials and household discretionary budgets. Based on World Bank data, average effective US tariff rates climbed to roughly 17% in late 2025 while energy shocks slow projected 2026 global GDP expansion to 2.5%. International Monetary Fund indicates that global headline inflation reaches 4.7% in 2026 alongside 3.1% global economic output growth. Figures from the International Energy Agency show petrochemical feedstocks account for over 60% of 2026 oil demand growth, up from 40% in 2025, as world oil supply hits 108.6 Million barrels daily. Tariff duties and crude volatility raise procurement prices for petroleum derived polyethylene glycol emulsifiers, synthetic surfactants, and polypropylene jar resins, compelling manufacturers to lock multiyear supplier contracts or pass selective price hikes onto retail buyers.
Report Scope
| Report Features | Description |
|---|---|
| Market Value (2025) | USD 644.7 Billion |
| Forecast Revenue (2035) | USD 1,139.0 Billion |
| CAGR (2026-2035) | 5.9% |
| Base Year for Estimation | 2025 |
| Historic Period | 2021-2025 |
| Forecast Period | 2026-2035 |
| Report Coverage | Revenue Forecast, Market Dynamics, Market Opportunity Analysis, Technology and Innovation Landscape, Competitive Landscape, Recent Developments |
| Segments Covered | By Product (Personal Care Products [Hair Care: Shampoo, Conditioner, Hair Colorant, Hair Styling Products, Others; Skin Care: Facial Care Products, Body Care Products, Lip and Nail Care Products; Bath and Shower: Shower Gels, Soaps, Others; Oral Care: Toothbrush, Toothpaste, Mouthwashes and Rinses, Others], Men’s Grooming Products, Deodorants and Antiperspirants, Perfumes and Fragrances, Cosmetics/Makeup Products [Facial Cosmetics, Eye Cosmetics, Lip and Nail Makeup Products]), By Category (Mass Product, Premium), By Distribution Channel (Specialty Stores, Supermarkets/Hypermarkets, Online Retail Stores, Other Channels) |
| Regional Analysis | North America (US and Canada), Europe (Germany, France, The UK, Spain, Italy, and Rest of Europe), Asia Pacific (China, Japan, South Korea, India, Australia, and Rest of APAC), Latin America (Brazil, Mexico, and Rest of Latin America), Middle East and Africa (GCC, South Africa, and Rest of MEA) |
| Competitive Landscape | L’Oréal SA, Unilever PLC, Procter & Gamble Company, Beiersdorf AG, Colgate-Palmolive Company, The Estée Lauder Companies Inc., Shiseido Company, Ltd., ITC Limited, Kenvue Inc., Kao Corporation, Henkel AG & Co. KGaA, LVMH Moët Hennessy Louis Vuitton SE, Other Key Players |
| Customization Scope | Customization for segments, region / country-level will be provided. Additional customization can be done based on requirements. |
| Purchase Options | We have three licenses to opt for: Single User License | Multi-User License (Up to 5 Users) | Corporate Use License (Unlimited User and Printable PDF) |