


Report Overview
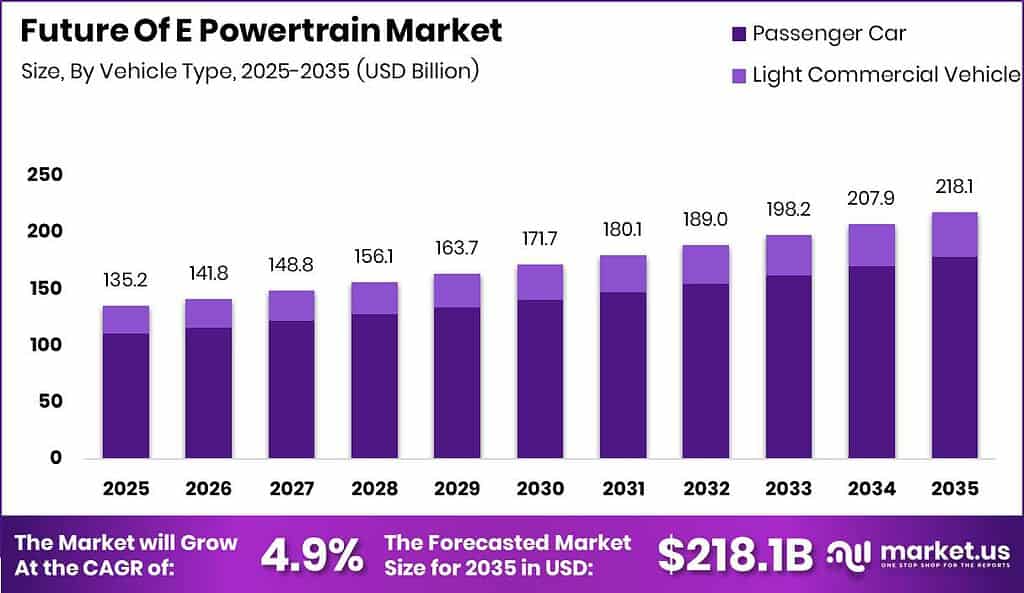
Global Future Of E Powertrain Market size is expected to be worth around USD 218.1 Billion by 2035 from USD 135.2 Billion in 2025, growing at a CAGR of 4.9% during the forecast period 2026 to 2035.
The e-powertrain market covers the full set of electrified propulsion components that replace or supplement internal combustion drivetrains in passenger cars, light commercial vehicles, and adjacent vehicle platforms. Core elements include electric motors, traction inverters, power electronics controllers, battery systems, and transmission units. Suppliers range from vertically integrated Tier-1 automotive specialists to pure-play power-electronics manufacturers serving multiple vehicle platforms across global OEM supply chains.
Key Takeaways
- Market size in 2025: USD 135.2 Billion
- Forecast market size by 2035: USD 218.1 Billion
- CAGR (2026–2035): 4.9%
- Dominant segment by Vehicle Type: Passenger Car with 82.00% share
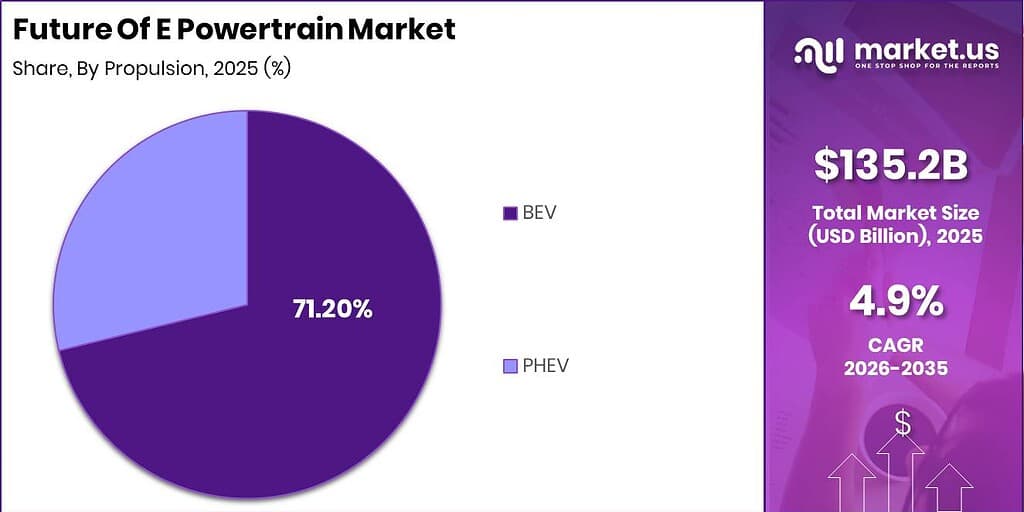
- Dominant segment by Propulsion: BEV with 71.20% share
- Dominant segment by Integration Type: Integrated with 64.00% share
- Dominant segment by Component: Motor with 28.00% share
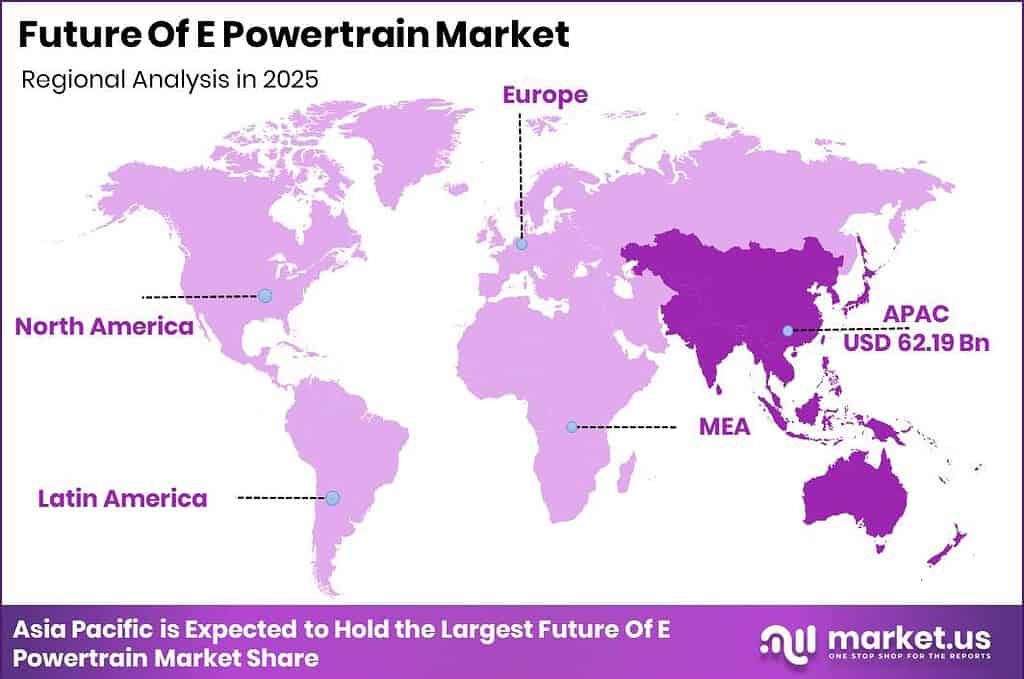
- Dominant region: Asia Pacific with 46.00% share, valued at USD 62.19 Billion
Government policy is the clearest near-term demand signal for this market. India’s PM E-DRIVE program carries a budget of ₹10,900 crore over 4 years from April 2024 through March 2028, directing public capital into electric two-wheeler, three-wheeler, and bus procurement. This scale of committed government spending converts policy intent into contracted hardware demand, giving component suppliers a plannable order pipeline rather than a speculative one.
Emissions regulation is accelerating OEM bill-of-materials decisions in favor of electrified powertrains. According to the ICCT, EU battery-electric cars produce 63 g CO₂e/km on a life-cycle basis, which is 73% lower than the 235 g CO₂e/km estimated for gasoline cars. ICCT data also shows that although BEVs carry roughly 40% higher production emissions than combustion vehicles, those emissions are offset after approximately 17,000 km, typically within the first 1 to 2 years of use. This payback speed eliminates the residual environmental argument against BEV adoption.
Supply chain activity confirms the market’s structural momentum. BorgWarner secured a dual-inverter program with a major Chinese OEM for hybrid vehicles, with mass production scheduled to begin by the end of 2025. This type of multi-platform contract award, covering both BEV and hybrid architectures, signals that Tier-1 suppliers are building volume across propulsion types rather than betting on a single technology. Investors should note that hybrid-compatible component platforms extend the addressable market well beyond the pure-BEV installed base.
Type Analysis
Passenger Car dominates with 82.00% due to highest global BEV registration volumes.
In 2025, Passenger Car held a dominant market position in the By Vehicle Type segment of the Future Of E Powertrain Market, with a 82.00% share. Passenger cars absorb the largest share of e-powertrain production because global BEV and PHEV registration programs target them first through consumer tax incentives and fleet emission targets. The International Energy Agency reported that passenger BEV and PHEV stock surpassed 40 million units globally by end-2023, creating an installed base that drives sustained replacement and upgrade demand. Suppliers serving passenger-car platforms benefit from the highest production-run volumes, which reduce per-unit component cost and improve margin predictability across multi-year OEM contracts.
Light Commercial Vehicles represent the next strategic volume opportunity in this segment. Corporate fleet electrification mandates in Europe and North America are converting diesel van fleets to electric platforms at an accelerating pace. The European Automobile Manufacturers’ Association reported that electric light commercial vehicle registrations in the EU reached over 60,000 units in 2023, up from under 30,000 in 2021. In August 2025, AISIN confirmed its eAxle system had been adopted for Isuzu’s first battery-electric pickup, the D-MAX EV, extending proven passenger-car e-powertrain architecture into light commercial applications and validating the technology transfer path for suppliers.
Propulsion Analysis
BEV dominates with 71.20% due to full electrification removing combustion dependency entirely.
In 2025, BEV held a dominant market position in the By Propulsion segment of the Future Of E Powertrain Market, with a 71.20% share. Battery-electric vehicles require a complete e-powertrain stack, including motor, inverter, controller, and battery system, making every BEV sale a full-value capture event for component suppliers. Global BEV and PHEV deliveries reached approximately 1.218 million units in January 2026 alone, per SNE Research. Even with the 2.1% year-over-year decline recorded in that month, cumulative BEV unit volumes sustained by prior-year base growth make this the highest-revenue propulsion category in the market.
PHEVs form a structurally important secondary category because they require both an electric motor assembly and retention of combustion system interfaces, creating a dual-component supply opportunity per vehicle. In October 2025, AISIN, DENSO, and BluE Nexus confirmed their newly developed eAxle had been adopted for Toyota’s new bZ4X, using a compact motor and inverter architecture optimized for improved power density and efficiency. IEA data shows that PHEV stock has grown consistently alongside BEV adoption, with combined plug-in vehicle registrations across major markets exceeding 14 million units in 2023. Suppliers that design components compatible with both architectures capture a wider platform base without proportionally higher engineering investment.
Integration Type Analysis
Integrated dominates with 64.00% due to consolidated packaging reducing weight and cost per unit.
In 2025, Integrated held a dominant market position in the By Integration Type segment of the Future Of E Powertrain Market, with a 64.00% share. Integrated e-powertrain systems combine the motor, inverter, and gearbox into a single compact assembly, reducing the number of interfaces, sealing surfaces, and wiring harness connections that OEMs must manage. Garrett Motion’s 2025 integrated motor-inverter-gearbox system reduced combined powertrain weight and size by as much as 40% compared with industry reference systems. This reduction directly lowers vehicle unsprung mass and simplifies assembly-line logistics, creating a measurable bill-of-materials cost advantage over non-integrated architectures at scale.
Non-integrated e-powertrain systems serve platforms where modular replacement, serviceability, or phased electrification is a buyer priority over packaging compactness. Commercial vehicle operators, fleet managers, and remanufacturers favor non-integrated designs because individual component replacement costs less than a full-assembly swap. The United States Department of Energy’s alternative fuels data indicates that commercial fleet operators prioritize total cost of ownership over upfront price, making component-level replaceability a direct procurement criterion. Non-integrated systems therefore sustain a durable niche in applications where lifecycle maintenance cost outweighs the assembly-simplicity benefits of full integration.
Component Analysis
Motor dominates with 28.00% due to every EV platform requiring at least one traction motor.
In 2025, Motor held a dominant market position in the By Component segment of the Electric Vehicle Motor Market, with a 28.00% share. Every battery-electric and plug-in hybrid vehicle requires at least one traction motor, making the motor the single highest-volume component in any e-powertrain bill of materials. Bosch reported in 2026 that its performance-oriented electric motor technology increased power density by 50%, reaching up to 16 kW/kg. Higher power density per kilogram translates directly into smaller, lighter motor assemblies for equivalent output, allowing OEMs to redistribute mass savings into battery capacity or structural reinforcement.
The Traction Inverter is the second largest component category and the most technologically active area of the market today. Inverters manage the conversion of DC battery power to AC motor drive, and the shift to silicon carbide devices has fundamentally changed their performance envelope. IEA tracking indicates SiC penetration in new BEV platforms rose from roughly 35% in 2024 to over 55% by 2025, compressing switching losses by approximately 4 to 6 percentage points versus legacy silicon IGBT stacks. Suppliers that have already committed to 200mm SiC wafer capacity will capture disproportionate share of inverter supply as OEMs standardize on 800 V platforms.
Controllers, batteries, transmissions, and other components collectively serve specialized functional roles across thFuture Of E Powertrain stack. The Battery Management System (BMS) and On-Board Charger (OBC) are increasingly integrated into unified power management architectures to reduce software interface complexity. The Electric Vehicle Transmission segment is evolving toward single-speed reduction gearboxes in BEV applications, while PHEV platforms retain multi-ratio units to optimize combustion and electric operating ranges. These components hold smaller individual revenue shares but carry high engineering content per unit, sustaining strong supplier margins relative to their volume contribution.
Key Market Segments
By Vehicle Type
- Passenger Car
- Light Commercial Vehicle
By Propulsion
- BEV
- PHEV
By Integration Type
- Integrated
- Non-Integrated
By Component
- Motor
- Inverter
- Controller
- Battery
- Transmission
- Others
Regional Analysis
Asia Pacific Dominates the Future Of E Powertrain Market with a Market Share of 46.00%, Valued at USD 62.19 Billion
Asia Pacific leads all regions because China, Japan, South Korea, and India collectively host the largest concentration of BEV manufacturing capacity, government purchase mandates, and battery supply chain infrastructure in the world. China’s NEV mandate system, which requires a specified percentage of each OEM’s annual sales to be new-energy vehicles, creates structural volume commitments that Tier-1 component suppliers can plan capacity against. In June 2025, ZF launched its SELECT e-drive platform covering 100 to 300 kW, integrating modular e-machines, power electronics, reduction gears, and control software into a scalable architecture positioned specifically for high-volume Asian OEM adoption. India adds a further demand layer through the PM E-DRIVE program, which directs government procurement budgets toward domestically assembled electric vehicles and their components.
Europe is the fastest-growing region for premium e-powertrain content value, driven by the Euro 7 regulatory framework and OEM investment in high-performance electric platforms. European OEMs are standardizing on 800 V architectures across flagship product lines, which increases average selling price per powertrain unit compared with legacy 400 V systems. As per our research, this architecture upgrade is expanding average inverter and motor revenue per vehicle by an estimated 15 to 20% relative to prior-generation platforms. Suppliers with established European OEM relationships and validated SiC inverter products are best positioned to capture this premiumization trend as it cascades from flagship models into volume segments over the forecast period.
North America, Latin America, and the Middle East and Africa together represent a complementary demand profile anchored in fleet electrification programs and entry-level BEV proliferation. As per our research, North America’s commercial fleet electrification mandates are converting large van and light truck fleets at a pace that creates predictable multi-year component procurement windows. Global BEV and PHEV deliveries reached approximately 1.218 million units in January 2026, reflecting a base that even a 2.1% monthly decline does not meaningfully reverse given compounding annual unit growth in prior years. Emerging markets in MEA and Latin America are entering earlier adoption phases, making them natural targets for lower-cost, standardized e-powertrain architectures as OEMs seek volume outside mature markets.
Key Regions and Countries
North America
- US
- Canada
Europe
- Germany
- France
- The UK
- Spain
- Italy
- Rest of Europe
Asia Pacific
- China
- Japan
- South Korea
- India
- Australia
- Rest of APAC
Latin America
- Brazil
- Mexico
- Rest of Latin America
Middle East and Africa
- GCC
- South Africa
- Rest of MEA
Market Dynamics
Market Opportunity Analysis - India, two-wheeler markets, and 800 V platform gaps offer distinct entry windows for focused suppliers.
India’s emerging BEV passenger car segment remains underpenetrated relative to its policy commitment. The PM E-DRIVE program’s ₹10,900 crore budget runs through March 2028, creating a funded procurement window that most global Tier-1 suppliers have not yet structured local supply chains to serve at scale. Tata’s Punch.ev, using 30 kWh or 40 kWh LFP battery packs with a certified range of 468 km, demonstrates that affordable BEV platforms are already commercially viable in India. Suppliers that localize battery management and motor assembly in India during this window will hold a qualified-supplier advantage before European and Chinese rivals establish production footholds.
The two- and three-wheeler segment in Southeast Asia and Africa remains structurally underserved by large-format e-powertrain suppliers. Honda’s WN7 electric powertrain combines a 9.3 kWh battery with a 50 kW motor producing 100 Nm, delivering a WMTC range of 140 km. This configuration targets urban mobility rather than highway range, defining a technically distinct product category that demands lighter, lower-voltage motor controllers and simpler thermal management than passenger car systems. Suppliers that design scalable powertrain modules for this sub-100 kW power band can address millions of annual unit registrations across markets where four-wheel BEV penetration remains below 5%.
Porsche’s Cayenne Electric uses an 800 V architecture with up to 400 kW DC charging under specified conditions, charging from 10% to 80% in under 16 minutes. This platform standard signals that 800 V infrastructure and compatible powertrain components will define the premium SUV segment benchmark within the forecast period. By contrast, most volume-segment OEMs still operate on 400 V architectures, creating a component gap between what premium platforms require and what mainstream supply chains currently deliver. Suppliers that bridge this gap with cost-optimized 800 V inverter and motor solutions will capture share in the fastest-growing revenue tier of the passenger car segment.
The Tata Punch.ev’s charging specification, adding approximately 135 km of real-world range in 15 minutes, and the Honda WN7’s 20% to 80% charge in approximately 30 minutes via CCS2, illustrate that sub-100 kWh battery platforms across price tiers have already converged on fast-charging as a non-negotiable commercial feature. This creates a durable component opportunity for on-board charger manufacturers and DC-DC converter suppliers serving both premium and economy vehicle categories. Investors should focus on suppliers with dual-platform capability across 400 V and 800 V architectures, as these companies will serve the broadest addressable customer base without requiring separate product development programs for each voltage tier.
Technology and Innovation Landscape - Power density gains, 800 V standardization, and integrated architectures define the new competitive baseline.
Silicon carbide adoption is redefining the inverter segment’s performance floor. A 2025 peer-reviewed study found potential greenhouse gas reductions of about 90% for EVs depending on technology and energy pathway, reinforcing the regulatory rationale for OEMs to invest in higher-efficiency SiC-based powertrains. The ICCT’s 2025 life-cycle assessment estimated that BEV emissions fall to 52 g CO₂e/km when powered exclusively by renewable electricity, 78% below gasoline-car emissions. These figures give OEM engineering teams a quantified carbon argument for specifying SiC inverters, which reduce switching losses and improve range per kilowatt-hour of battery capacity.
High-voltage charging architecture is advancing across multiple OEM programs simultaneously, establishing 800 V as the emerging standard. Porsche’s inductive charging system transfers grid energy to the vehicle battery at up to 90% efficiency, comparable to wired AC charging, while its updated Taycan powertrain charges at up to 320 kW, charging from 10% to 80% in 18 minutes. BMW’s 2025 iX3 specifies a WLTP range of 679 to 805 km and combined electric consumption of 15.1 to 17.9 kWh/100 km. These production specifications set customer expectation baselines that volume OEMs must now match, pulling Power Electronics investment upward across the supplier tier.
ZF’s SELECT electric drive platform reduced powertrain losses by more than 25% at speeds above 100 km/h compared with an existing high-efficiency production system, while its SELECT coaxial primary drive produces 300 kW and 5,500 Nm with continuous output equal to 60% of peak performance. Garrett Motion’s 2025 integrated motor-inverter-gearbox system reduced combined powertrain weight and size by as much as 40% compared with industry reference systems. These efficiency and packaging breakthroughs collectively shift the competitive threshold. Suppliers that cannot match a 25% loss reduction or a 40% packaging advantage will face displacement from next-generation platform sourcing decisions as OEMs revise their supplier scorecards.
Bosch’s E-Axle and motor technology advances are setting new power density standards that cascade through OEM platform architecture choices. Bosch’s 800 V motor produces up to 80 kW more power than a comparable 400 V machine of identical weight, operating across 400 to 850 V to supply up to 188 kW of continuous power. This voltage-range flexibility lets OEMs adopt a single motor supplier across both current and next-generation platform voltages without requalifying a new supplier. The Electric Drive Unit (EDU) market is consolidating around suppliers that can offer this kind of platform-spanning electrical compatibility, rewarding vertical integration and penalizing narrowly specialized product lines.
Drivers
The shift to 800 V architectures and silicon carbide traction inverters is already embedded in OEM bill-of-materials decisions. Per IEA transport electrification tracking, SiC penetration in new BEV platforms rose from roughly 35% in 2024 to over 55% by 2025, compressing switching losses by approximately 4 to 6 percentage points versus legacy silicon IGBT stacks. This efficiency gain allows OEMs to specify smaller battery packs for equivalent range. A 10 to 15% cut in battery-pack kWh requirement can offset the roughly 20% unit-cost premium SiC modules still carry over silicon alternatives.
Euro 7 and NEV mandate compliance is converting regulatory pressure into committed OEM procurement schedules. Automotive-grade SiC substrate lead times still run 12 to 18 months per SEMI industry association capacity assessments, which means suppliers must secure wafer supply well ahead of platform launches. This dynamic compresses OEM powertrain bill-of-materials costs by an estimated 3 to 5% per vehicle while forcing Tier-1 suppliers to accelerate capital expenditure on 200mm SiC wafer fabs. Early movers in SiC capacity will hold a structural supply advantage as regulatory deadlines harden across Europe and China simultaneously.
| Driver | (~) % Impact on CAGR Forecast | Geographic Relevance | Impact Timeline |
|---|---|---|---|
| High-Voltage SiC Inverter Adoption | +1.2% | Global (China, EU, North America) | Short term (2 years or less) |
| Euro 7 and NEV Mandate Compliance | +1.0% | Europe, China | Short term (2 years or less) |
| LFP Battery Cost Deflation | +0.9% | Asia-Pacific, Global | Medium term (2 to 4 years) |
| Commercial Fleet Electrification Mandates | +0.7% | North America, Europe | Medium term (2 to 4 years) |
| Public Fast-Charging Network Buildout | +0.6% | Global | Medium term (2 to 4 years) |
Restraints
Elevated capital costs are the dominant brake on new battery and power-electronics gigafactory buildouts. With the US Federal Reserve holding benchmark policy rates near 4.25 to 4.50% through late 2025, and the European Central Bank’s main refinancing rate near 3.15%, per World Bank lending rate indices the effective cost of project-finance debt for gigafactory-scale investment has risen by 150 to 200 basis points versus 2021 levels. Several announced cell and e-axle assembly projects moved into delay as a result. LG Energy Solution flagged a slower North American joint-venture ramp in its 2025 earnings call, and Panasonic Energy cited financing-driven timeline extensions of 6 to 9 months on expansion phases.
US Section 301 tariffs on Chinese magnets and EU anti-subsidy duties on Chinese BEVs compound the cost-of-capital constraint by adding input-cost and market-access friction simultaneously. Rare-earth export licensing restrictions from China tighten permanent magnet supply for traction motors sold outside Chinese borders. These trade barriers push internal CapEx-approval hurdle rates roughly 2 to 3 percentage points higher than in 2023 per company investor-relations disclosures. Suppliers disclosing gross margin compression of 200 to 300 basis points on new production lines signal that this restraint is already affecting realized profitability, not just pipeline planning.
| Restraint | (~) % Impact on CAGR Forecast | Geographic Relevance | Impact Timeline |
|---|---|---|---|
| Elevated Interest Rates on Gigafactory CapEx | -1.0% | Global | Short term (2 years or less) |
| US Section 301 Tariffs on Chinese Magnets | -0.8% | North America | Short term (2 years or less) |
| EU Anti-Subsidy Duties on Chinese BEVs | -0.7% | Europe | Short term (2 years or less) |
| Rare-Earth Export Licensing Restrictions | -0.6% | Global (China-dependent) | Short term (2 years or less) |
| Cobalt and Nickel Price Volatility Freeze | -0.5% | Global | Short term (2 years or less) |
Challenges
The power-electronics talent shortage is the most persistent structural friction limiting e-powertrain program scale. Per SAE International workforce surveys, the automotive sector faces an estimated shortfall of 15,000 to 20,000 qualified power-electronics and battery-systems engineers globally through 2028. US Bureau of Labor Statistics occupational projections show electrical engineering role growth of roughly 5% annually, outpacing accredited graduate supply by a factor of about 2 to 1. This gap extends average time-to-hire for senior inverter-design roles to 4 to 6 months per onsemi and Infineon 2025 hiring disclosures, directly slowing program execution timelines.
Thermal management at high power density and grid interconnection delays for DC fast-charging create compounding execution risk. As power density rises with SiC adoption, thermal limits become the binding engineering constraint rather than switching performance. Grid interconnection queues for DC fast-charging sites in North America and Europe stretch to 2 to 4 years in some jurisdictions, slowing the charging network buildout that end consumers need to justify BEV adoption. Engineering compensation inflation of an estimated 8 to 12% year-over-year in hubs such as Munich, Detroit, and Shenzhen further compresses the margin available to address these technical challenges at the pace OEM roadmaps require.
| Challenge | (~) % CAGR Friction Drag | Geographic Relevance | Mitigation Horizon |
|---|---|---|---|
| Power-Electronics Talent Deficit | -0.6% | Global | Medium term (2 to 4 years) |
| Thermal Management at High Power Density | -0.5% | Global | Medium term (2 to 4 years) |
| Grid Interconnection Delays for DC Fast-Charging | -0.5% | North America, Europe | Medium term (2 to 4 years) |
| Battery Recycling Logistics Gaps | -0.4% | Global | Long term (4 years or more) |
| Software-Defined Powertrain Integration Complexity | -0.4% | Global | Medium term (2 to 4 years) |
Opportunities
Powertrain-as-a-service and battery leasing represent genuinely uncaptured commercial upside in the e-powertrain market. Fewer than an estimated 8 to 10% of global BEV sales currently use a leasing or subscription model per available OEM sales-mix disclosures. NIO’s 2025 annual filings show that decoupling battery ownership from the vehicle can lower upfront consumer purchase price by roughly 30 to 40%, materially widening the addressable buyer pool. Replicating this model at scale could expand OEM services-attached gross margins by an estimated 300 to 500 basis points versus hardware-only transactions.
Two- and three-wheeler powertrain licensing in Southeast Asia, India, and Africa represents the next high-volume entry point for e-powertrain suppliers seeking platform diversification. India’s PM E-DRIVE program directs incentives specifically toward electric two- and three-wheelers, creating a government-backed demand pool for smaller motor and battery system configurations. Wireless dynamic charging integration in Europe and East Asia adds a long-horizon revenue opportunity, offering an estimated 0.7% CAGR upside according to Market.us modeling. Early movers that commit engineering resources to wireless charging compatibility today will hold a qualified-supplier advantage when OEM platform adoption accelerates beyond 2028.
| Opportunity | (~) % Potential CAGR Upside | Geographic Relevance | Execution Window |
|---|---|---|---|
| Powertrain-as-a-Service and Battery Leasing | +0.9% | Global | Medium term (2 to 4 years) |
| Two- and Three-Wheeler Powertrain Licensing | +0.8% | Southeast Asia, India, Africa | Medium term (2 to 4 years) |
| Wireless Dynamic Charging Integration | +0.7% | Europe, East Asia | Long term (4 years or more) |
| Second-Life Battery Repurposing for Grid Storage | +0.6% | Global | Long term (4 years or more) |
| Off-Highway and Marine Electrification Verticals | +0.5% | North America, Europe | Long term (4 years or more) |
Key Company Insights
Robert Bosch GmbH holds a performance leadership position built on verifiable output data rather than brand positioning alone. Bosch’s 2026 electric motor technology reached a power density of up to 16 kW/kg, a 50% improvement over its prior generation. Its 800 V drive system delivers up to 188 kW of continuous power, approximately 250 Nm continuously, and up to 550 Nm of short-term peak torque. This output range covers a wide OEM platform spectrum, making Bosch a credible single-source supplier across performance and volume vehicle segments simultaneously.
Schaeffler AG is building a volume production position in China that directly addresses the highest-growth geography in the e-powertrain market. In September 2025, Schaeffler began volume production of its high-voltage inverter brick in Tianjin for a leading Chinese automaker’s new EV models. In October 2025, Schaeffler demonstrated a complete electric axle achieving more than 97% efficiency across the 3,000 to 8,000 rpm speed range. This efficiency figure at operating speeds, not just peak conditions, signals that Schaeffler is positioning its system as a benchmark for production-grade drivetrain performance in the world’s largest BEV market.
Key Players
- Robert Bosch GmbH
- Magna International Inc.
- BorgWarner Inc.
- ZF Friedrichshafen AG
- Continental AG
- Denso Corporation
- Hitachi Astemo, Ltd.
- Mitsubishi Electric Corporation
- Dana Incorporated
- Valeo SA
- Nidec Corporation
- Schaeffler AG
- Hyundai Mobis Co., Ltd.
- Tesla, Inc.
- BYD Co., Ltd.
Recent Developments
- February 2026: BorgWarner secured a program with a major North American OEM to supply an 800V integrated drive module and generator module with dual inverter for range-extended electric trucks and large SUVs, with production scheduled to begin in 2029.
- December 2025: ZF won its first customer order for its eRE+ range-extender technology from Leapmotor, with the technology scheduled to enter the Chinese automaker’s D19 premium SUV from 2026.
- April 2025: ZF secured an order for its AxTrax 2 electric axle for commercial vehicles, with the system selected for a new vehicle program as part of ZF’s commercial-vehicle electrification business.
- October 2025: Schaeffler demonstrated a complete electric axle incorporating its heavy-duty electric motor, with the motor achieving more than 97% efficiency across the 3,000 to 8,000 rpm speed range.
- July 2025: BorgWarner secured a new electric-motor contract with a major Chinese OEM for a platform-based motor compatible with both battery-electric and hybrid vehicles.
Geopolitical Impact Analysis
Trade policy friction is adding measurable cost to e-powertrain supply chains in both North America and Europe. According to WTO tariff schedule data, US Section 301 tariffs on Chinese permanent magnets and rare-earth compounds have raised landed costs for neodymium-iron-boron motor magnets by an estimated 25 to 50% depending on compound classification. As reported by the World Bank commodity price monitor, rare-earth oxide prices have exhibited volatility of up to 30% across quarterly intervals since 2023, compounding the tariff cost burden with input-price instability. This combination is forcing North American Tier-1 suppliers to qualify alternative magnet sources in Australia, Canada, and the EU, extending supplier qualification timelines by 12 to 24 months per procurement cycle.
UNCTAD trade and development data indicates that container shipping cost indices for Asia-to-Europe routes remained elevated at roughly 2 to 3 times pre-2020 baseline levels through mid-2025, directly inflating logistics costs for e-powertrain components shipped from Chinese and South Korean battery and motor factories to European assembly plants. Data from the IEA energy security report shows that energy price volatility in Europe, with wholesale electricity prices peaking above 200 EUR/MWh in stress periods during 2023 and 2024, raised manufacturing operating costs at European e-powertrain assembly facilities. These twin pressures on input logistics and production energy costs have accelerated OEM decisions to regionalize supply chains, creating a structural reshaping of where e-powertrain components are manufactured rather than merely traded.
Report Scope
| Report Features | Description |
|---|---|
| Market Value (2025) | USD 135.2 Billion |
| Forecast Revenue (2035) | USD 218.1 Billion |
| CAGR (2026-2035) | 4.9% |
| Base Year for Estimation | 2025 |
| Historic Period | 2020-2024 |
| Forecast Period | 2026-2035 |
| Report Coverage | Revenue Forecast, Market Dynamics, Market Opportunity Analysis, Technology and Innovation Landscape, Competitive Landscape, Recent Developments |
| Segments Covered | By Vehicle Type (Passenger Car, Light Commercial Vehicle), By Propulsion (BEV, PHEV), By Integration Type (Integrated, Non-Integrated), By Component (Motor, Inverter, Controller, Battery, Transmission, Others) |
| Regional Analysis | North America (US and Canada), Europe (Germany, France, The UK, Spain, Italy, and Rest of Europe), Asia Pacific (China, Japan, South Korea, India, Australia, and Rest of APAC), Latin America (Brazil, Mexico, and Rest of Latin America), Middle East and Africa (GCC, South Africa, and Rest of MEA) |
| Competitive Landscape | Robert Bosch GmbH, Magna International Inc., BorgWarner Inc., ZF Friedrichshafen AG, Continental AG, Denso Corporation, Hitachi Astemo Ltd., Mitsubishi Electric Corporation, Dana Incorporated, Valeo SA, Nidec Corporation, Schaeffler AG, Hyundai Mobis Co. Ltd., Tesla Inc., BYD Co. Ltd. |
| Customization Scope | Customization for segments, region / country-level will be provided. Additional customization can be done based on requirements. |
| Purchase Options | We have three licenses to opt for: Single User License | Multi-User License (Up to 5 Users) | Corporate Use License (Unlimited User and Printable PDF) |





































