


Report Overview
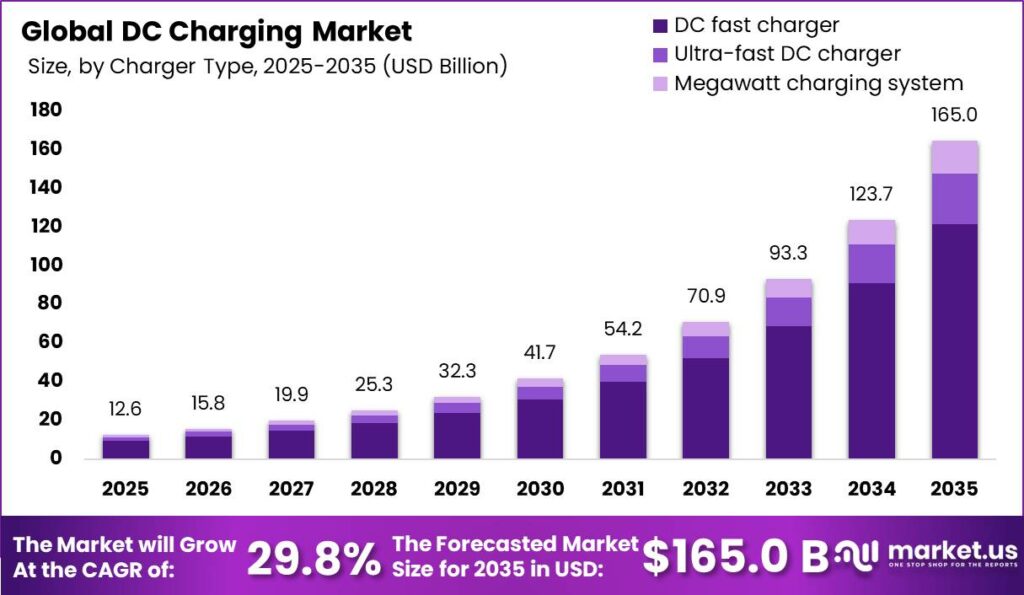
Global DC Charging Market size is expected to be worth around USD 165.00 Billion by 2035 from USD 12.60 Billion in 2025, growing at a CAGR of 29.8% during the forecast period 2026 to 2035. This scale reflects a shift from pilot deployments toward corridor-grade infrastructure. Investors gain a long runway, yet capital must target high-utilization sites to convert volume into durable returns.
The DC Charging Market covers direct-current fast-charging hardware, power cabinets, dispensers, and the software that manages them. Therefore, buyers evaluate systems by power output, installation type, and charging point rather than price alone. EV Charging Station deployments now anchor site economics, since higher power ratings raise throughput per bay. Vendors that bundle hardware with service contracts hold stronger positions against pure hardware sellers.
Key Takeaways
- Global DC Charging Market size reached USD 12.60 Billion in 2025 and is projected to hit USD 165.00 Billion by 2035 at a CAGR of 29.8%.
- DC fast charger led the By Charger Type segment with a 73.70% share.
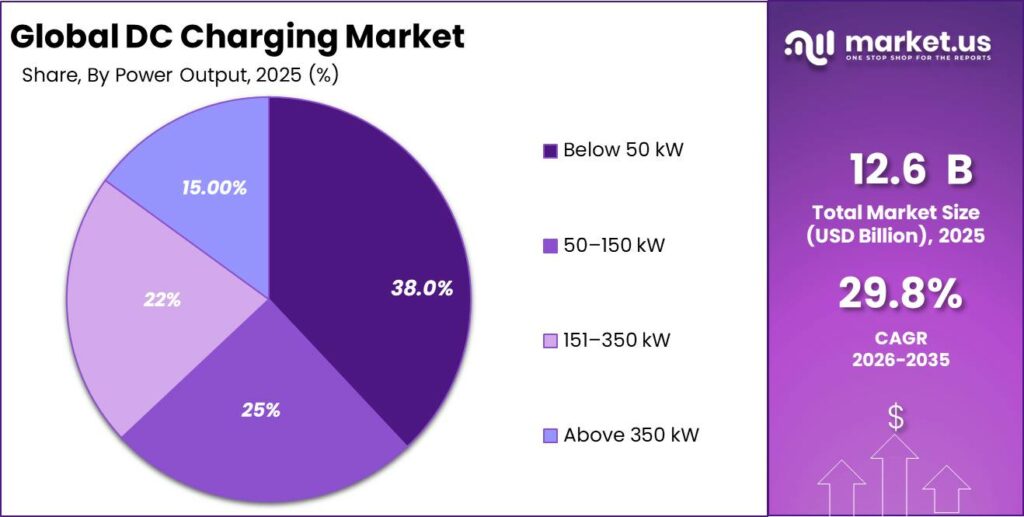
- Below 50 kW held the largest By Power Output share at 38.00%.
- Fixed installations dominated the By Installation Type segment with 92.00%.
- Private charging accounted for 85.00% of the By Charging Point segment.
- Passenger cars captured 68.00% of the By Vehicle Type segment.
- Charge-point operators led the By End User segment with 38.00%.
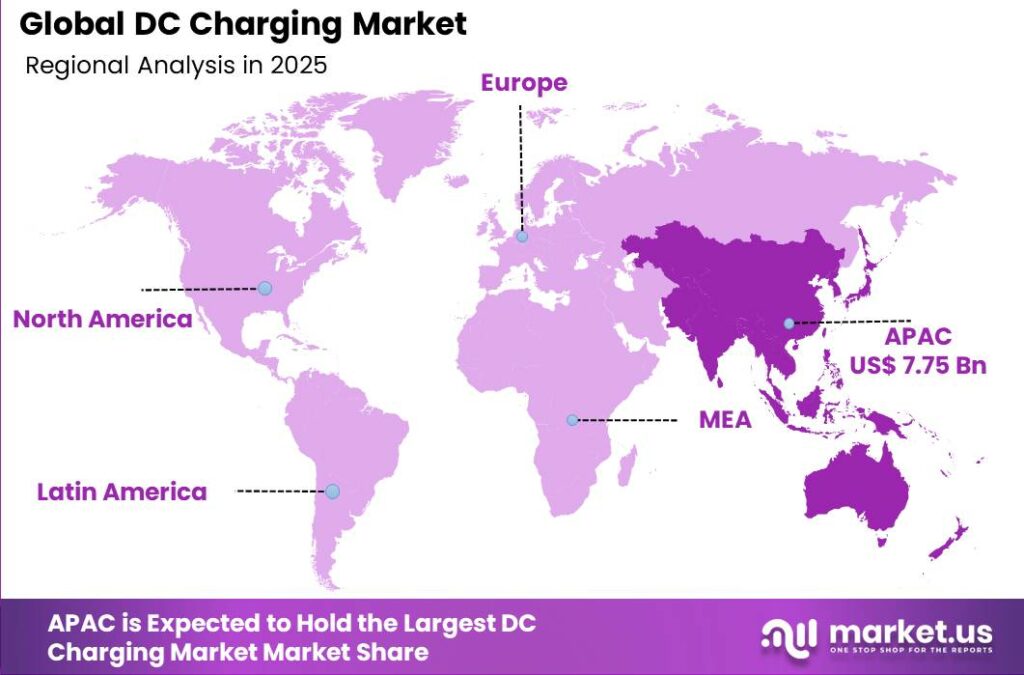
- Asia-Pacific dominated with a 61.60% share, valued at USD 7.75 Billion.
Government policy now shapes deployment pace as much as vehicle demand. California requires publicly funded chargers installed from 2024 onward to maintain at least 97% uptime and retain reporting data for 6 years. This means operators must fund diagnostics and spare parts upfront. As a result, service-capable vendors win public tenders that reliability-weak rivals cannot.
Infrastructure buildout accelerated sharply across 2025. The IEA reported that global public charging added almost 1.8 million points during 2025, lifting the installed total above 7 million points, with capacity averaging 4.5 kW per electric light-duty vehicle. Rising vehicle counts pull demand toward higher-power DC hardware. Consequently, suppliers scaling modular power cabinets capture the fastest reorder cycles.
Charger Type Analysis
DC fast charger dominates with 73.70% due to rapid high-power roadside charging demand.
In 2025, DC fast charger held a dominant market position in the By Charger Type segment of DC Charging Market, with a 73.70% share. Tesla’s 2026 V4 Supercharger supports a 500 kW peak output per post, while an eight-post site needs under 1 MW to meet vehicle-requested power in 99% of conditions. This efficiency lowers site power costs. Therefore, operators favor high-density DC deployments that maximize throughput per grid connection.
Ultra-fast DC chargers serve drivers who need short dwell times at highway and retail sites. These units push power well above standard fast chargers, cutting stop duration for long-distance travel. Higher power raises hardware and cooling costs per bay. This creates a premium tier where operators charge time-based rates to recover investment and protect margins on high-traffic corridors.
Megawatt charging systems target heavy freight where batteries are large and downtime is costly. CharIN’s technical framework supports architectures reaching as much as 3.75 MW per connector, far beyond the 350 kW passenger tier. This scale suits depots and freight corridors. Consequently, suppliers building megawatt-ready cabinets position early for fleet contracts before standards fully mature.
Power Output Analysis
Below 50 kW dominates with 38.00% due to lower-cost widespread urban charging deployment.
In 2025, Below 50 kW held a dominant market position in the By Power Output segment of DC Charging Market, with a 38.00% share. Electrify America offered two principal higher classes in 2025 to 2026, a 150 kW Ultra-Fast tier and a 350 kW Hyper-Fast tier, with supported vehicles completing a stop in as little as 30 minutes. Lower-power units cost less to install. Therefore, operators use them to widen urban coverage affordably.
The 50 to 150 kW band serves mixed urban and suburban sites that balance cost and speed. These chargers fit fleets and retail lots where vehicles park for moderate periods. Moderate power keeps grid demand manageable at smaller sites. This makes the band attractive for property owners adding charging without major electrical upgrades or heavy demand charges.
The 151 to 350 kW band supports highway corridors and premium passenger vehicles that accept fast rates. Higher output shortens stops and raises station throughput during peak travel. Above 350 kW ranks as the fastest growing tier, driven by heavy vehicles and next-generation cars. This means investors targeting corridor and fleet sites should prioritize the two highest bands together.
Installation Type Analysis
Fixed dominates with 92.00% due to permanent high-power grid-connected site requirements.
In 2025, Fixed installations held a dominant market position in the By Installation Type segment of DC Charging Market, with a 92.00% share. Annual extended warranties for individual DC fast chargers can exceed $800 per charger per year, excluding electricity, networking, and repair costs. Fixed units justify this spend through steady utilization. Therefore, operators concentrate capital on permanent sites that generate predictable throughput revenue.
Portable DC chargers rank as the fastest growing installation type because they add flexibility without permanent grid work. Fleets and event operators deploy them where fixed capacity is unavailable or temporary. Mobility avoids lengthy interconnection queues. This creates a niche for suppliers offering battery-integrated portable units that serve gaps until fixed infrastructure catches up with demand.
Charging Point Analysis
Private charging dominates with 85.00% due to depot and home-based reliable access.
In 2025, Private charging held a dominant market position in the By Charging Point segment of DC Charging Market, with an 85.00% share. Tesla’s network can deliver as much as 200 miles of range in 15 minutes, with charging above 80% state of charge rarely necessary for typical stops. Private sites offer controlled reliability. Therefore, fleets favor depot charging to guarantee vehicle readiness.
Public charging ranks as the fastest growing point type because open-access demand rises with vehicle adoption. Operators manage congestion with time-based fees to keep bays available. Tesla’s UK policy in 2025 to 2026 applies once a vehicle reaches at least 80% charge, allows a 5-minute grace period, then charges up to £0.50 per minute. This means public operators can monetize dwell time while improving turnover.
Vehicle Type Analysis
Passenger cars dominate with 68.00% due to high consumer EV adoption volumes.
In 2025, Passenger cars held a dominant market position in the By Vehicle Type segment of DC Charging Market, with a 68.00% share. Electrify America-supported fleet infrastructure at Rialto and the Port of Long Beach comprised 44 chargers, including 14 Hyper-Fast DC chargers rated up to 350 kW in the first phase. Passenger volume anchors network economics. Therefore, operators size sites around consumer traffic first.
Light commercial vehicles use DC charging for last-mile and delivery routes that return to central depots. Predictable routes let operators plan charging windows around shift schedules. This regularity supports depot-based fixed installations. Consequently, suppliers targeting delivery fleets can offer bundled depot solutions that match daily route energy needs closely.
Heavy commercial vehicles rank as the fastest growing vehicle type because freight electrification demands megawatt-scale power. Large batteries require high output to keep transit schedules intact. Others, including buses and specialty vehicles, hold the remaining share collectively. This means megawatt-ready suppliers gain first-mover advantage as freight corridors electrify across the forecast window.
End User Analysis
Charge-point operators dominate with 38.00% due to network ownership and utilization control.
In 2025, Charge-point operators held a dominant market position in the By End User segment of DC Charging Market, with a 38.00% share. California requires utilities to connect 90% of EV-charging service requests within 125 business days and 100% within 160 business days. Faster energization shortens payback timelines. Therefore, operators expand aggressively where connection standards are enforced.
Fleet operators buy charging to keep commercial vehicles on schedule at predictable cost. Depot ownership lets them optimize charging around electricity tariffs and route timing. Government and municipalities fund public access to meet policy targets. This creates steady tender demand, so suppliers with compliance-ready hardware secure recurring public contracts across multiple jurisdictions.
Commercial establishments add charging to attract customers and extend site dwell time. Automotive OEMs deploy branded networks to support vehicle sales and driver confidence. Utilities rank as the fastest growing end user, since grid operators increasingly own charging to manage load and offer flexibility services. This means suppliers should tailor offerings to utility-scale integration needs.
Key Market Segments
By Charger Type
- DC fast charger
- Ultra-fast DC charger
- Megawatt charging system
By Power Output
- Below 50 kW
- 50 to 150 kW
- 151 to 350 kW
- Above 350 kW
By Installation Type
- Fixed
- Portable
By Charging Point
- Private charging
- Public charging
By Vehicle Type
- Passenger cars
- Light commercial vehicles
- Heavy commercial vehicles
- Others
By End User
- Charge-point operators
- Fleet operators
- Government and municipalities
- Commercial establishments
- Automotive OEMs
- Utilities
Regional Analysis
Asia-Pacific Dominates the DC Charging Market with a Market Share of 61.60%, Valued at USD 7.75 Billion
Asia-Pacific led the DC Charging Market in 2025 with a 61.60% share, valued at USD 7.75 Billion. This region combines large domestic EV production with dense urban charging demand. High vehicle volumes let operators reach utilization thresholds faster than elsewhere. As a result, suppliers achieve stronger reorder cycles and scale economies that reinforce Asia-Pacific’s lead across the forecast period.
Emerging-market highway corridors across India and Southeast Asia represent the fastest growing regional opportunity. Rising vehicle sales pull DC demand toward new intercity routes with limited existing coverage. Siemens launched the SICHARGE FLEX distributed DC-charging system in October 2025 for fleet, depot, and megawatt-scale applications, with commercial availability scheduled for 2026. This means suppliers with flexible architectures can capture greenfield corridor demand early.
Key Regions and Countries
North America
- US
- Canada
Europe
- Germany
- France
- The UK
- Spain
- Italy
- Rest of Europe
Asia Pacific
- China
- Japan
- South Korea
- India
- Australia
- Rest of APAC
Latin America
- Brazil
- Mexico
- Rest of Latin America
Middle East and Africa
- GCC
- South Africa
- Rest of MEA
Market Dynamics
Market Opportunity Analysis - Underserved power tiers, freight vehicles, and emerging corridors open entry points for new players
Heavy commercial vehicles remain underexploited within the By Vehicle Type segment, where passenger cars still hold 68.00%. Freight electrification demands megawatt power that most current networks lack. This gap favors suppliers building high-output cabinets ahead of demand. Therefore, new entrants targeting depots and freight corridors can secure fleet contracts before incumbents fully pivot to heavy-duty charging systems.
Public charging is underexploited relative to private charging’s 85.00% share within the By Charging Point segment. Rising vehicle adoption pushes open-access demand faster than private installations. This creates room for operators that manage congestion and uptime well. Consequently, entrants offering reliable, well-utilized public sites can capture share as urban and highway traffic grows across the forecast window.
The Above 350 kW tier stays underexploited despite ranking as the fastest growing power band, while Below 50 kW holds 38.00%. High-output demand concentrates on corridors and premium vehicles. This means suppliers positioning early in ultra-high-power hardware avoid crowded low-power competition. Instead, they serve throughput-hungry sites where fewer rivals currently compete, protecting margins during scale-up.
Emerging-market highway corridors remain underexploited within Asia-Pacific’s 61.60% regional lead, which concentrates in mature urban hubs. India and Southeast Asia offer greenfield intercity routes with thin coverage. This white space rewards flexible, distributed architectures. Therefore, investors entering these corridors early can establish position before dense competition arrives, converting first-mover coverage into durable regional advantage.
Technology and Innovation Landscape - High-power architectures, megawatt standards, and reliability services redefine competitive edges
Ultra-high-power charging architecture now anchors competitive differentiation. ChargePoint and Eaton launched the Express Grid architecture in August 2025, supporting up to 600 kW for passenger vehicles and megawatt-level charging for heavy-duty fleets. Higher output raises throughput per bay and shortens driver stops. Therefore, manufacturers that master high-power thermal and power-electronics design capture premium corridor and fleet demand ahead of slower rivals.
Megawatt charging systems represent the frontier for freight electrification. ABB E-mobility launched the MCS1200 Megawatt Charging System in April 2025 for heavy-duty and depot applications. This hardware targets large truck batteries that conventional 350 kW units cannot serve efficiently. Consequently, suppliers investing in megawatt-ready cabinets position early for freight contracts as standards and vehicle volumes mature toward repeatable deployment.
Reliability-focused service technology is emerging as a durable revenue layer. ChargePoint launched Safeguard Care in July 2025, an end-to-end reliability service using trained providers to inspect and repair stations across six initial markets. This addresses the uptime gap that erodes utilization. Therefore, vendors bundling diagnostics and maintenance with hardware protect customer retention and build recurring service income beyond one-time equipment sales.
Distributed charging architecture adds deployment flexibility for complex sites. Siemens launched the SICHARGE FLEX distributed DC-charging system in October 2025 for fleet, depot, logistics, and megawatt-scale applications, with availability scheduled for 2026. Distributed power sharing lets operators scale output across bays efficiently. Consequently, buyers gain modular sites that adapt to varied vehicle mixes without oversizing every individual charging point.
Drivers
Accelerating EV deployment is shifting DC charging from discretionary amenity spending toward utilization-led infrastructure procurement. The IEA reported that public charging points doubled between 2022 and 2024 to exceed 5 million, while electric-truck sales rose nearly 80% during 2024. This means charger deployment now links to national fleet targets rather than isolated property decisions. Therefore, suppliers see shorter equipment sales cycles and rising demand for modular power cabinets.
European Commission rules established corridor requirements beginning in 2025, including at least 150 kW light-duty output at intervals up to 60 km. The U.S. Department of Transportation requires at least 4 networked DC ports delivering 150 kW each at funded corridor sites. These mandates favor multiyear service contracts and support an estimated 3.8 percentage-point contribution to the 29.8% CAGR. As a result, operators must monetize throughput and software, not hardware margins alone.
| Driver | (~) % Impact on CAGR Forecast | Geographic Relevance | Impact Timeline |
|---|---|---|---|
| Rapid EV Fleet Expansion | +3.8% | Global, led by China, Europe, and North America | Short term (2 years or less) |
| Binding Corridor Deployment Mandates | +3.1% | European Union and United States | Short term (2 years or less) |
| Fleet Depot Electrification | +2.4% | China, Europe, North America, and selected Asian markets | Medium term (2 to 4 years) |
| Higher Vehicle Charging Rates | +1.8% | Global automotive hubs | Medium term (2 to 4 years) |
| Retail-Site Charging Investment | +1.3% | North America, Europe, China, and developed Asia-Pacific | Short term (2 years or less) |
| Public-Private Capital Programs | +1.0% | United States, Europe, India, and selected emerging economies | Medium term (2 to 4 years) |
Restraints
DC sites concentrate large loads at distribution nodes not designed for transport electrification, turning utility approval into an immediate hard stop on equipment sales. The IEA indicates advanced EV-charging projects can wait in connection queues for 1 to 2 years, while lead times for cables and large transformers nearly doubled from 2021 levels. Eurelectric reported more than 450,000 European renewable-connection requests during 2024, up 133% from 2021. This means charger inventory strands while sites await power.
For a site needing 4 ports at 150 kW each, coincident load can reach 600 kW before auxiliary demand, and truck sites can require several megawatts. Consequently, delayed energization extends developer payback, raises carrying costs, and creates an estimated 3.5 percentage-point deduction from the 29.8% CAGR. Therefore, operators must secure grid capacity before ordering hardware to protect project returns.
| Restraint | (~) % Impact on CAGR Forecast | Geographic Relevance | Impact Timeline |
|---|---|---|---|
| Grid-Connection Capacity Constraints | -3.5% | Global, especially Europe, North America, and dense Asian cities | Short term (2 years or less) |
| Weak Low-Utilization Economics | -2.7% | North America, Europe, and emerging EV markets | Short term (2 years or less) |
| High Site-Development Capital Intensity | -2.1% | Global | Medium term (2 to 4 years) |
| Elevated Financing Costs | -1.5% | Emerging economies and leveraged charging operators | Short term (2 years or less) |
| Permitting and Land-Access Barriers | -1.2% | Urban Europe, North America, India, and developed Asia-Pacific | Medium term (2 to 4 years) |
| Inconsistent Public-Incentive Execution | -0.8% | Federal and multi-jurisdictional markets | Short term (2 years or less) |
Challenges
Reliability remains a structural operating vulnerability because a DC charger combines power electronics, cooling, communications, payment, and software in one revenue-critical system. The U.S. Department of Transportation sets an annual port-uptime threshold above 97%, equal to under roughly 263 unavailable hours yearly, yet field tracking placed measured reliability near 85.5% in December 2024. This gap exposes operators to lost throughput and churn.
Closing a gap of more than 11 percentage points between observed and policy-grade availability requires remote diagnostics, spare modules, and enforceable service-level agreements. These measures raise operating expenditure but protect utilization and warranty reserves. Consequently, this leaves an estimated 2.6 percentage-point friction drag on the attainable CAGR until fleetwide uptime stabilizes. Therefore, service-capable suppliers gain a durable edge over hardware-only rivals.
| Challenge | (~) % CAGR Friction Drag | Geographic Relevance | Mitigation Horizon |
|---|---|---|---|
| Charger Reliability and Uptime | -2.6% | Global public-charging networks | Medium term (2 to 4 years) |
| Connector Migration Complexity | -2.0% | North America, Europe, and export-oriented Asian suppliers | Medium term (2 to 4 years) |
| Skilled Technician Availability | -1.6% | North America, Europe, India, and Southeast Asia | Long term (4 years or more) |
| Demand-Charge Cost Exposure | -1.4% | Utility territories with capacity-based tariffs | Medium term (2 to 4 years) |
| Cybersecurity and Payment Integration | -1.1% | Europe and North America | Long term (4 years or more) |
| Thermal Management at Scale | -0.9% | Hot climates and high-power fleet hubs | Long term (4 years or more) |
Opportunities
Megawatt truck charging is future white space because standards, vehicle volumes, and interconnections were still moving from demonstration toward repeatable deployment by 2026. CharIN supports Megawatt Charging System architecture, and IEC released the first connector specification edition in February 2026, creating a path toward 3.75 MW per connector. ICCT modelling suggests the EU could need roughly 4,000 to 5,300 megawatt chargers by 2030. This means early movers can lock in freight-corridor demand.
Relative to a 350 kW dispenser, a 1 MW unit can deliver nearly 2.9 times the power and raise energy throughput per bay. Standardized cabinet sharing and premium tariffs could improve charger-level gross margins by an estimated 5 to 10% and cut delivered cost per kilowatt by about 10 to 15% at scaled hubs. Therefore, capturing freight demand could add about 2.9 percentage points above the 29.8% CAGR.
| Opportunity | (~) % Potential CAGR Upside | Geographic Relevance | Execution Window |
|---|---|---|---|
| Megawatt Truck-Charging Networks | +2.9% | Europe, China, and North American freight corridors | Medium term (2 to 4 years) |
| Battery-Buffered Fast-Charging Sites | +2.2% | Grid-constrained urban and highway locations | Medium term (2 to 4 years) |
| Energy and Flexibility Services | +1.7% | Europe, North America, Australia, and developed Asia-Pacific | Long term (4 years or more) |
| Emerging-Market Highway Corridors | +1.4% | India, Southeast Asia, Latin America, Middle East, and Africa | Long term (4 years or more) |
| Charging-as-a-Service Platforms | +1.1% | Global commercial fleets and property portfolios | Medium term (2 to 4 years) |
| Second-Life Battery Integration | +0.7% | China, Europe, and mature battery-recycling ecosystems | Long term (4 years or more) |
Key Company Insights
ABB E-mobility holds a structural advantage through a broad DC portfolio spanning roadside, heavy-duty, and depot use. In April 2025, the company launched the A200/300 All-in-One chargers, the MCS1200 Megawatt Charging System, and the ChargeDock Dispenser. This range lets ABB serve passenger and freight buyers from one supplier. Therefore, its breadth creates cross-selling leverage that narrower competitors struggle to match across segments.
Tesla leverages network scale and utilization strength to defend its lead. EVgo’s benchmark showed a 24% utilization rate in Q1 2025, while Tesla’s own high-traffic sites sustain strong throughput per post. Dense, reliable coverage builds driver loyalty that rivals cannot quickly replicate. However, opening its network to other vehicles adds congestion risk. This means Tesla must balance access revenue against its captive-customer experience.
Key Players
- ABB E-mobility
- Tesla, Inc.
- Siemens AG
- ChargePoint Holdings, Inc.
- BYD Company Limited
- Delta Electronics, Inc.
- Schneider Electric SE
- Kempower Oyj
- EVBox Group
- Eaton Corporation plc
- Star Charge
- TELD New Energy Co., Ltd.
- Tritium DCFC Limited
- Wallbox N.V.
- Alfen N.V.
Recent Developments
- January 2025: ChargePoint launched ChargePoint Protect and introduced the charging industry’s first licensable cut-resistant cable technology to reduce cable theft and vandalism at EV charging stations.
- February 2025: Kempower launched a 0% financing program for purchases of its DC fast-charging systems across eight European and Australian markets, running from February 19 to May 19, 2025.
- July 2025: ChargePoint launched Safeguard Care, an end-to-end charger reliability service using trained providers to inspect and repair charging stations across six initial markets.
- August 2025: ChargePoint and Eaton launched the Express Grid ultrafast DC-charging architecture, supporting up to 600 kW for passenger vehicles and megawatt-level charging for heavy-duty fleets.
Geopolitical Impact Analysis
Global trade tensions directly raise DC charger costs through tariffs on power electronics and semiconductors. As reported by the WTO, world merchandise trade growth slowed to about 2.7% in 2025 amid rising tariff barriers, while UNCTAD noted freight-rate volatility exceeding 30% on key container routes. These pressures lift landed costs for imported cabinets and connectors. Therefore, suppliers increasingly localize assembly to shield charger pricing from cross-border disruption.
Supply-chain rerouting extends lead times for transformers and cables central to DC deployment. The IEA reported that delivery times for large power transformers nearly doubled versus 2021, while shipping diversions around chokepoints added roughly 10 to 14 days of transit on affected lanes. Longer waits strand project capital and delay energization. Consequently, operators secure critical components earlier and diversify suppliers to protect deployment schedules and returns.
Report Scope
| Report Features | Description |
|---|---|
| Market Value (2025) | USD 12.60 Billion |
| Forecast Revenue (2035) | USD 165.00 Billion |
| CAGR (2026-2035) | 29.8% |
| Base Year for Estimation | 2025 |
| Historic Period | 2020-2024 |
| Forecast Period | 2026-2035 |
| Report Coverage | Revenue Forecast, Market Dynamics, Market Opportunity Analysis, Technology and Innovation Landscape, Competitive Landscape, Recent Developments |
| Segments Covered | By Charger Type (DC fast charger, Ultra-fast DC charger, Megawatt charging system), By Power Output (Below 50 kW, 50 to 150 kW, 151 to 350 kW, Above 350 kW), By Installation Type (Fixed, Portable), By Charging Point (Private charging, Public charging), By Vehicle Type (Passenger cars, Light commercial vehicles, Heavy commercial vehicles, Others), By End User (Charge-point operators, Fleet operators, Government and municipalities, Commercial establishments, Automotive OEMs, Utilities) |
| Regional Analysis | North America (US and Canada), Europe (Germany, France, The UK, Spain, Italy, and Rest of Europe), Asia Pacific (China, Japan, South Korea, India, Australia, and Rest of APAC), Latin America (Brazil, Mexico, and Rest of Latin America), Middle East and Africa (GCC, South Africa, and Rest of MEA) |
| Competitive Landscape | ABB E-mobility, Tesla Inc., Siemens AG, ChargePoint Holdings Inc., BYD Company Limited, Delta Electronics Inc., Schneider Electric SE, Kempower Oyj, EVBox Group, Eaton Corporation plc, Star Charge, TELD New Energy Co. Ltd., Tritium DCFC Limited, Wallbox N.V., Alfen N.V. |
| Customization Scope | Customization for segments, region / country-level will be provided. Additional customization can be done based on requirements. |
| Purchase Options | We have three licenses to opt for: Single User License | Multi-User License (Up to 5 Users) | Corporate Use License (Unlimited User and Printable PDF) |





































