
Quick Navigation
The Global Free Space Optics Market size is expected to be worth around USD 4,270 Million by 2032, from USD 462.2 Million in 2022, growing at a CAGR of 24.9% during the forecast period from 2022 to 2032.
Market.us announces the publication of its most recently generated research report titled, “Global Free Space Optics Market by Range Type (Short Distance, Long Distance, Mid Distance), By Application (Defense & Security, Healthcare, Communications, Transportation, Other Application), and by Region – Global Forecast to 2032.”, which offers a holistic view of the global free space optics market through systematic segmentation that covers every aspect of the target market.
Free Space Optics is an optical communication technology in which data is transmitted by the circulation of light in free space allowing optical connectivity. FSO (Free Space Optics) acts as a medium between transceivers. Line of sight (LOS) is necessary for the successful transmission of optical signals through the air, outer space, or vacuum.
The FSO technology has been around since the 8th century; now it is more evolved. FSO is LOS technology, where voice, video, and data communication is achieved with maximum 10Gbps of data by bidirectional connectivity. FSO uses optical signals as the carrier frequencies to deliver point-to-point transmission of communication information through the atmosphere.
$ XXMn
24.9%
- By Type
- By Region
- By Application
$ XXMn
Global Free Space Optics Market Scope
Rising demand for fast and flexible wireless communication technology- increasing demand for fast and flexible wireless communication technology in various areas such as defense and other commercial areas such as telecommunication is expected to be the major driving factor for the free-space optics market. Furthermore, low power usage per transmitted bit is likely to aid the growth of the target market.
However, technological challenges such as the requirement of the obstruction-free line of sight for transmission of optics communication between two points are likely to dampen the demand for FOS. Nonetheless, the integration of technologies to improve FSO system performance and incorporation in 3G,4G, and 5G networks is likely to create lucrative opportunities for free-space optics market growth in the future.
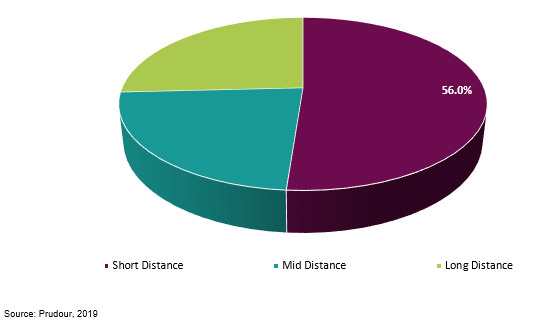
The global free space optics market is segmented on the basis of Range Type, application, and region. On the basis of Range Type, the market is segmented into the short distance, long-distance, and mid-distance.
The short distance segment accounts for the majority share and is expected to register the highest growth over the forecast period. On the basis of application, the market is segmented into defense & security, healthcare, communications, transportation, and other application. The defense & security segment accounts for a majority share in the global free space optics market.
Global Free Space Optics Market by Range Type, 2018
Key Market Segments
Type
- Short Distance (Less Than 500m)
- Mid Distance (500m-1500m)
- Long Distance (Greater Than 1500m)
Application
- Defense and Security
- Healthcare
- Communications
- Transportation
- Other
Regional Analysis
On the basis of region, the market is segmented into North America, Europe, APAC, South America, and Middle East Africa. North America accounts for the majority share in the global Free Space Optics market, followed by Europe. The presence of established research centers in Eastern Europe and Western Europe is aiding the growth of the free space optics market in this region.
APAC is expected to register the highest growth rate over the forecast period owing to increasing investment by the government. Regions such as Europe, South America, and MEA are expected to register stable growth over the forecast period.
Key Market Players
The research report on the global Free Space Optics market includes profiles of some of the major companies such as Trimble Inc., Anova Technologies, Inc., Anova Technologies, and Stryker Corporation.
- Trimble Inc.
- Anova Technologies
- Stryker Corporation
For the Free Space Optics Market research study, the following years have been considered to estimate the market size:
| Attribute | Report Details |
|---|---|
Market Size in 2022 |
USD 462.2 Mn |
Growth Rate |
24.9% |
Forecast Value in 2032 |
USD 4,270 Mn |
Historical Years |
2016-2020 |
Base Year |
2021 |
Estimated Year |
2022 |
Short Term Projection Year |
2028 |
Projected Year |
2023 |
Long Term Projection Year |
2032 |
Report Coverage |
Competitive Landscape, Revenue analysis, Company Share Analysis, Manufacturers Analysis, Volume by Manufacturers, Key Segments, Key company analysis, Market Trends, Distribution Channel, Market Dynamics, COVID-19 Impact Analysis, strategy for existing players to grab maximum market share, and more. |
Regional Scope |
North America, Europe, Asia-Pacific, South America, Middle East & Africa |
Country Scope |
United States, Canada and Mexico, Germany, France, UK, Russia and Italy, China, Japan, Korea, India and Southeast Asia, Brazil, Argentina, Colombia etc.Saudi Arabia, UAE, Egypt, Nigeria and South Africa |


