


Report Overview
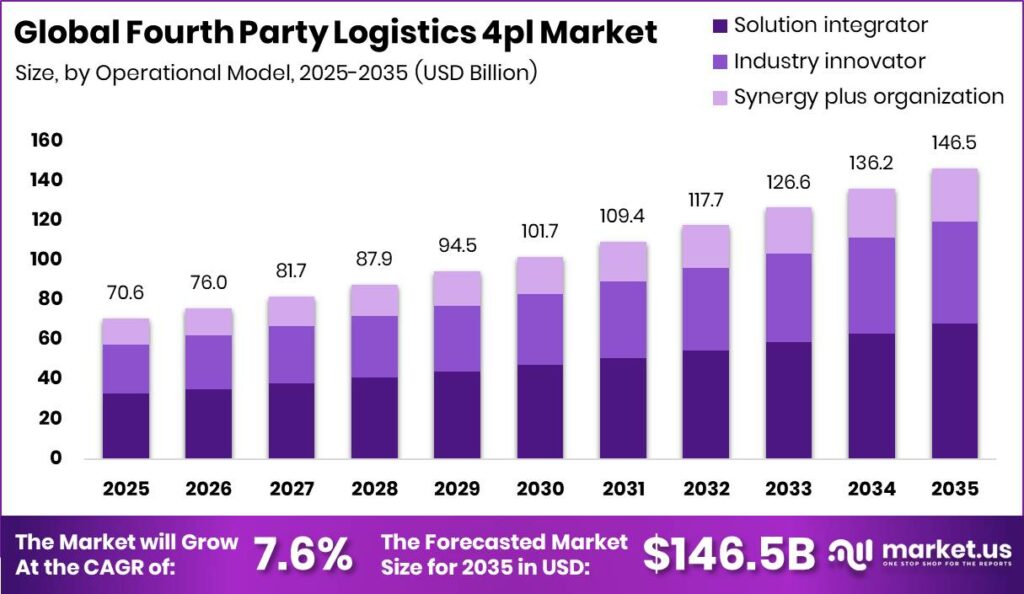
Global Fourth Party Logistics 4PL Market size is expected to be worth around USD 146.5 Billion by 2035 from USD 70.6 Billion in 2025, growing at a CAGR of 7.6% during the forecast period 2026 to 2035. This expansion signals that shippers now treat logistics orchestration as a core competitive lever. Providers who scale early will lock in long tenure enterprise contracts before rivals mature.
The Fourth Party Logistics 4PL Market covers a supply chain model where an enterprise outsources both logistics execution and management across its network. A 4PL provider sits above multiple 3PLs and carriers. This means the provider owns end to end coordination, technology, and optimization. The structure ties closely to the Third Party Logistics (3PL) Market because 4PLs orchestrate the 3PL partners they manage. This creates a layered market built on control tower value.
Key Takeaways
- Global market reaches USD 146.5 Billion by 2035 from USD 70.6 Billion in 2025 at a CAGR of 7.6%.
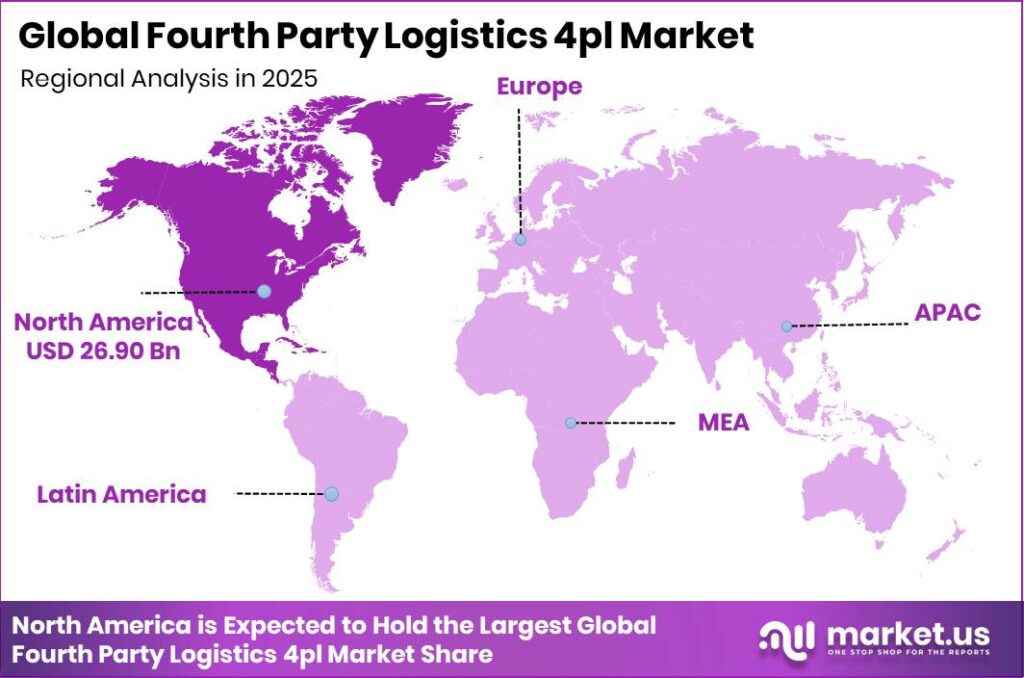
- North America leads regions with a 38.1% share, valued at USD 26.90 Billion.
- Supply chain optimization leads By Solution with a 29.5% share and ranks as fastest growing.
- Solution integrator leads By Operational Model with a 46.5% share.
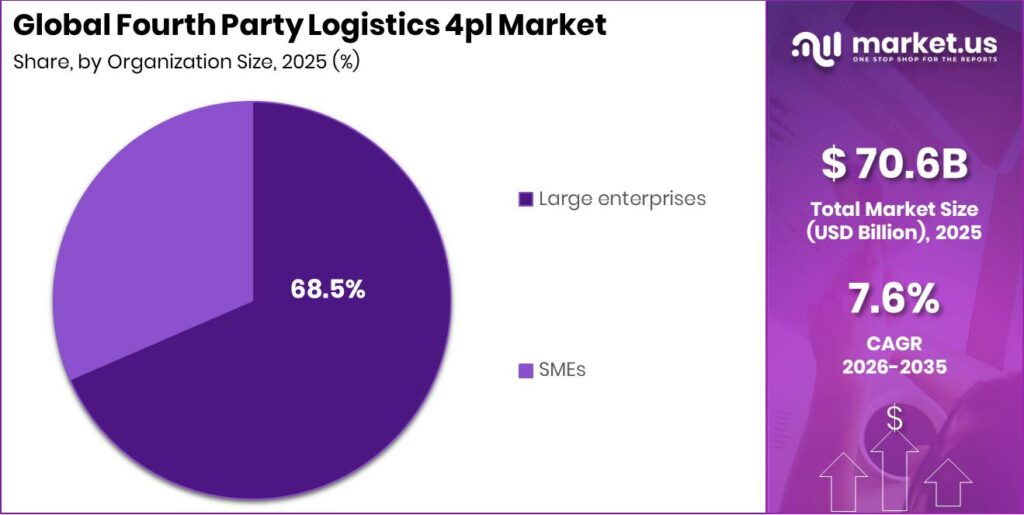
- Large enterprises lead By Organization Size with a 68.5% share.
- Retail leads By Industry with a 22.3% share and ranks as fastest growing.
Government trade and disclosure rules push shippers toward centralized logistics management. Carbon reporting mandates force firms to track emissions across every carrier and lane. This means companies need one orchestrator that consolidates data. Regulated sectors like pharmaceuticals add compliance pressure that favors managed 4PL control. As a result, policy shifts convert into direct demand for coordinated logistics services.
End use industries feed this demand through their own expansion. Retail and e-commerce volume growth forces firms to coordinate more carriers, so orchestration needs rise. As per our research, 42% of supply chain leaders already outsource to 4PL providers, while 35% plan to within two years. This split shows a large untapped conversion pipeline. Providers who target the planning cohort now can capture first mover contracts.
Financial results confirm the scale beneath integrated logistics. As reported by Deutsche Post AG, DHL Group achieved EUR 6.1 Billion EBIT in 2025 at a margin of 7.4%. This margin reflects the thin execution economics that pure orchestration must beat. This means providers who add software driven optimization can lift returns above the sector baseline and defend premium pricing.
Solution Analysis
Supply chain optimization dominates with 29.5% due to control tower cost reduction demand.
In 2025, Supply chain optimization held a dominant market position in the By Solution segment of Fourth Party Logistics 4PL Market, with a 29.5% share. World Bank trade data shows global merchandise trade exceeded USD 24 Trillion in 2023, multiplying the lanes each shipper must optimize. This scale rewards providers that centralize routing and cost decisions. Firms leading with proven savings models will win renewals fastest.
Transportation management coordinates movement across air, sea, and rail and road modes. UNCTAD reported maritime trade carried over 12 Billion tons of cargo in 2023, most of it by sea. Air moves high value time sensitive freight, while rail and road anchor inland reach. This means multimodal orchestration remains essential to any 4PL contract. Providers with balanced modal networks reduce client exposure to single mode shocks.
Inventory management, distribution management, order fulfillment, and warehouse management round out the solution set. UNCTAD data shows e-commerce sales surpassed USD 26 Trillion globally, forcing tighter stock and fulfillment coordination. Redwood Logistics earned a Visionary placement in Gartner’s first 4PL Magic Quadrant in December 2025 for digital first orchestration. This signals buyers reward platform depth across these functions, which together hold the remaining share collectively.
Operational Model Analysis
Solution integrator dominates with 46.5% due to unified multi-provider coordination capability.
In 2025, Solution integrator held a dominant market position in the By Operational Model segment of Fourth Party Logistics 4PL Market, with a 46.5% share. UN Comtrade records show more than 200 reporting economies exchange goods, multiplying the partners an integrator must align. This breadth favors providers that connect many 3PLs under one system. Buyers reward integrators that shorten onboarding across fragmented networks.
Industry innovator models compete by introducing new technology and process design ahead of peers. WTO figures show services trade grew about 9% in 2023, pulling logistics tech spend upward. Innovators win early adopter clients who value differentiation over price. This means they capture premium contracts but face slower volume scaling.
Synergy plus organization models blend integration with collaborative planning across clients. IMF data shows global GDP passed USD 105 Trillion in 2023, expanding the enterprise base that needs shared logistics gains. This collaborative structure holds the remaining share collectively alongside the innovator model. Providers offering shared optimization pools can undercut standalone rivals on cost.
Organization Size Analysis
Large enterprises dominate with 68.5% due to complex multi-country freight networks.
In 2025, Large enterprises held a dominant market position in the By Organization Size segment of Fourth Party Logistics 4PL Market, with a 68.5% share. World Bank enterprise data shows large firms drive the majority of formal cross border trade value. Their freight spend justifies dedicated orchestration contracts. This means providers should anchor pipelines on high volume enterprise accounts to secure stable revenue.
SMEs rank as the fastest growing size segment despite a smaller base. UNIDO reports small and medium firms make up over 90% of businesses worldwide, a vast untapped pool. Lower cost digital platforms now bring orchestration within their reach. This creates a scalable volume opportunity for providers who standardize service at accessible price points.
Industry Analysis
Retail dominates with 22.3% due to high volume omnichannel fulfillment complexity.
In 2025, Retail held a dominant market position in the By Industry segment of Fourth Party Logistics 4PL Market, with a 22.3% share. UNCTAD data shows business to consumer e-commerce reached hundreds of billions in cross border value. Retailers juggle many carriers, returns, and stores at once. This means orchestration directly cuts their fulfillment cost, making retail the anchor demand sector.
Automotive, consumer electronics, and industrial buyers rely on precise inbound coordination. FAO data shows global food and beverage trade exceeded USD 1.7 Trillion, adding cold chain complexity for that sector. Aerospace and defense demand secure, compliant handling. These sectors reward providers with sector specific compliance depth.
Healthcare adds regulated distribution needs under strict quality rules. World Bank health spending data shows healthcare exceeds 10% of global GDP, expanding regulated logistics volume. Food and beverages, aerospace and defense, industrial, and others hold the remaining share collectively. This signals providers with GDP compliant systems can win premium regulated contracts.
Key Market Segments
By Solution
- Supply chain optimization
- Transportation management
- Air
- Sea
- Rail & Road
- Inventory management
- Distribution management
- Order fulfillment
- Warehouse management
By Operational Model
- Industry innovator
- Solution integrator
- Synergy plus organization
By Organization Size
- SMEs
- Large enterprises
By Industry
- Aerospace & Defense
- Automotive
- Consumer Electronics
- Food & Beverages
- Industrial
- Retail
- Healthcare
- Others
Regional Analysis
North America Dominates the Fourth Party Logistics 4PL Market with a Market Share of 38.1%, Valued at USD 26.90 Billion
The Supply Chain Management Market anchors North America, which leads with a 38.1% share worth USD 26.90 Billion. Dense enterprise freight networks and early technology adoption drive this lead. This means providers with mature control tower platforms find their deepest demand here. Firms should prioritize North American enterprise accounts to defend share against new entrants.
Asia-Pacific ranks as the fastest growing region across the market. Nearshoring and expanding e-commerce volume raise multi provider coordination needs there. This creates a wide runway for providers building regional networks now. In July 2026, CEVA Logistics added about 150 warehouses and 20,000 employees through its FedEx Supply Chain acquisition, strengthening cross regional reach. Early scaling in this region secures long term volume.
Europe, Middle East and Africa, and Latin America complete the regional map. Europe carries heavy carbon disclosure rules that favor centralized emissions tracking. Latin America and the Middle East and Africa offer earlier stage adoption with strong upside. This means providers can enter these regions with standardized digital models before competition intensifies.
Key Regions and Countries
North America
- US
- Canada
Europe
- Germany
- France
- The UK
- Spain
- Italy
- Rest of Europe
Asia Pacific
- China
- Japan
- South Korea
- India
- Australia
- Rest of APAC
Latin America
- Brazil
- Mexico
- Rest of Latin America
Middle East and Africa
- GCC
- South Africa
- Rest of MEA
Market Dynamics
Market Opportunity Analysis - Underserved SMEs, fast growing regions, and non retail sectors open entry points for new players
The SME size segment stands out as underexploited despite ranking fastest growing. Large enterprises hold 68.5% of demand, so most providers ignore smaller accounts. This leaves a wide base with little tailored service. New entrants offering low cost digital platforms can capture volume that incumbents overlook, building scale before larger rivals adjust their pricing models.
Asia-Pacific offers the clearest regional white space as the fastest growing region. North America already holds 38.1% of the market, so competition there is dense. By contrast, Asia-Pacific networks remain fragmented and early stage. This means providers who build regional coverage now can lock in share before adoption matures and pricing hardens.
Non retail industries remain thinly served beyond the retail leader at 22.3%. Healthcare, automotive, and consumer electronics each demand specialized coordination. This creates room for providers with sector specific compliance and handling depth. Instead of chasing retail volume alone, new entrants can target regulated verticals where switching costs and margins run higher.
The synergy plus organization operational model sits behind the solution integrator leader at 46.5%. Collaborative shared planning across clients stays underdeveloped as a marketed model. This signals an opening for providers to pool optimization gains across accounts. Early movers can differentiate on shared cost savings that single client integrators cannot easily match.
Technology and Innovation Landscape - AI platforms, digital twins, and blockchain reshape 4PL orchestration value
AI, digital twin, and real time analytics platforms lift 4PL value above traditional 3PL aggregation. These tools give shippers live visibility and predictive routing across every carrier. This means providers with mature platforms justify premium fees. Buyers increasingly select orchestrators on technology depth, so investment here directly defends contract margins and win rates.
Generative AI and autonomous procurement mark the next innovation frontier. Systems that generate re routing recommendations in under 30 seconds moved from prototype toward commercial use in 2023 to 2024. This means providers can automate decisions that once needed human approval. Early adopters convert this capability into gain sharing revenue tied directly to client freight savings.
Blockchain and distributed ledger provenance tracking supports regulated and high value chains. Pharma, food, and luxury sectors need verifiable custody records across many partners. This creates a technology led differentiator for providers serving compliance heavy clients. Firms building ledger backed traceability can command premium pricing where trust and audit trails carry real financial weight.
Drivers
Rising supply chain complexity pushes firms to hand full logistics orchestration to neutral 4PL providers. A single mid to large enterprise now manages carriers across Tier 1 to Tier 3 relationships and many trade lanes. This exceeds most in house teams, so providers coordinating 8 to 25 concurrent 3PL relationships gain a clear economic case. The Logistics Management Market benefits as buyers delegate control to specialists.
The disruptions of 2021 to 2024 proved the cost of weak orchestration. The Red Sea crisis rerouted roughly 20 to 25% of container traffic, adding 10 to 14 days and USD 400 to 900 per TEU. Shippers under 4PL contracts rerouted within 48 to 96 hours. This means building internal control towers at USD 5 to 21 Million yearly loses to 4PL contracts costing USD 1.5 to 6 Million.
| Driver | (~) % Impact on CAGR Forecast | Geographic Relevance | Impact Timeline |
|---|---|---|---|
| Supply Chain Complexity & Multi-Tier Visibility Mandates Driving Outsourcing of End-to-End Logistics Orchestration to 4PL Providers | +2.40% | United States, Europe, China, Japan, Australia, India, Southeast Asia | Short term (≤ 2 years) |
| AI, Digital Twin & Real-Time Analytics Platform Adoption Elevating 4PL Value Proposition Over Traditional 3PL Aggregation | +1.60% | United States, Germany, United Kingdom, Japan, South Korea, Singapore | Short term (≤ 2 years) |
| Nearshoring & Supply Chain Regionalisation Increasing Multi-Provider Coordination Complexity Suited to 4PL Management | +1.20% | United States, Mexico, Poland, India, Vietnam, Morocco, Czech Republic | Short term (≤ 2 years) |
| ESG & Scope 3 Carbon Accounting Requirements Driving Shipper Demand for Centralised Logistics Emissions Monitoring | +0.85% | European Union, United Kingdom, United States, Japan, Australia, Canada | Medium term (2–4 years) |
| Pharmaceutical & Healthcare Regulated Supply Chain Complexity Driving 4PL Adoption for GDP-Compliant Orchestration | +0.72% | United States, European Union, Japan, India, Brazil, Australia | Medium term (2–4 years) |
| E-Commerce Cross-Border Trade Growth Requiring Integrated Customs, Fulfilment & Returns Orchestration | +0.48% | United States, China, Europe, Southeast Asia, Latin America, Middle East | Short term (≤ 2 years) |
Restraints
Shipper reluctance to cede control and data slows 4PL adoption. Granting one orchestrator full access to carrier rates and network topology raises dependency and lock in fears. For automotive, retail, and FMCG firms, logistics runs 4 to 10% of revenue. Misused data could erode margins by 2 to 5 percentage points. This means enterprise buyers move cautiously before approving full visibility access.
The Digital Logistics Market lacks technically enforced data segregation, so protections stay legal rather than cryptographic. This stretches enterprise deals above USD 5 Million to 9 to 18 months versus 3 to 6 months for 3PL contracts. Pre sales costs reach USD 150,000 to 600,000 per deal. This means first contract margins compress to 8 to 14%, delaying profitability to 2 to 4 years.
| Restraint | (~) % Impact on CAGR Forecast | Geographic Relevance | Impact Timeline |
|---|---|---|---|
| Shipper Reluctance to Cede Strategic Logistics Control & Proprietary Data to a Single 4PL Orchestrator | -1.40% | Global — most acute among large enterprise shippers in automotive, retail & FMCG | Short term (≤ 2 years) |
| Absence of Standardised 4PL Service Definition & Contractual Framework Creating Procurement Hesitancy | -0.85% | Global — most acute in emerging markets with immature logistics outsourcing culture | Short term (≤ 2 years) |
| Conflict of Interest Risk Where 4PL Providers Have Ownership Stakes in 3PL Subsidiaries They Manage | -0.55% | Global — most acute in Europe & United States where regulator and shipper scrutiny is high | Short term (≤ 2 years) |
| High Transition Cost & Systems Integration Complexity Delaying 4PL Contract Onboarding Timelines | -0.40% | Global — affects all markets with legacy ERP and TMS environments | Short term (≤ 2 years) |
Challenges
Multi party data interoperability strains the 4PL model at its core. A provider managing 12 to 20 active 3PL partners across 4 to 8 countries must maintain 25 to 60 live system endpoints. Integration costs run USD 8,000 to 35,000 per endpoint yearly. This creates fixed overhead of USD 200,000 to 2.1 Million per client before variable costs apply.
Carrier API changes disrupt 15 to 25% of integrations each year, causing blackouts of 4 to 48 hours. These gaps trigger SLA penalties of USD 5,000 to 50,000 per incident. This means providers who invest USD 2 to 8 Million in middleware unlock a new managed integration revenue stream. Solving this lifts EBITDA from 4 to 8% toward 12 to 18%.
| Challenge | (~) % CAGR Friction Drag | Geographic Relevance | Mitigation Horizon |
|---|---|---|---|
| Multi-Party Data Interoperability & API Integration Complexity | -0.95% | Global — most acute in multi-modal, multi-country network orchestration | Long term (≥ 4 years) |
| Talent Scarcity in Supply Chain Technology & Analytics Roles | -0.72% | United States, Europe, Australia, Singapore, Japan — advanced logistics markets | Long term (≥ 4 years) |
| Geopolitical Trade Disruption & Sanctions Compliance Management Across 4PL Networks | -0.55% | Global — most acute for 4PLs managing Russia-adjacent, China-dependent & Middle East trade lanes | Long term (≥ 4 years) |
| SME Market Penetration Barrier Due to High Minimum Contract Value Thresholds | -0.42% | Global — SME segments in India, Southeast Asia, Latin America, Eastern Europe | Long term (≥ 4 years) |
| Performance KPI Standardisation & Contractual SLA Enforcement Complexity | -0.28% | Global — most acute in multi-jurisdictional enterprise contracts | Medium term (2–4 years) |
Opportunities
Generative AI powered optimization opens the highest value white space in the market. Through 2025 to 2026, most providers used AI only for dashboards and delay prediction, not autonomous decisions. Enterprise shippers offered fee premiums of 15 to 30% for AI driven freight savings of 8 to 15%. This means early movers can add USD 750,000 to 2.5 Million per client in incremental annual value.
Providers building proprietary AI decision layers invest USD 8 to 35 Million over 2 to 4 years. First movers validating 8 to 12% freight savings can shift to gain sharing, capturing 15 to 25% of documented savings. This creates gross margins of 55 to 72% on that layer. As a result, the P&L moves from 8 to 14% EBITDA toward 22 to 35%.
| Opportunity | (~) % Potential CAGR Upside | Geographic Relevance | Execution Window |
|---|---|---|---|
| Generative AI-Powered Supply Chain Optimisation & Autonomous Procurement as Premium 4PL Value-Add Service | +1.80% | United States, Germany, United Kingdom, Japan, Singapore, Australia | Medium term (2–4 years) |
| SME-Focused Digital 4PL Platform at Accessible Price Points Addressing Underserved Mid-Market Segment | +1.20% | India, Southeast Asia, Latin America, Eastern Europe, Middle East | Medium term (2–4 years) |
| Sustainability-as-a-Service: 4PL-Managed Scope 3 Freight Decarbonisation & Green Lane Optimisation | +0.90% | European Union, United Kingdom, United States, Japan, Australia, Canada | Long term (≥ 4 years) |
| Blockchain & Distributed Ledger-Enabled Provenance Tracking for Regulated & High-Value Supply Chains | +0.65% | United States, European Union, Japan, Singapore, Australia — pharma, food & luxury sectors | Long term (≥ 4 years) |
| 4PL Expansion into Last-Mile & Reverse Logistics Orchestration for E-Commerce Returns Networks | +0.48% | United States, Europe, China, India, Southeast Asia, Latin America | Short term (≤ 2 years) |
Key Company Insights
Deutsche Post AG anchors the market through its DHL Group scale, generating EUR 82.9 Billion revenue in 2025 across integrated logistics and control tower services. This scale gives it carrier breadth and platform depth that smaller rivals cannot match quickly. This means the firm can absorb integration costs and cross subsidize new contracts. However, its size can slow tailored responses for niche mid market clients.
UPS Supply Chain leans on massive delivery volume, moving 5.2 Billion packages in 2025 at 20.8 Million per day, with total revenue of USD 88.7 Billion. Its supply chain unit reached a 9.8% operating margin in Q4 2025. This means the firm converts network density into orchestration efficiency. This creates a defensible cost advantage that pressures asset light challengers on price.
Key Players
- C.H. Robinson
- CEVA Logistics
- CMA CGM SA Group
- Conexial Supply Chain India PVT LTD
- DB Schenker
- Deutsche Post AG
- DSV AS
- Express Delivery Sweden AB
- FedEx Logistics
- Global4PL
- J and J Denholm Ltd.
- Kuehne Nagel Management AG
- Nippon Express
- UPS Supply Chain
- XPO Logistics
Recent Developments
- July 2026: CMA CGM agreed to acquire FedEx Supply Chain for USD 1.4 Billion, expanding CEVA Logistics 4PL orchestration and contract logistics network in North America.
- March 2026: GEODIS was named a Leader in Gartner’s inaugural 4PL Magic Quadrant, reflecting strong orchestration, digital control tower systems, and multi client supply chain management capabilities.
- November 2025: KLN Pharma was appointed 4PL provider for Ego Pharmaceuticals skincare and pharma supply chain operations in Hong Kong.
Geopolitical Impact Analysis
According to UNCTAD, Red Sea disruptions cut Suez Canal transits by nearly 50% in early 2024, forcing Cape of Good Hope reroutes. This added roughly 10 days of transit on Asia to Europe lanes that 4PL orchestrators must absorb. Longer routes raise fuel and carrier costs directly. This means providers with pre agreed contingency routing protect clients from spot rate shocks and win trust during instability.
As reported by the WTO, average applied tariffs rose across major economies amid trade tensions, with some rates climbing above 25% on targeted goods. Higher duties reshape sourcing and reroute freight through nearshore hubs. This means 4PL networks must manage shifting customs and compliance loads across new lanes. Therefore, providers with strong sanctions screening and multi country coordination gain a defensible edge in volatile trade conditions.
Report Scope
| Report Features | Description |
|---|---|
| Market Value (2025) | USD 70.6 Billion |
| Forecast Revenue (2035) | USD 146.5 Billion |
| CAGR (2026-2035) | 7.6% |
| Base Year for Estimation | 2025 |
| Historic Period | 2020-2024 |
| Forecast Period | 2026-2035 |
| Report Coverage | Revenue Forecast, Market Dynamics, Market Opportunity Analysis, Technology and Innovation Landscape, Competitive Landscape, Recent Developments |
| Segments Covered | By Solution (Supply chain optimization, Transportation management (Air, Sea, Rail & Road), Inventory management, Distribution management, Order fulfillment, Warehouse management), By Operational Model (Industry innovator, Solution integrator, Synergy plus organization), By Organization Size (SMEs, Large enterprises), By Industry (Aerospace & Defense, Automotive, Consumer Electronics, Food & Beverages, Industrial, Retail, Healthcare, Others) |
| Regional Analysis | North America (US and Canada), Europe (Germany, France, The UK, Spain, Italy, and Rest of Europe), Asia Pacific (China, Japan, South Korea, India, Australia, and Rest of APAC), Latin America (Brazil, Mexico, and Rest of Latin America), Middle East and Africa (GCC, South Africa, and Rest of MEA) |
| Competitive Landscape | C.H. Robinson, CEVA Logistics, CMA CGM SA Group, Conexial Supply Chain India PVT LTD, DB Schenker, Deutsche Post AG, DSV AS, Express Delivery Sweden AB, FedEx Logistics, Global4PL, J and J Denholm Ltd., Kuehne Nagel Management AG, Nippon Express, UPS Supply Chain, XPO Logistics |
| Customization Scope | Customization for segments, region / country-level will be provided. Additional customization can be done based on requirements. |
| Purchase Options | We have three licenses to opt for: Single User License | Multi-User License (Up to 5 Users) | Corporate Use License (Unlimited User and Printable PDF) |





































