


Report Overview
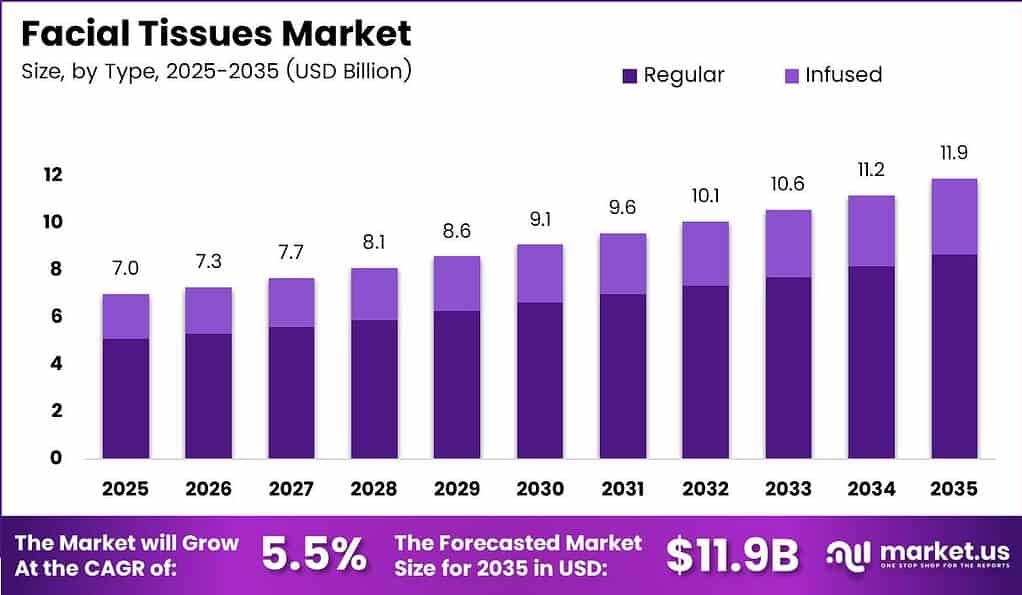
Global Facial Tissues Market size is expected to be worth around USD 11.9 Billion by 2035 from USD 7.0 Billion in 2025, growing at a CAGR of 5.5% during the forecast period 2026 to 2035.
The facial tissues market covers single-use paper products designed for personal hygiene, skincare application, and household convenience. It spans plain regular tissues and infused variants, sold in box and packet formats through retail, pharmacy, and online channels. By contrast, industrial tissue and bath-tissue categories operate under separate procurement and pricing structures not included in this scope.
Key Takeaways
- The global facial tissues market is valued at USD 7.0 Billion in 2025 and is forecast to reach USD 11.9 Billion by 2035.
- The market grows at a CAGR of 5.5% during the forecast period 2026 to 2035.
- By Type, Regular tissues dominate with a 72.10% share and are also the fastest-growing sub-segment.
- By Packaging, Box format holds a 60.34% share and is the fastest-growing packaging type.
- By Structure, Single Layer holds the leading position with a 62.10% share.
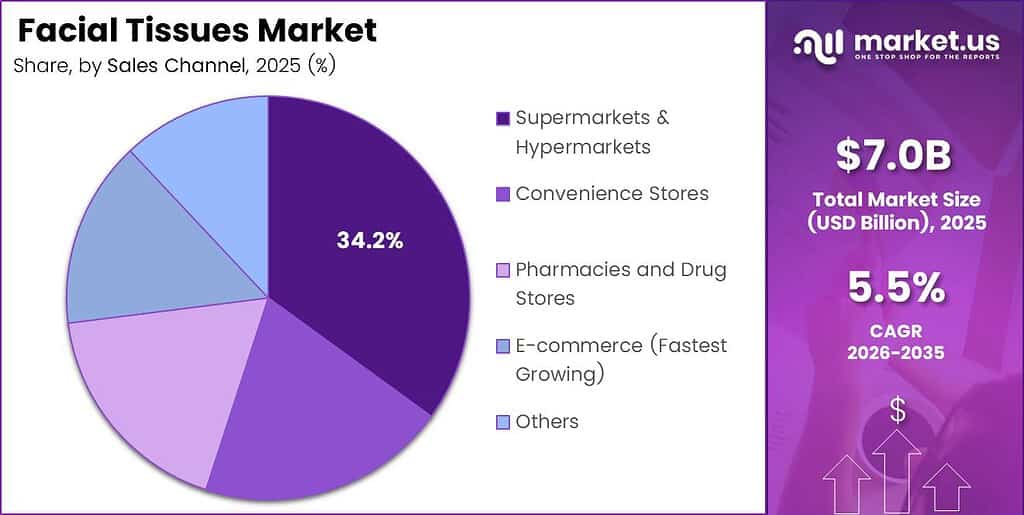
- By Sales Channel, Supermarkets and Hypermarkets lead with a 34.23% share.
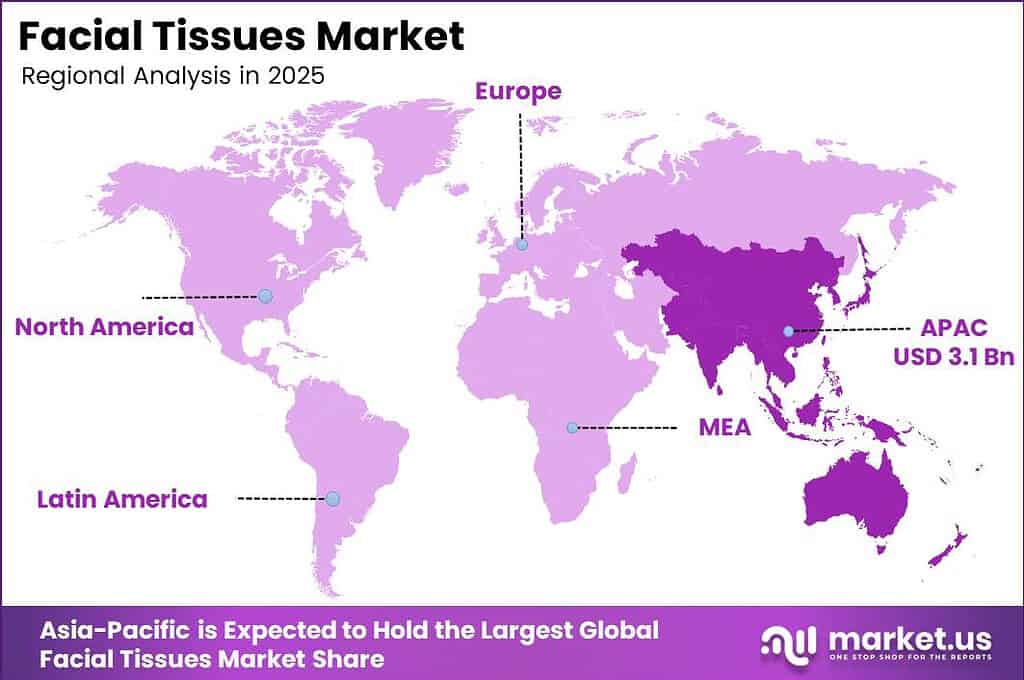
- Asia-Pacific dominates regionally with a 44.34% market share, valued at USD 3.1 Billion.
- Middle East and Africa is the fastest-growing region during the forecast period.
As per our research, e-commerce accounted for 16.4% of total U.S. retail sales in the second quarter of 2026 on a not-seasonally-adjusted basis. This structural shift in retail behavior pushes facial tissue brands toward digital shelf investment. Vendors that build subscription and auto-replenishment capabilities will capture recurring revenue that traditional retail cannot lock in.
Supply chain volatility adds a cost layer that manufacturers cannot fully absorb. UNCTAD’s 2024 analysis projected that global consumer prices could rise by 0.6% by end of 2025 if disruption-related container freight-rate increases observed between October 2023 and June 2024 continued. This applies direct cost pressure to tissue producers relying on cross-border pulp and finished-goods movements.
Sofidel’s June 2025 acquisition of Royal Paper assets, including the Gila Bend, Arizona, paper mill with annual production capacity of 61,000 metric tons, reflects a deliberate nearshoring response to that exposure. Sofidel’s November 2024 acquisition of Clearwater Paper’s tissue division, which added 4 production plants and approximately 340,000 metric tons of annual capacity, signals that scale consolidation is the dominant competitive response to margin pressure across the industry.
Type Analysis
Regular dominates with 72.10% due to universal household demand and low unit cost.
In 2025, Regular tissues held a dominant market position in the By Type segment of the Facial Tissues Market, with a 72.10% share. Price accessibility and multi-purpose daily use drive consistent replenishment across income brackets. This volume concentration makes the Regular sub-segment the primary battleground for private-label competition and margin compression, leaving branded players dependent on pack differentiation and loyalty programs to defend share.
Infused tissues occupy a premium niche built on added functional value such as lotion, aloe, or vitamin E treatments. These products command higher shelf prices and attract repeat buyers who prioritize skin comfort over cost. This positions Infused as the higher-margin tier within the Type segment, making it the logical expansion vehicle for brands seeking revenue growth without competing solely on volume.
Packaging Analysis
Box dominates with 60.34% due to household placement convenience and unit-count efficiency.
In 2025, Box packaging held a dominant market position in the By Packaging segment of the Facial Tissues Market, with a 60.34% share. Rigid box formats fit standard shelf and counter placements in homes, hotels, and offices, making them the default procurement format for institutional buyers. This structural advantage means box-format suppliers benefit from predictable re-order cycles tied to hospitality and corporate procurement budgets.
Packet formats serve portability demand across travel, personal care bags, and on-the-go use occasions. These smaller units carry a higher cost per sheet but reach consumers in convenience and pharmacy channels where impulse purchase drives the transaction. Georgia-Pacific’s December 2024 announcement of a $90 million investment at its Crossett, Arkansas, mill reflects continued manufacturer commitment to expanding retail converting capacity across both format types. Vendors that extend packet distribution into quick-service hospitality gain access to a high-velocity replenishment cycle outside traditional grocery.
Structure Analysis
Single Layer dominates with 62.10% due to cost efficiency and broad retail availability.
In 2025, Single Layer tissues held a dominant market position in the By Structure segment of the Facial Tissues Market, with a 62.10% share. Lower fiber input per unit makes single-layer products the most cost-competitive structure in price-sensitive markets across South Asia, Southeast Asia, and Africa. This cost profile positions single-layer manufacturers as the primary beneficiaries of expanding household penetration in lower-income geographies.
Multi-Layer tissues are the fastest-growing structural sub-segment, driven by consumer preference for tactile softness in mature markets across North America, Western Europe, and Northeast Asia. The additional ply count increases raw material cost but supports premium pricing and margin recovery. Brands investing in multi-layer expansion are effectively trading volume scale for per-unit profitability, a shift that rewards those with integrated fiber supply.
Sales Channel Analysis
Supermarkets and Hypermarkets dominate with 34.23% due to high foot traffic and shelf visibility.
In 2025, Supermarkets and Hypermarkets held a dominant market position in the By Sales Channel segment of the Facial Tissues Market, with a 34.23% share. Large-format retail provides brands with consistent shelf placement, promotional event access, and basket-attachment opportunities alongside cleaning and personal care products. This channel concentration gives leading tissue suppliers significant negotiating leverage but also creates dependency on a small number of key retail accounts.
E-commerce is the fastest-growing sales channel in this market. Data from Procter and Gamble shows e-commerce represented 20% of the company’s total sales in fiscal 2026, with e-commerce sales increasing 6% during the year. This reflects a structural and not cyclical shift in how consumers replenish consumables. Tissue vendors that build direct-to-consumer subscription models alongside marketplace listings reduce their exposure to retailer-driven promotional pricing and gain direct data on replenishment frequency.
The U.S. Census Bureau’s August 18, 2026 release estimated second-quarter 2026 U.S. retail e-commerce sales at $340.2 billion, seasonally adjusted. Sofidel’s January 2024 acquisition of ST Paper’s Duluth, Minnesota, paper mill, which held annual production capacity of 65,000 metric tons, expanded the company’s domestic supply base in a market where e-commerce fulfillment speed favors regionally sourced inventory. Convenience stores, pharmacies, and drug stores, along with other retail formats, hold the remaining channel share and serve distinct need states, including impulse purchase and medically oriented buyers who purchase lotion-treated tissues on clinical recommendation.
Key Market Segments
By Type
- Regular
- Infused
By Packaging
- Box
- Packet
By Structure
- Single Layer
- Multi Layers
By Sales Channel
- Supermarkets & Hypermarkets
- Convenience Stores
- Pharmacies and Drug Stores
- E-commerce
- Others
Regional Analysis
Asia-Pacific Dominates the Facial Tissues Market with a Market Share of 44.34%, Valued at USD 3.1 Billion
Asia-Pacific leads the global facial tissues market with a 44.34% share valued at USD 3.1 Billion in 2025. High population density, rising urban household incomes, and deeply embedded tissue-use habits in markets such as China, Japan, and South Korea anchor this dominance. This regional concentration means global suppliers that lack a manufacturing or distribution footprint in Asia-Pacific face a structural revenue ceiling.
Middle East and Africa is the fastest-growing region in the global facial tissues market. Rising urban household formation, expanding organized retail coverage, and a young consumer base with strengthening disposable income underpin this trajectory. Brands that establish early distribution relationships in Gulf markets and Sub-Saharan African cities position themselves ahead of the volume build before larger competitors redirect investment from saturated regions.
North America and Europe represent the highest per-capita consumption regions globally, driven by mature retail infrastructure and established household habits. Sofidel’s March 2026 announcement of a $775 million expansion at Inola, Oklahoma, including a 75,000-tonne-per-year Through-Air-Drying tissue machine and an automated warehouse with 100,000 pallet positions, confirms continued capacity investment in the North American market. Latin America presents a fragmented competitive structure where local converters hold price advantage, and outside Brazil and Mexico the market remains underpenetrated at the branded-product level.
Key Regions and Countries
North America
- US
- Canada
Europe
- Germany
- France
- The UK
- Spain
- Italy
- Rest of Europe
Asia Pacific
- China
- Japan
- South Korea
- India
- Australia
- Rest of APAC
Latin America
- Brazil
- Mexico
- Rest of Latin America
Middle East and Africa
- GCC
- South Africa
- Rest of MEA
Drivers
Recovered international travel generates recurring facial-tissue procurement across hotels, resorts, and guest-facing commercial spaces. UN Tourism recorded approximately 1.4 billion international arrivals in 2024, an increase of 11% over 2023, followed by approximately 1.52 billion arrivals in 2025, up 4%. Suppliers serving hospitality accounts benefit from scheduled delivery contracts, standardized case formats, and multi-property purchasing agreements that reduce selling cost per unit.
Urban household penetration in South Asia, Southeast Asia, and Africa adds a durable volume base independent of travel cycles. Premium softness and lotion-treated product lines in North America, Western Europe, and Northeast Asia support price mix improvement alongside base volume growth. Organized retail shelf-space expansion in India, Southeast Asia, and Latin America brings facial tissues into new purchase occasions. Established household online replenishment in China, North America, and Western Europe sustains predictable, recurring order frequency.
| Driver | (~) % Impact on CAGR Forecast | Geographic Relevance | Impact Timeline |
|---|---|---|---|
| Hospitality occupancy and travel-led replenishment | +0.35% | Global; tourism-intensive destinations | Short term (≤ 2 years) |
| Urban household penetration and convenience consumption | +0.30% | South Asia; Southeast Asia; Africa | Medium term (2–4 years) |
| Premium softness and lotion-treated product mix | +0.25% | North America; Western Europe; Northeast Asia | Short term (≤ 2 years) |
| Organized retail shelf-space expansion | +0.20% | India; Southeast Asia; Latin America | Medium term (2–4 years) |
| Established household online replenishment | +0.15% | China; North America; Western Europe | Short term (≤ 2 years) |
Restraints
Low disposable income prevents a material portion of potential buyers from purchasing facial tissues at all or forces existing buyers to skip replenishment cycles. The World Bank’s 2024 assessment estimated that approximately 44% of the global population lived below its upper-middle-income poverty threshold. This limits addressable market size across Sub-Saharan Africa, South Asia, and lower-income Latin America, where price-per-sheet sensitivity directly caps category penetration rates.
Substitution by multipurpose paper products, virgin-pulp price pass-through constraints, import duties on finished facial tissues, and retail delisting of low-velocity ranges collectively apply further downward pressure on growth. The combined restraint sensitivity totals -1.00 percentage point against the 5.5% baseline CAGR, leaving an illustrative stressed growth rate of 4.5%. Manufacturers that reduce entry-pack size to lower unit cost risk raising packaging cost per sheet, directly compressing the margin buffer they sought to create.
| Restraint | (~) % Impact on CAGR Forecast | Geographic Relevance | Impact Timeline |
|---|---|---|---|
| Low-income household affordability ceiling | -0.35% | South Asia; Sub-Saharan Africa; lower-income Latin America | Short term (≤ 2 years) |
| Substitution by existing multipurpose paper products | -0.25% | Global; price-sensitive household channels | Short term (≤ 2 years) |
| Virgin-pulp price pass-through constraints | -0.20% | Global; nonintegrated tissue converters | Short term (≤ 2 years) |
| Import duties on finished facial tissues | -0.10% | Tariff-protected importing markets | Medium term (2–4 years) |
| Retail delisting of low-velocity facial-tissue ranges | -0.10% | Mature grocery and discount channels | Short term (≤ 2 years) |
Challenges
Facial tissue supply chains carry structural logistics exposure because finished boxes occupy substantial shipping volume relative to their unit value. According to UNCTAD, Suez Canal tonnage fell 70% by mid-2024 compared with late 2023, and Gulf of Aden tonnage fell 76% over the same period. Ship-capacity arrivals around the Cape of Good Hope increased 89% amid cargo rerouting. An India-to-Europe round trip extended from 56 days to 63 days, requiring an additional vessel to preserve service frequency.
These disruptions force tissue manufacturers to hold additional inventory buffers on affected lanes and absorb higher delivered costs. A modeled 7 to 14 additional inventory days combined with 1 to 2% higher delivered costs on exposed shipments supports a -0.25-percentage-point growth friction. Combined challenge friction across all five challenge categories totals -0.80 percentage points, leaving positive illustrative growth of 3.7% under a full dual-stress scenario. Regional converting investment and differentiated safety-stock strategies are the structurally sound responses for manufacturers dependent on cross-border fiber or finished-goods movements.
| Challenge | (~) % CAGR Friction Drag | Geographic Relevance | Mitigation Horizon |
|---|---|---|---|
| Maritime routing and inventory volatility | -0.25% | Asia–Europe; Middle East; import-dependent markets | Short term (≤ 2 years) |
| Softness–strength process optimization | -0.20% | Global tissue manufacturing hubs | Medium term (2–4 years) |
| Drying energy efficiency gaps | -0.15% | Europe; Asia; older manufacturing assets | Medium term (2–4 years) |
| Specialist converting maintenance shortages | -0.10% | Emerging production clusters; aging industrial workforces | Medium term (2–4 years) |
| Fiber provenance data fragmentation | -0.10% | Cross-border forest-fiber supply chains | Medium term (2–4 years) |
Opportunities
Durable facial-tissue dispensers paired with dedicated lightweight refills create a recurring revenue stream separate from conventional boxed-tissue sales. The economic case assumes packaging accounts for 8 to 12% of delivered boxed-product cost and refill conversion reduces that component by 30 to 40%, producing approximately 2.4 to 4.8% gross delivered-cost savings before dispenser subsidies and marketing costs normalize. Manufacturers that lock in dispenser placement in North America and Europe before category standards solidify gain a recurring refill attach rate that competitors cannot replicate through price alone.
New institutional placement programs targeting outpatient clinics, schools, and eldercare facilities globally represent an underexploited volume channel with low price sensitivity and high re-order consistency. Qualified agricultural-residue tissue platforms in India and Southeast Asia open a long-term fiber diversification path for converters exposed to virgin-pulp price swings. Regional converter consolidation in fragmented Latin American and Asian markets and automotive dispensing formats in China, North America, and Gulf markets round out an opportunity basket with a combined potential CAGR upside of +1.00 percentage point, implying a conditional upside scenario of 6.5%.
| Opportunity | (~) % Potential CAGR Upside | Geographic Relevance | Execution Window |
|---|---|---|---|
| Durable dispensers with dedicated refill ecosystems | +0.30% | North America; Europe; developed Asian markets | Medium term (2–4 years) |
| New institutional facial-tissue placement programs | +0.25% | Outpatient clinics; schools; eldercare facilities globally | Medium term (2–4 years) |
| Qualified agricultural-residue tissue platforms | +0.20% | India; Southeast Asia; agricultural processing clusters | Long term (≥ 4 years) |
| Regional converter consolidation platforms | +0.15% | Fragmented Latin American and Asian markets | Medium term (2–4 years) |
| Automotive and mobility-specific dispensing formats | +0.10% | China; North America; Gulf markets | Medium term (2–4 years) |
Key Company Insights
KCWW (Kimberly-Clark’s operating entity) operates with a significant customer concentration exposure, with Walmart representing approximately 14% of Kimberly-Clark’s consolidated net sales in 2024. The company employed approximately 38,000 people as of December 31, 2024. In July 2026, Kimberly-Clark and Suzano launched Arbex as an independent tissue and hygiene business following their $3.4 billion joint venture. Arbex operates 22 manufacturing sites in 14 countries and serves more than 70 markets, reshaping the company’s global manufacturing footprint and reducing single-region supply dependency.
Procter and Gamble generates outsized retail concentration risk, with Walmart and its affiliates representing approximately 16% of total sales in fiscal 2025 and its top 10 customers accounting for 43% of net sales that year. The company reported consolidated net sales of $87.0 billion in fiscal 2026. Kimberly-Clark’s May 2025 commitment to invest more than $2 billion over five years in North American manufacturing and distribution, creating more than 900 jobs, signals a parallel infrastructure build that intensifies competitive pressure on Procter and Gamble across the same geography. By contrast, Procter and Gamble’s e-commerce channel, which reached 20% of total sales in fiscal 2026, provides a distribution diversification buffer that capital-intensive manufacturing investments alone cannot replicate.
Key Players
- KCWW
- Procter & Gamble
- Georgia-Pacific
- Essity Aktiebolag
- Hearttex
- Cottonsoft
- Seventh Generation Inc.
- WEPA Hygieneprodukte GmbH
- Irving Consumer Products Limited
- Industrie Cartarie Tronchetti S.p.A.
- Other Key Players
Recent Developments
- August 4, 2026 – Sofidel commissioned a 4.65 MW photovoltaic system containing 8,010 panels at its Circleville, Ohio, tissue-production facility.
- May 28, 2026 – Metsä Group inaugurated its expanded Mariestad tissue mill following a €370 million investment. The expansion doubled annual production capacity to approximately 145,000 tonnes, with operations beginning in autumn 2025.
- April 9, 2026 – WEPA completed its majority-stake acquisition in MPH1865, which produces up to 60,000 tonnes of paper annually. The acquired business now operates as WEPA Professional France.
- May 26, 2025 – WEPA announced investment in a new paper machine with planned annual capacity of 70,000 tons and two converting lines at Bridgend, United Kingdom.
- November 21, 2024 – Irving Tissue announced a $600 million expansion at Macon, Georgia, adding 75,000 tonnes of annual Through-Air-Dry capacity and 100 jobs.
- May 14, 2024 – Essity announced more than €110 million of investment in France, comprising €30 million for a global paper-hygiene research and development centre and more than €80 million for industrial equipment and decarbonization projects.
- April 10, 2024 – Georgia-Pacific announced an investment of more than $150 million to rebuild a paper machine at Wauna, Oregon, for Angel Soft and private-label bath tissue, with start-up scheduled for 2026.
Report Scope
| Report Features | Description |
|---|---|
| Market Value (2025) | USD 7.0 Billion |
| Forecast Revenue (2035) | USD 11.9 Billion |
| CAGR (2026-2035) | 5.5% |
| Base Year for Estimation | 2025 |
| Historic Period | 2020-2024 |
| Forecast Period | 2026-2035 |
| Report Coverage | Revenue Forecast, Market Dynamics, Market Opportunity Analysis, Technology and Innovation Landscape, Competitive Landscape, Recent Developments |
| Segments Covered | By Type (Regular, Infused), By Packaging (Box, Packet), By Structure (Single Layer, Multi Layers), By Sales Channel (Supermarkets & Hypermarkets, Convenience Stores, Pharmacies and Drug Stores, E-commerce, Others) |
| Regional Analysis | North America (US and Canada), Europe (Germany, France, The UK, Spain, Italy, and Rest of Europe), Asia Pacific (China, Japan, South Korea, India, Australia, and Rest of APAC), Latin America (Brazil, Mexico, and Rest of Latin America), Middle East and Africa (GCC, South Africa, and Rest of MEA) |
| Competitive Landscape | KCWW, Procter & Gamble, Georgia-Pacific, Essity Aktiebolag, Hearttex, Cottonsoft, Seventh Generation Inc., WEPA Hygieneprodukte GmbH, Irving Consumer Products Limited, Industrie Cartarie Tronchetti S.p.A., Other Key Players |
| Customization Scope | Customization for segments, region/country-level will be provided. Additional customization can be done based on requirements. |
| Purchase Options | We have three licenses to opt for: Single User License, Multi-User License (Up to 5 Users), Corporate Use License (Unlimited User and Printable PDF) |








