


Report Overview
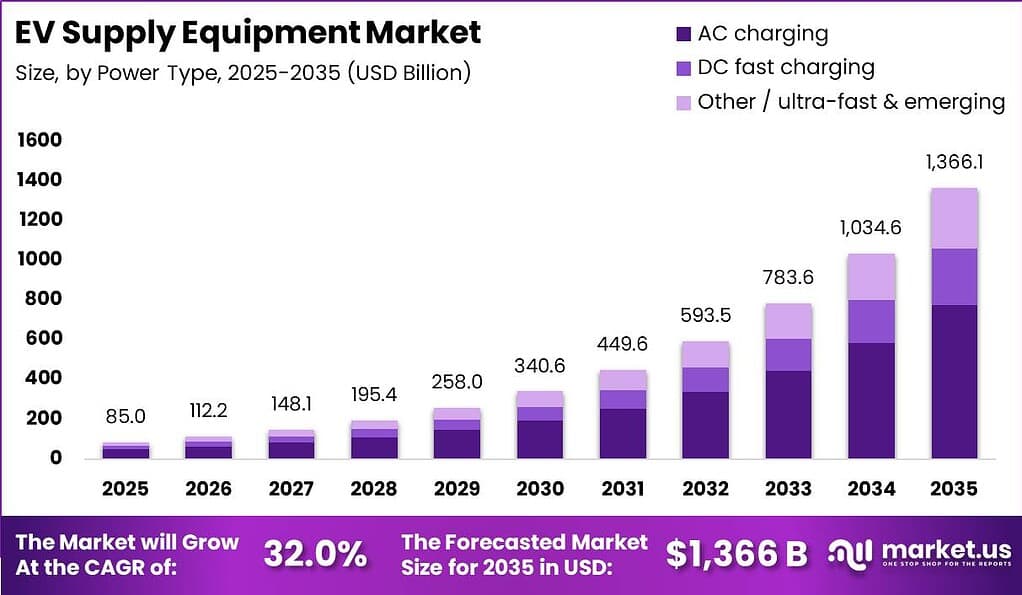
Global EV Supply Equipment Market size is expected to be worth around USD 1,366.10 Billion by 2035 from USD 85.00 Billion in 2025, growing at a CAGR of 32.0% during the forecast period 2026 to 2035. This trajectory places the EV Supply Equipment Market among the fastest-scaling infrastructure sectors globally. Investors and manufacturers who position early will capture the highest-value network contracts before the market consolidates.
The EV supply equipment market covers the full range of hardware and software systems that deliver electrical energy to battery electric and plug-in hybrid vehicles. This includes Level 1 and Level 2 AC wall-box chargers, DC fast-charging kiosks, portable charging units, and integrated charging systems embedded in residential, commercial, and public infrastructure. Software platforms for energy management, payment processing, and network monitoring form a growing share of total market value.
Key Takeaways
- The global EV supply equipment market is valued at USD 85.00 Billion in 2025 and is forecast to reach USD 1,366.10 Billion by 2035.
- The market grows at a CAGR of 32.0% during the forecast period 2026 to 2035.
- By Power, AC Charging (Level 1 to 2) dominates with a 56.7% share.
- By Product Type, Wall-Box / Fixed AC Charger holds the largest segment share at 38.4%.
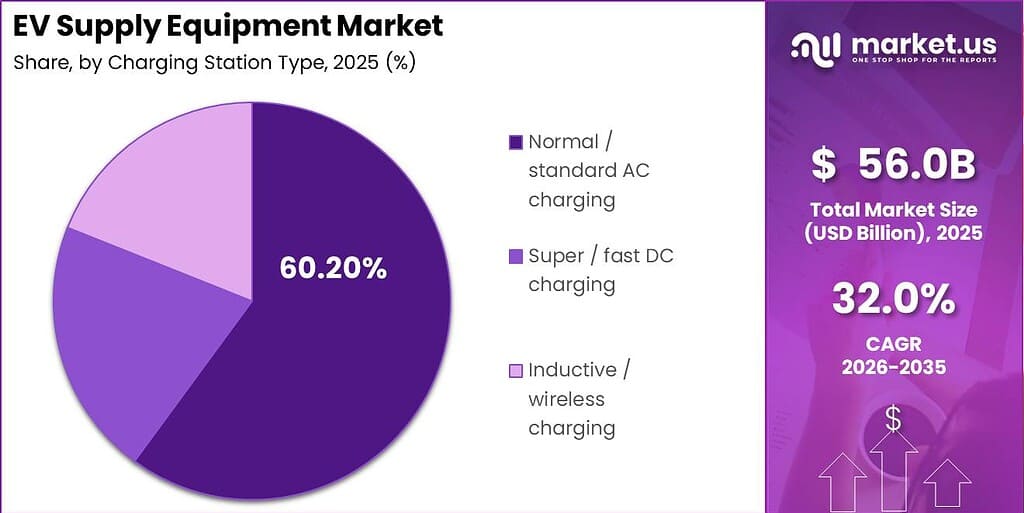
- By Charging Station Type, Normal / Standard AC Charging leads with a 60.2% share.
- By Application, Residential / Home Charging captures the largest share at 55.6%.
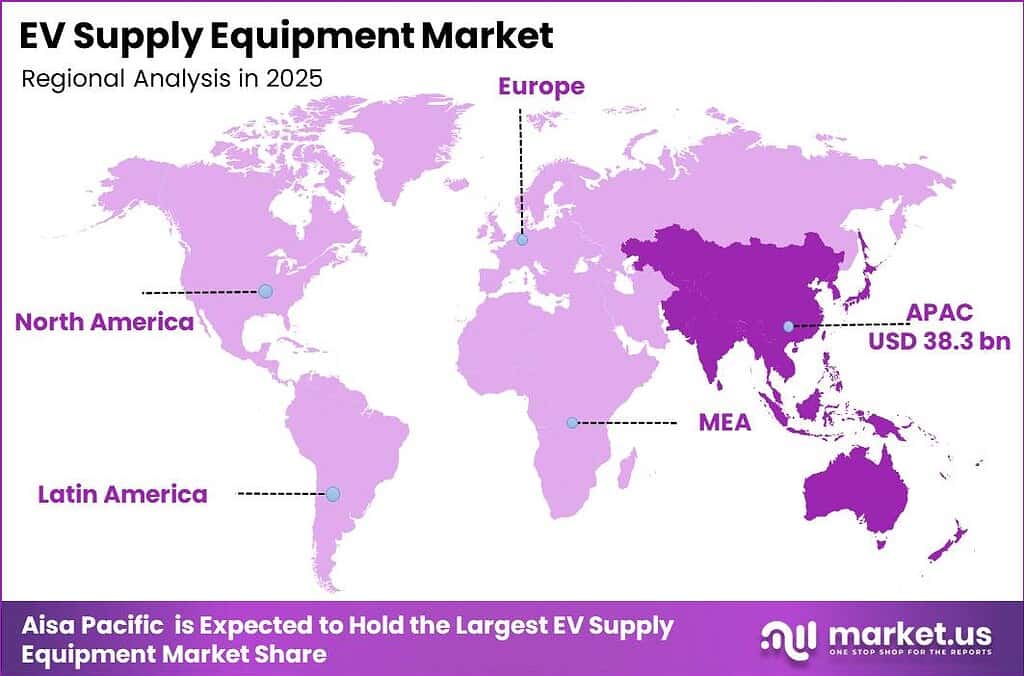
- Asia Pacific dominates the regional landscape with a 45.1% market share, valued at USD 38.34 Billion.
According to the IEA, the global public EV charging network exceeded 5 Million public charging points in 2024, with more than 1.3 Million chargers added during the year alone. This single-year addition signals that hardware procurement cycles are accelerating beyond initial government projections. Vendors with pre-qualified supply chains and scalable manufacturing will capture a disproportionate share of urgent deployment contracts.
As reported by the IEA, public EV charging infrastructure worldwide grew by more than 30% year-over-year in 2024. This rate of network expansion compresses the timeline for operators to establish geographic dominance before competitors lock in prime corridor locations. The U.S. Joint Office of Energy and Transportation confirms that all 50 U.S. states, the District of Columbia, and Puerto Rico have approved NEVI deployment plans, removing a major policy bottleneck and accelerating near-term hardware demand across every domestic corridor.
Power Analysis
AC Charging (Level 1 to 2) dominates with 56.7% due to lower cost and universal vehicle compatibility.
In 2025, AC Charging (Level 1 to 2) held a dominant market position in the By Power segment of the EV Supply Equipment Market, with a 56.7% share. The International Energy Agency reported that residential and workplace charging accounts for the majority of global EV energy delivery sessions, confirming AC infrastructure as the structural backbone of daily charging behavior. Vendors supplying AC equipment to property developers and fleet depot operators face a captive, high-volume procurement channel with multi-unit order sizes and recurring upgrade cycles.
DC Fast Charging (Level 2 to 3) is the fastest-growing sub-segment within the By Power segment. The US Department of Energy reports that DC fast charger deployments grew at a significantly faster rate than AC units in 2024, driven by corridor buildout programs and commercial fleet requirements. This acceleration signals an impending shift in revenue mix, where higher per-unit DC hardware prices and network service contracts will gradually increase average order values for equipment suppliers.
Other power categories, including ultra-fast charging, wireless inductive charging, and vehicle-to-grid (V2G) systems, represent emerging adoption zones rather than volume segments today. The US Department of Energy vehicle-to-grid integration assessment identifies V2G as capable of supplying frequency regulation services to the grid, a function that adds a second revenue stream beyond energy throughput. Early hardware manufacturers embedding bidirectional capability into current product lines will create switching barriers before this segment scales.
Product Type Analysis
Wall-Box / Fixed AC Charger dominates with 38.4% due to mass residential and workplace installation demand.
In 2025, Wall-Box / Fixed AC Charger held a dominant market position in the By Product Type segment of the EV Supply Equipment Market, with a 38.4% share. The US Alternative Fuels Data Center confirms that home charging represents the primary daily energy source for the majority of EV drivers in North America, establishing wall-box installations as a high-frequency, recurring procurement category. Property developers and employers mandating EV-ready infrastructure under updated building codes are expanding the addressable wall-box market beyond individual consumer purchases into bulk commercial orders.
EV Charging Kiosks are the fastest-growing product type within the By Product Type segment. The IEA reports that public DC fast-charging kiosk deployments grew faster than any other charger format in 2024, as retail, hospitality, and highway corridor operators competed to capture EV driver dwell time. This growth positions kiosk suppliers with remote diagnostics capability and high-power hardware as preferred vendors for site operators seeking uptime-backed service agreements alongside equipment sales.
Portable chargers serve EV drivers who lack access to fixed home or workplace installations, a segment that includes apartment residents, fleet field personnel, and early adopters in underserved suburban markets. The Electric Power Research Institute estimates tens of millions of US households lack dedicated parking for fixed charger installation, creating a structural addressable market for portable solutions that fixed-infrastructure programs cannot reach. Integrated charging systems, which embed EVSE into building electrical panels or grid-tied energy management units, round out the product landscape for commercial and industrial buyers seeking consolidated energy assets.
Charging Station Type Analysis
Normal / Standard AC Charging dominates with 60.2% due to widespread deployment across homes and workplaces.
In 2025, Normal / Standard AC Charging held a dominant market position in the By Charging Station Type segment of the EV Supply Equipment Market, with a 60.2% share. UNIDO manufacturing output data confirms that AC charging equipment production lines account for the largest unit volumes among all EVSE categories globally. The cost-per-port advantage of standard AC stations, combined with their compatibility with all current EV models, locks this sub-segment into high-volume repeat procurement cycles for residential developers and parking facility operators.
Super / Fast DC Charging is the fastest-growing charging station type, driven by corridor mandates and commercial fleet depot requirements that demand faster energy turnaround than AC infrastructure can provide. The European Union’s AFIR regulation requires charging stations on the TEN-T core network to provide at least 400 kW total output by 2025, rising to 600 kW by 2027, creating a mandatory hardware upgrade cycle across European highway networks. Suppliers capable of delivering compliant high-power DC hardware at scale will benefit from a policy-enforced replacement wave independent of organic demand signals.
Inductive / Wireless Charging remains an early-stage sub-segment, currently deployed in controlled pilots across autonomous vehicle programs and select public transit routes rather than mass-market commercial sites. The US Department of Energy reports that wireless power transfer for EVs is advancing through SAE J2954 standardization, which provides a regulatory pathway for commercial deployment. Manufacturers investing in wireless charging IP today are building a licensing and supply position for a segment that scales once standardization eliminates interoperability risk for site operators.
Application Analysis
Residential / Home Charging dominates with 55.6% due to daily overnight charging convenience and low installation cost.
In 2025, Residential / Home Charging held a dominant market position in the By Application segment of the EV Supply Equipment Market, with a 55.6% share. The IEA Global EV Outlook 2025 confirms that home charging accounts for the majority of total EV energy delivered globally, reflecting consumer preference for overnight convenience over public session costs. This concentration means that residential electrical contractors, property developers, and smart home platform providers hold structural channel advantages over pure-play public charging operators in the current market configuration.
Commercial / Public Charging is the fastest-growing application segment, as fleet operators, retailers, and highway corridor developers invest in high-capacity charging to serve drivers who cannot charge at home or require mid-journey energy top-ups. The US Alternative Fuels Data Center recorded over 204,000 publicly accessible EV charging ports in the United States as of April 2025, reflecting the scale of public network buildout already underway. This expansion creates recurring demand for network management software, payment processing integrations, and uptime service contracts that generate higher gross margin than hardware sales alone.
Key Market Segments
By Power
- AC Charging (Level 1 to 2)
- Level 1
- Level 2
- DC Fast Charging (Level 2 to 3)
- Level 2 DC
- Level 3 DC
- Other / Ultra-Fast and Emerging
- Wireless
- V2G
By Product Type
- Wall-Box / Fixed AC Charger
- EV Charging Kiosk
- Portable Chargers
- Integrated
By Charging Station Type
- Normal / Standard AC Charging
- Super / Fast DC Charging
- Inductive / Wireless Charging
By Application
- Residential / Home Charging
- Commercial / Public Charging
Regional Analysis
Asia Pacific Dominates the EV Supply Equipment Market with a Market Share of 45.1%, Valued at USD 38.34 Billion
Asia Pacific commands the largest regional share at 45.1%, valued at USD 38.34 Billion in 2025. China’s state-directed charging network expansion and India’s accelerating EV adoption under national electrification policy anchor this dominance. The region’s combination of manufacturing cost leadership and domestic policy-driven demand creates a self-reinforcing supply-and-install ecosystem that international entrants will find structurally difficult to displace.
Europe is the fastest-growing regional market, supported by binding regulatory infrastructure mandates that convert policy targets into confirmed hardware procurement. The IEA confirms that Europe surpassed 1 Million public EV charging points during 2024, and the Netherlands alone operated more than 180,000 public charging points by year-end, making it Europe’s largest national public charging network. In January 2026, EVBox announced a strategic partnership with Dream Energy to deploy high-power EV charging infrastructure across France and Europe, signaling that private capital is now aligning with regulatory timelines to accelerate rollout. The EU’s AFIR requires at least one 150 kW charging station every 60 km along the TEN-T core road network, creating a legally enforceable installation pipeline that reduces demand uncertainty for European hardware suppliers.
North America holds a strategically significant position underpinned by federal funding commitments and a rapidly expanding port count. The US recorded over 204,000 publicly accessible EV charging ports as of April 2025, with all 50 states, the District of Columbia, and Puerto Rico holding approved NEVI deployment plans. This policy coverage removes geographic gaps in federally subsidized procurement and ensures that every US state represents an active near-term demand zone for EVSE suppliers.
Key Regions and Countries
North America
- US
- Canada
Europe
- Germany
- France
- The UK
- Spain
- Italy
- Rest of Europe
Asia Pacific
- China
- Japan
- South Korea
- India
- Australia
- Rest of APAC
Latin America
- Brazil
- Mexico
- Rest of Latin America
Middle East and Africa
- GCC
- South Africa
- Rest of MEA
Market Dynamics
Market Opportunity Analysis - Underserved applications and emerging regions present first-mover capture windows for investors and new entrants
Commercial and public charging holds a minority application share today at roughly 44.4% of the market, yet it is the fastest-growing application segment, fueled by corridor mandates and fleet depot requirements that residential networks cannot serve. This gap between current share and growth velocity signals an underexploited procurement channel for operators who specialize in high-power public site development. Vendors offering turnkey site deployment with uptime service agreements hold the strongest position to capture this segment’s expansion before large utility-backed networks dominate corridor contracts.
DC fast-charging and super-charging station types collectively represent a minority of the installed base today, yet they carry the highest per-unit hardware values and the most defensible recurring service margins in the EVSE market. The policy-mandated power output escalation under EU AFIR, requiring 600 kW total output by 2027, creates a legally enforced replacement and upgrade cycle. Suppliers with certified high-power hardware already on approved vendor lists will face far less competition than those entering after the compliance wave peaks.
Inductive and wireless charging stations remain a near-zero share sub-segment today, which means the entire future volume of this technology is available to manufacturers who establish hardware certification and pilot deployment relationships before commercial standards finalize. This creates a disproportionately low-cost entry window relative to the long-term addressable market, since post-standardization entry will require displacing incumbents rather than building a greenfield position. Autonomous vehicle and public transit operators are the most tractable early customers, providing volume commitments that justify manufacturing scale-up.
Asia Pacific controls 45.1% of current market value, yet India, Southeast Asia, and secondary Chinese cities remain structurally underserved relative to their EV parc growth rates. These sub-regional white spaces sit within the dominant regional block but receive a fraction of the investment flowing to first-tier markets. Operators and manufacturers who establish supply chain and installer partnerships in these sub-markets ahead of policy-driven network mandates will benefit from lower competition intensity and higher long-term volume potential than saturating already-dense urban markets in China’s Tier 1 cities.
Technology and Innovation Landscape - AI-driven energy management, open protocols, and grid-integrated hardware redefine competitive positioning in EV supply equipment
AI-powered smart charging platforms optimize real-time energy loads and charging schedules across networked ports, reducing peak demand charges that represent a primary operating cost for public site operators. This technology enables charge point operators to compress per-session energy costs without reducing driver throughput, directly improving site-level operating margins. Operators who deploy AI load management at scale gain a cost structure advantage that pure hardware vendors without software capability cannot match on unit economics alone.
Open Charge Point Protocol-based interoperable charging ecosystems are becoming the industry standard, as regulatory bodies in the US and EU push for open network access across competing operator platforms. OCPP adoption removes the proprietary lock-in that previously allowed large network operators to exclude competitors from their installed hardware base. This shift creates an opportunity for software-layer specialists to build billing, roaming, and energy management services that operate across all OCPP-compliant networks regardless of hardware brand, generating recurring revenue independent of equipment sales cycles.
Plug and Charge authentication under ISO 15118 automates the connection, identification, and payment sequence at the charging station, reducing session friction to a physical cable plug-in with no app or card interaction required. This standard directly addresses the payment and roaming fragmentation challenge that suppresses public charger utilization rates. Hardware manufacturers who embed ISO 15118 compliance into current production runs create a product differentiation advantage that will become a baseline procurement requirement once large fleet operators and corridor program administrators mandate frictionless authentication in their vendor specifications.
In May 2026, Siemens unveiled a 1.25 MW solar-plus-storage microgrid integrating battery storage, smart energy management, and EV charging infrastructure at its North Carolina facility, demonstrating that co-located renewable generation can serve as both a cost hedge against grid electricity prices and a resilience asset for uninterrupted charging operations. This architecture allows commercial site operators to decouple charging economics from utility tariff volatility. Manufacturers who design charging hardware with native microgrid integration interfaces will capture procurement priority from energy-intensive commercial operators seeking grid-independent charging capability.
Drivers
Federal corridor funding represents the most immediate procurement accelerator in the EV supply equipment market. The reactivated $5 Billion NEVI program, administered by FHWA and funded through the Infrastructure Investment and Jobs Act, released a FY2026 apportionment of $885 Million after the February 2025 disbursement pause was resolved. The program’s 80% federal cost-share on eligible ports materially de-risks operator capital expenditure and compresses payback horizons that previously stalled rural corridor buildout.
Beyond corridor funding, mandatory EV-ready building codes and rapid commercial fleet electrification commitments are expanding the addressable hardware market across both residential and depot-based charging. Vehicle sales growth of battery electric vehicles requires scalable Level 2 and ultra-fast charging networks, pushing charge point operators to accelerate installations before network capacity lags vehicle parc expansion. This supply-demand gap between EV adoption and charger availability directly rewards suppliers with pre-qualified hardware and contracted installer networks.
| Driver | (~) % Impact on CAGR Forecast | Geographic Relevance | Impact Timeline |
|---|---|---|---|
| Federal corridor funding disbursement (NEVI) | +6.5% | United States | Short term (2 years or less) |
| Accelerating light-duty EV parc expansion | +5.8% | China, Europe, North America | Short term (2 years or less) |
| DC fast-charging power density escalation | +4.2% | Global | Medium term (2 to 4 years) |
| Regulatory uptime and interoperability mandates | +3.0% | United States, European Union | Short term (2 years or less) |
| Public charging network densification | +4.9% | China, India | Medium term (2 to 4 years) |
| Fleet and MDHD electrification commitments | +3.4% | United States, Europe | Medium term (2 to 4 years) |
Restraints
Grid interconnection queue delays represent the most binding structural constraint on EVSE deployment timelines. Megawatt-class and clustered DC fast-charging loads frequently exceed available feeder capacity, triggering substation upgrades that utilities cannot schedule against near-term demand. Operators absorb carrying costs on installed but unenergized hardware, compressing margins and delaying capital expenditure recognition beyond initial project pro forma windows. This pattern stalls otherwise committed orders and forces project sponsors to reprice return assumptions upward.
Distribution transformer supply scarcity amplifies interconnection delays by extending the lead time for site energization beyond what standard project finance timelines allow. Elevated cost of capital, combined with low station utilization economics at early-stage sites, further narrows the viable investment window for new network operators. Import tariff exposure on EVSE components adds procurement cost uncertainty, particularly for US-based operators sourcing hardware with Asian-manufactured electronics. These compounding restraints slow network expansion in markets where demand-side signals are otherwise strong.
| Restraint | (~) % Impact on CAGR Forecast | Geographic Relevance | Impact Timeline |
|---|---|---|---|
| Grid interconnection queue delays | -5.5% | United States, India | Medium term (2 to 4 years) |
| Elevated cost of capital | -4.0% | Global | Short term (2 years or less) |
| Low station utilization economics | -3.6% | North America, Europe | Short term (2 years or less) |
| Import tariff exposure on components | -2.8% | United States | Short term (2 years or less) |
| Distribution transformer supply scarcity | -3.2% | North America, Europe | Medium term (2 to 4 years) |
Challenges
Charger reliability and uptime failure across the public DC fast-charging fleet is the highest-drag operational friction on market growth. FHWA now mandates an average annual uptime floor of at least 97% per port under NEVI compliance rules. Meeting this standard requires continuous remote diagnostics, spare-part logistics, and field servicing that add significant recurring cost per port and suppress operating margins. Operators who fail the uptime threshold risk losing access to federal funding eligibility, creating a compliance risk that compounds the financial burden.
Payment and roaming fragmentation prevents EV drivers from using chargers across competing networks without separate accounts or RFID credentials. This friction reduces session frequency at public sites and depresses utilization rates below the threshold needed for positive unit economics. Standards and connector transitions add further cost, as operators must support multiple connector formats during the migration to a single dominant standard. Cybersecurity compliance overhead creates a long-tail cost burden, particularly for operators subject to both US federal and EU NIS2 security requirements.
| Challenge | (~) % CAGR Friction Drag | Geographic Relevance | Mitigation Horizon |
|---|---|---|---|
| Charger reliability and uptime | -3.4% | North America, Europe | Medium term (2 to 4 years) |
| Skilled installer talent deficit | -2.6% | United States, Europe | Medium term (2 to 4 years) |
| Payment and roaming fragmentation | -2.0% | Global | Medium term (2 to 4 years) |
| Standards and connector transition | -2.3% | North America | Medium term (2 to 4 years) |
| Cybersecurity compliance overhead | -1.8% | United States, European Union | Long term (4 years or more) |
Opportunities
Bidirectional vehicle-to-grid infrastructure represents the largest untapped revenue opportunity in the EVSE market. The US Department of Energy vehicle-to-grid integration assessment establishes that aggregated EV batteries can supply frequency regulation and defer distribution upgrades, a value stream not yet embedded in standard EVSE unit economics. Grid-service and capacity payments carry structurally higher gross margins than kilowatt-hour energy resale, which means bidirectional hardware suppliers can amortize inverter cost premiums across recurring ancillary-service income rather than thin throughput margins.
Megawatt Charging System deployment for electric heavy-duty trucks and logistics fleets, solar-plus-storage microgrid integration at commercial sites, and wireless inductive charging for autonomous mobility each represent addressable segments with minimal current competition. Emerging-market rural network white space in India and Southeast Asia offers long-term volume upside for operators willing to accept extended payback periods in exchange for first-mover positioning. Software and data subscription layers add a recurring revenue stream that hardware-only suppliers currently leave uncaptured at every installed port.
| Opportunity | (~) % Potential CAGR Upside | Geographic Relevance | Execution Window |
|---|---|---|---|
| Vehicle-to-grid and grid-service monetization | +4.5% | United States, Europe | Long term (4 years or more) |
| Depot charging for logistics fleets | +3.8% | North America, Europe | Medium term (2 to 4 years) |
| Colocated solar and storage buffering | +3.0% | India, United States | Medium term (2 to 4 years) |
| Software and data subscription layers | +2.7% | Global | Medium term (2 to 4 years) |
| Emerging-market rural network white space | +3.3% | India, Southeast Asia | Long term (4 years or more) |
Key Company Insights
ChargePoint manages over 342,000 activated charging ports globally, giving it the largest software-managed network footprint among independent charge point operators. This scale creates a data advantage in energy load optimization and uptime prediction that smaller networks cannot replicate. In July 2025, ChargePoint launched Safeguard Care, a predictive monitoring service targeting the FHWA’s 97% uptime compliance threshold, directly tying its service offering to federal funding eligibility and creating a defensible recurring revenue stream.
ABB holds a structural advantage in the high-power DC fast-charging segment through its power electronics manufacturing capability and global service infrastructure. This positions ABB to supply both the hardware and grid-integration systems that large fleet and corridor operators require from a single vendor. In May 2025, ABB introduced BESS-as-a-Service to support renewable-powered EV charging infrastructure without requiring upfront capital investment from site operators, lowering the adoption barrier for solar-integrated charging sites and expanding ABB’s addressable market beyond pure hardware sales.
Key Players
- ChargePoint
- ABB
- Siemens
- Tesla
- Schneider Electric
- Eaton
- Webasto
- Blink Charging
- EVBox
- Tritium
- BP
- Shell
- Engie
- Delta Electronics
- Wallbox
Recent Developments
- May 2025: ChargePoint and Eaton formed a strategic partnership to jointly deliver integrated EV charging, electrical infrastructure, and V2X solutions across North America and Europe.
- August 2025: ChargePoint and Eaton launched the Express Grid ultrafast DC charging architecture, delivering up to 600 kW charging with vehicle-to-everything (V2X) capability.
Geopolitical Impact Analysis
As reported by the WTO, global goods trade faced tariff escalation in 2025 that directly increased component costs for EVSE manufacturers reliant on Asian-sourced power electronics, semiconductors, and copper wiring harnesses. The United States imposed import tariffs that Market.us estimates added a -2.8% drag on the CAGR forecast specifically attributed to component cost exposure. According to World Bank infrastructure investment data, supply chain rerouting through alternative manufacturing hubs in Southeast Asia extended procurement lead times by an average of 8 to 12 weeks for US-based EVSE assemblers, compressing installation schedules for federally funded corridor projects.
UNCTAD trade and development data indicates that energy price volatility linked to ongoing geopolitical tensions in Eastern Europe and the Middle East increased electricity procurement costs at grid-tied charging sites across Europe by a measurable margin during 2024 and into 2025. The IEA reported that European wholesale electricity prices remained elevated relative to pre-conflict baselines, creating operating cost pressure for charge point operators whose business models depend on thin energy margin between grid purchase price and driver session fee. This volatility accelerates the commercial case for co-located solar and battery storage at charging sites, shifting capital allocation toward energy-independent infrastructure designs that reduce exposure to spot market electricity price swings.
Report Scope
| Report Features | Description |
|---|---|
| Market Value (2025) | USD 85.00 Billion |
| Forecast Revenue (2035) | USD 1,366.10 Billion |
| CAGR (2026-2035) | 32.0% |
| Base Year for Estimation | 2025 |
| Historic Period | 2020-2024 |
| Forecast Period | 2026-2035 |
| Report Coverage | Revenue Forecast, Market Dynamics, Market Opportunity Analysis, Technology and Innovation Landscape, Competitive Landscape, Recent Developments |
| Segments Covered | By Power (AC Charging Level 1 to 2, DC Fast Charging Level 2 to 3, Other / Ultra-Fast and Emerging including Wireless and V2G), By Product Type (Wall-Box / Fixed AC Charger, EV Charging Kiosk, Portable Chargers, Integrated), By Charging Station Type (Normal / Standard AC Charging, Super / Fast DC Charging, Inductive / Wireless Charging), By Application (Residential / Home Charging, Commercial / Public Charging) |
| Regional Analysis | North America (US and Canada), Europe (Germany, France, The UK, Spain, Italy, and Rest of Europe), Asia Pacific (China, Japan, South Korea, India, Australia, and Rest of APAC), Latin America (Brazil, Mexico, and Rest of Latin America), Middle East and Africa (GCC, South Africa, and Rest of MEA) |
| Competitive Landscape | ChargePoint, ABB, Siemens, Tesla, Schneider Electric, Eaton, Webasto, Blink Charging, EVBox, Tritium, BP, Shell, Engie, Delta Electronics, Wallbox |
| Customization Scope | Customization for segments, region / country-level will be provided. Additional customization can be done based on requirements. |
| Purchase Options | We have three licenses to opt for: Single User License | Multi-User License (Up to 5 Users) | Corporate Use License (Unlimited User and Printable PDF) |





































