


Report Overview
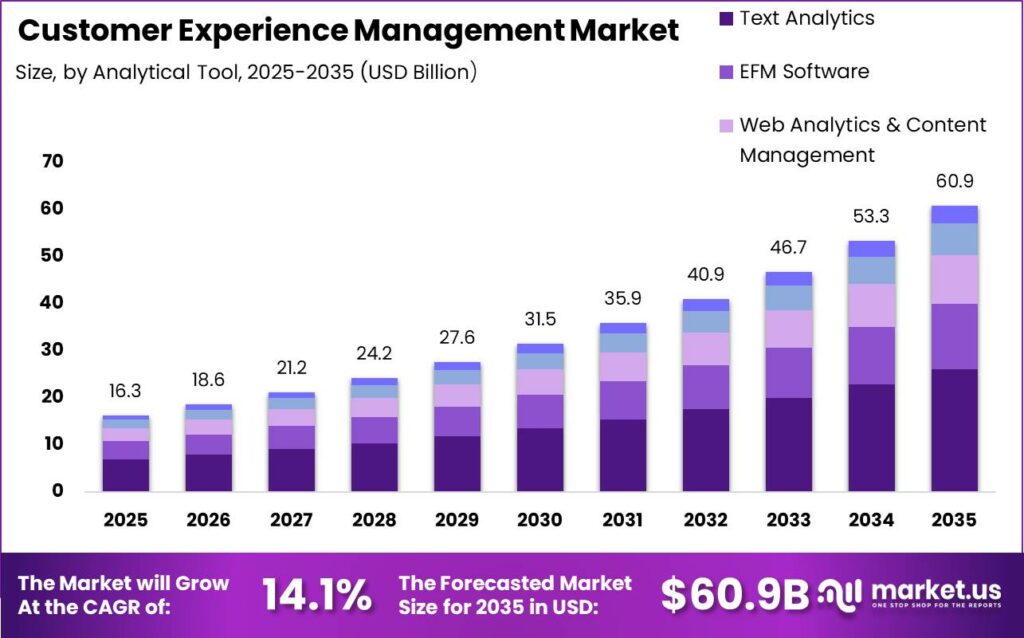
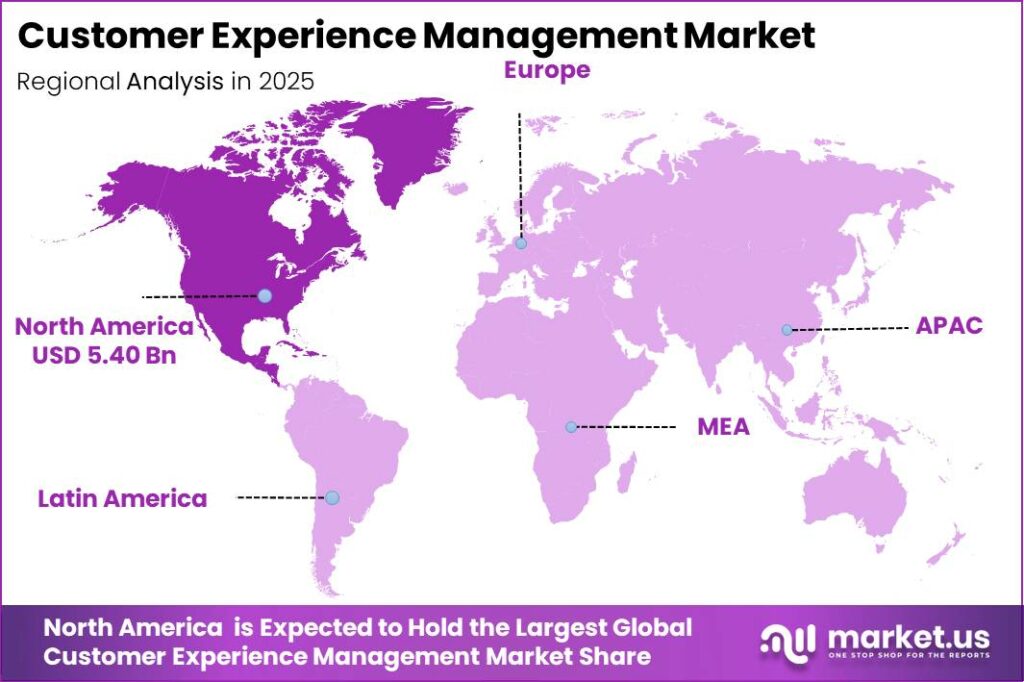
In 2025, the Customer Experience Management Market was valued at USD 16.3 billion. The market is projected to grow at a CAGR of 14.1% during 2026–2035, reaching approximately USD 60.9 billion by 2035. North America dominated the global market in 2025, accounting for more than 33.12% of the total market share and generating approximately USD 5.40 billion in revenue.
This outlook is supported by strong, measurable growth in digital usage and services. According to the International Telecommunication Union (ITU), global internet users reached around 6 billion in 2025, up from 5.8 billion in 2024, meaning an extra 240 million people came online in a single year.
Each new online user creates dozens of additional monthly interactions with banks, retailers, telecoms, and public services, which firms must monitor and improve using CEM tools. At the same time, UNCTAD reports that global e‑commerce sales were about USD 27 trillion in 2022, equal to roughly 30% of world GDP, showing how much economic activity now depends on digital customer journeys.
The World Bank’s data indicates that services account for about 66% of global GDP as of 2024, up from around 62% in 2011, adding several trillion dollars of service output that relies on ongoing customer relationships rather than one‑off product sales. The Ministry of Finance notes that services contributed roughly 55% to total Gross Value Added in FY25, with post‑pandemic services growth averaging 8.3% per year, illustrating how fast service economies are expanding.
Key Takeaway
- The Global Customer Experience Management Market is projected to grow from USD 16.3 Billion in 2025 to USD 60.9 Billion by 2035, at a 14.1% CAGR.
- Text Analytics dominates the analytical tools segment with a 42.78% share.
- Call Centers lead the technology touchpoint segment with a 33.56% share.
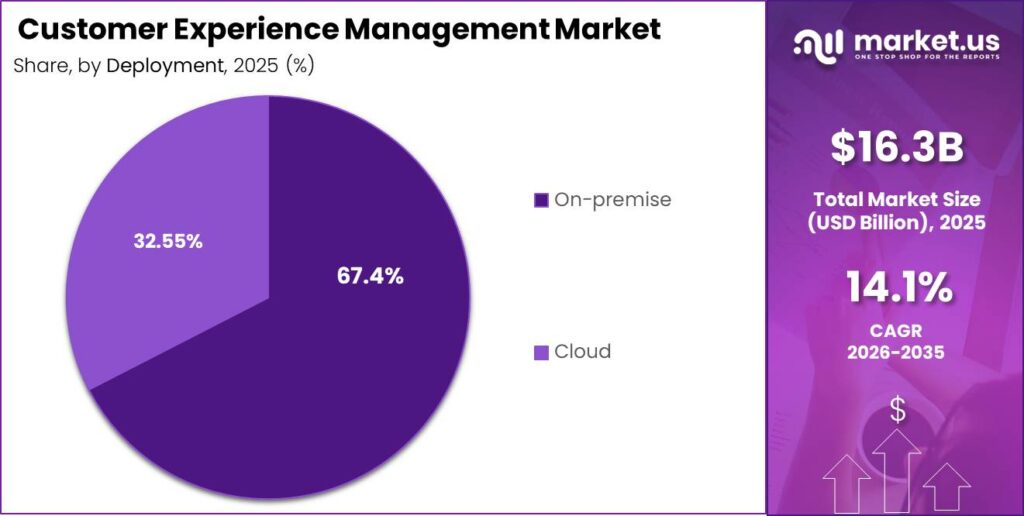
- On-premise deployment dominates the deployment segment with a 67.45% share.
- Retail holds the largest end-use industry share with a 26.78% share.
- North America leads the regional market with a 33.12% share, valued at USD 5.40 Billion in 2025.
Analytical Tool
Text analytics commands the dominant 42.78% share of analytical tools in customer experience management because enterprises now capture trillions of words of unstructured customer feedback across channels, and this data cannot be operationalized without specialized text-mining engines.
In retail alone, global e-commerce sales surpassed USD 5.8 trillion in 2023, with much of customer interaction occurring via reviews, chats, emails and social media comments that are inherently text-based, forcing brands to deploy sentiment analysis, intent detection and topic modeling at scale to close experience gaps and protect revenue streams.
Web analytics and content management tools are expanding fastest as customer journeys migrate online: total global internet users exceeded 5.4 billion in 2024, and organizations must continuously test, personalize and optimize page layouts, content assets and digital funnels to reduce churn and maximize conversion, which directly ties CX outcomes to web behavior tracking and content orchestration.
Technology
The Call Centers technology segment accounts for approximately 33.56% of deployed customer experience management (CEM) technology, underscoring its role as the dominant operational backbone for large-scale customer service.
The scale of call-center technology in customer experience management is evidenced by its workforce and interaction volumes rather than by revenue alone: globally, there are an estimated 17–18 million contact center agents, with several million concentrated in Asia-Pacific hubs that support outsourced customer service for banking, telecom, retail and public utilities.
With typical agents handling 50–80 inbound calls per day, this translates into hundreds of billions of human-to-agent customer interactions annually, making call-center platforms the primary operational environment where service quality, issue resolution, and experience metrics such as customer satisfaction and Net Promoter Score are actually produced and measured.
Social media platform technologies, by contrast, are the fastest-growing CEM technology segment because they align directly with the explosive rise of social media usage and time spent online. As of 2026, approximately 5.79 billion social media identities exist globally, representing nearly 70% of the world’s population and indicating that social channels have become the default interface for brand-consumer interactions.
Deployment
On-premise deployments currently command roughly two-thirds of global customer experience management (CEM) revenues, aligning with estimates of around 67.45% share for on-premise models in recent CXM deployment breakdowns. This dominance reflects the reality that the largest CX-intensive verticals such as BFSI, telecom, and healthcare still operate mission-critical customer data on in-house infrastructure and must comply with stringent data sovereignty and security mandates.
At the same time, the cloud deployment model is unequivocally the fastest-growing segment: global CEM spending is forecast to rise from about USD 13–18 billion mid-decade to over USD 35–70 billion by the early to mid-2030s, with double-digit CAGRs largely driven by cloud-based platforms.
This trajectory mirrors the broader enterprise IT shift, where total cloud expenditure across private and public environments is expected to surpass USD 1 trillion, growing at roughly 16% annually, enabling elastic, AI-enabled, omnichannel CX without equivalent capex.
End Use Industry
The retail end-use segment holds a dominant 26.78% share of the customer experience management (CXM) market because retail is structurally the largest, most CX-sensitive demand center in the consumer economy. Global retail and e-commerce sales together reach tens of trillions of dollars annually, with UNCTAD estimating global e-commerce alone at USD 26.7 trillion and online retail’s share of total retail sales rising from 16% to 19% in 2020.
Empirical research further shows that customer experience in retail has a strong positive relationship with satisfaction, repurchase intention, loyalty, and brand equity, tightening the link between CXM investment and top-line growth. Together, the sheer economic scale of retail, its data-rich omnichannel environment, and the proven revenue and loyalty elasticity to experience improvements justify why retail commands and maintains a dominant percentage share of global CXM deployments.
Key Market Segments
-
Analytical Tool
- Text Analytics
- EFM Software
- Web Analytics & Content Management
- Speech Analytics
- Other Analytical Tools
-
Technology
- Call Centers
- Stores/Branches
- Social Media Platform
- Web Services
- Mobile
- Other Touch Point Types
-
Deployment
- On-premise
- Cloud
-
End Use Industry
- BFSI
- Healthcare
- Retail
- Manufacturing
- Construction, Real Estate & Property Management
- IT & Telecom
- Energy & Utilities
- Others
Market Dynamics
Drivers
| Driver | (~) % Impact on CAGR | Geographic Relevance | Impact Timeline |
|---|---|---|---|
| Agentic & Generative AI Integration in CX Workflows | +3.2% | Global, led by North America & Western Europe | Short term (≤ 2 years) |
| Omnichannel Engagement as Baseline Customer Expectation | +2.4% | Global, acceleration in Asia-Pacific & Latin America | Short term (≤ 2 years) |
| Shift from Cost-Center to Revenue-Generating CX Model | +1.8% | North America, Western Europe, ANZ | Medium term (2–4 years) |
| Rising Digital-First Consumer Behavior Post-Pandemic Normalization | +1.5% | Global, concentrated in Southeast Asia & India | Short term (≤ 2 years) |
| CX Platform Consolidation into Customer Operating Clouds | +1.1% | North America, Northern Europe | Medium term (2–4 years) |
| Board-Level CX ROI Accountability & CFO-Linked Measurement Mandates | +0.9% | North America, UK, Australia | Short term (≤ 2 years) |
Agentic & Generative AI Integration in CX Workflows
The structural acceleration of agentic and generative AI deployment inside customer experience workflows constitutes the single most potent active driver reshaping the CXM market today. As of early 2026, 20% of enterprises have already deployed agentic AI across some or most of their CX activities, and 38% of consumers report trusting AI agents to manage end-to-end interactions figures that represent a qualitative leap from the narrow-task chatbot adoption that characterized 2023–2024.
The commercial mechanism is direct: by replacing legacy Interactive Voice Response systems and rule-based bots with autonomous agents capable of cross-system action (adjusting billing records, rebooking itineraries, resetting credentials without human escalation), organizations are compressing cost-per-contact by an estimated 30–45% while simultaneously enabling personalization at a scale no FTE-based model can replicate.
This dual effect operational cost reduction alongside revenue-uplift via upsell and retention is accelerating platform migration cycles from the historical 3–5 year enterprise refresh cycle to under 18 months in early-adopter verticals such as BFSI, telecom, and e-commerce. Pricing models are decoupling from per-seat FTE constructs toward per-journey and CX-as-a-Service bundles.
Restraints
| Restraint | (~) % Impact on CAGR | Geographic Relevance | Impact Timeline |
|---|---|---|---|
| Proliferating Data Privacy & AI Governance Regulations | -2.3% | EU, UK, India (DPDPA), Brazil (LGPD), California (CPRA) | Short term (≤ 2 years) |
| High Total Cost of Ownership for Enterprise CXM Deployments | -1.9% | Global, most acute in SMB & mid-market segments | Short term (≤ 2 years) |
| Budget Freeze & CapEx Deferral Under Macro Uncertainty | -1.2% | North America, Western Europe | Short term (≤ 2 years) |
| Consumer Distrust Toward AI-Driven Interactions | -0.9% | Global, elevated in regulated consumer sectors | Medium term (2–4 years) |
| Fragmented Vendor Ecosystem Creating Buyer Paralysis | -0.7% | North America, Europe, ANZ | Medium term (2–4 years) |
Proliferating Data Privacy & AI Governance Regulations
Multi-jurisdictional data privacy and AI governance mandates represent the hardest structural brake on near-term CXM market expansion, operating not as a future risk but as a live compliance cost that directly compresses deployment budgets today.
The EU’s GDPR now supplemented by the EU AI Act’s tiered risk obligations effective August 2026 for high-risk AI use cases including automated customer profiling and decision-making imposes penalties of up to 4% of global annual turnover for data mishandling, while India’s Digital Personal Data Protection Act (DPDPA), which gained enforcement teeth in 2025, mandates purpose limitation, consent management infrastructure, and data localization norms that require CXM platforms to architect separate regional data residency environments.
Operationally, enterprises deploying omnichannel CXM stacks must now maintain granular, audit-ready consent records across every interaction channel voice, chat, web, in-app with documented legal bases for each data processing activity; failure to instrument this from the platform layer forces costly post-deployment remediation, with compliance retrofits estimated to add 15–25% to total project cost.
Challenges
| Challenge | (~) % CAGR | Geographic Relevance | Mitigation Horizon |
|---|---|---|---|
| Legacy System Integration Complexity | -2.1% | Global, most acute in BFSI & public sector | Long term (≥ 4 years) |
| CX Talent & AI Skills Deficit | -1.6% | Global, most severe in emerging markets | Long term (≥ 4 years) |
| CX ROI Attribution & Boardroom Credibility Gap | -1.3% | Global, elevated in cost-conscious industries | Medium term (2–4 years) |
| Survey Fatigue & Passive Signal Transition | -0.8% | North America, Western Europe, ANZ | Medium term (2–4 years) |
| Cross-Channel Context Continuity Failure | -0.7% | Global | Short term (≤ 2 years) |
Legacy System Integration Complexity
Legacy system integration complexity functions as the deepest structural ceiling on the CXM market’s maximum growth potential, independent of budget availability or regulatory posture; it is a continuous, multi-year engineering challenge that no single procurement decision or compliance framework can resolve.
Bridging these environments requires custom middleware, ETL pipelines, and Enterprise Service Bus configurations that consume 30–50% of a CXM implementation budget before any front-end experience layer is deployed, and that figure escalates when compliance-mandated audit trails must be retrospectively instrumented across both the legacy and new environments.
Implementation lead times for full omnichannel CXM go-live in enterprise accounts with legacy infrastructure typically run 12–24 months versus 3–6 months for cloud-native organizations, compressing the vendor’s annual contract value ramp and increasing churn risk during the extended integration window.
Opportunities
| Opportunity | (~) % CAGR | Geographic Relevance | Execution Window |
|---|---|---|---|
| Vertical CXM Platforms for BFSI, Healthcare & Public Sector | +2.6% | North America, EU, India, Southeast Asia | Medium term (2–4 years) |
| SMB & Mid-Market CXM Adoption via Lightweight SaaS | +2.0% | India, Southeast Asia, Latin America, MENA | Short term (≤ 2 years) |
| CXM-Embedded Revenue & Collections Monetization | +1.5% | North America, Western Europe | Medium term (2–4 years) |
| Synthetic Customer Twin & Predictive Journey Testing | +1.2% | North America, Northern Europe | Long term (≥ 4 years) |
| CXM Platform M&A Roll-Ups & Ecosystem Orchestration Plays | +1.0% | Global, PE & strategic acquirers in North America & Europe | Short term (≤ 2 years) |
| Emotion & Behavioral AI for Passive Experience Sensing | +0.8% | North America, East Asia, Western Europe | Long term (≥ 4 years) |
Vertical CXM Platforms for BFSI, Healthcare & Public Sector
The opportunity to build and scale industry-specific, compliance-native CXM platforms for BFSI, healthcare, and public-sector verticals represents the largest single pocket of unexploited white space in the current market landscape; it is explicitly future and untapped because the dominant installed base of CXM platforms today is horizontal in architecture.
A purpose-built vertical CXM stack eliminates the 15–25% compliance remediation cost premium typical of horizontal deployments and can compress enterprise onboarding from 12–18 months to 4–6 months by delivering pre-certified data models and workflow templates for each sector.
The unit-economic shift is material: vertical SaaS platforms in adjacent categories consistently command net revenue retention rates of 115–135% versus the 95–110% range typical of horizontal enterprise SaaS, driven by higher switching costs, deeper workflow embeddedness, and the ability to bundle regulatory update services as recurring revenue streams.
Geopolitical Impact Analysis
The Customer Experience Management (CEM) market faces increasing infrastructure and operational cost pressures due to geopolitical tensions, with Section 301 tariffs of 7.5%–25% on Chinese server components, Section 232 duties of 25% on steel and 10% on aluminum, and an estimated USD 6 billion tariff burden on AI-capable data center infrastructure in 2025 impacting cloud platforms, SaaS pricing, and enterprise deployments.
Advanced semiconductor export controls introduced in 2022 and further tightened through 2024 have disrupted GPU and high-performance chip availability for AI-enabled CEM solutions, while IMF analysis suggests geo-economic fragmentation could reduce long-term global output by up to 7% of GDP, with advanced economies facing permanent losses of up to 3%.
Global logistics and energy challenges are further affecting CEM infrastructure, as the Red Sea crisis reduced container traffic by approximately 70%–75%, increased freight rates by 30%, and extended Asia-Europe shipping timelines by 10–14 days. Meanwhile, data center electricity consumption is projected to increase from 415 TWh in 2024 to 945 TWh by 2030, driven by AI workloads and rising cloud infrastructure demand.
Regional Analysis
North America dominates the global Customer Experience Management (CEM) market with an estimated 33.12% share and approximately USD 5.40 billion in revenue, supported by strong digital maturity and enterprise technology adoption.
The U.S. Department of Transportation reported around USD 509.2 billion in public and private transportation infrastructure and equipment investment in 2023, supporting demand for digital services, analytics, and customer-focused platforms.
Global digital adoption is also accelerating, with India surpassing 750 million internet users, more than 650 million smartphone users, and UPI transactions exceeding 10 billion monthly transactions in August 2023, increasing demand for seamless digital experiences.
Asia Pacific is the fastest-growing CEM market, driven by government-backed digital transformation and expanding connectivity. India’s Digital India initiative received investments of approximately INR 14,903 crore (over USD 1.7 billion) between 2021 and 2026 for digital infrastructure, e-governance, and connectivity expansion.
The region’s digital growth is further supported by more than 750 million internet users, a 400% increase in rural data consumption between 2020–21, and rapidly growing UPI digital payment activity, accelerating adoption of AI-driven engagement tools and customer analytics solutions across APAC.
Key Players Analysis
Salesforce, Adobe, and SAP lead the Tier-1 Customer Experience Management (CEM) market, collectively controlling an estimated 45–55% of enterprise-grade CX platform spending through integrated CRM, marketing, and analytics ecosystems. Salesforce reported FY2025 revenue of $37.9 billion, with $35.7 billion from subscription and support (94.2%), supported by over 150,000 business customers, approximately 20.7% CRM market share, and Service Cloud revenue exceeding $9 billion.
Adobe’s Digital Experience segment generated $5.37 billion in revenue in FY2024, growing 10% YoY, with subscription revenue of $4.86 billion (12% YoY growth), while Q3 FY2025 Digital Experience revenue reached $1.48 billion and Experience Platform ARR increased by more than 40% YoY. SAP strengthened its CX position with €21.02 billion cloud revenue in 2025 and projected €25.8–26.2 billion in 2026 (23–25% growth), leveraging its CX portfolio integrated with ERP systems.
Tier-2 CX providers, including independent experience analytics and contact-center platforms, typically generate sub-$1–2 billion CX-specific revenues but achieve high-teens to mid-20% growth through conversational AI, vertical solutions, and specialized analytics. Overall, Tier-1 vendors capture approximately 60–70% of global CEM license and subscription revenues, while Tier-2 players account for 30–40%, mainly targeting flexible and best-of-breed deployments.
Salesforce’s FY2025 operating cash flow of $13.1 billion (28% YoY growth) and 33% non-GAAP operating margin, along with Adobe’s FY2025 revenue outlook of $23.65–23.70 billion and 13% YoY RPO growth, support continued investments in AI-driven CX, customer data platforms, automation, and experience personalization.
Top Key Players in the Market
- Adobe Inc.
- SAP SE
- Oracle Corporation
- IBM Corporation
- Salesforce, Inc.
- Avaya LLC
- Genesys Cloud Services, Inc.
- Freshworks, Inc.
- Medallia, Inc.
- OpenText Corporation
- NICE Systems Ltd.
- Zendesk, Inc.
- Other Key Players
Recent Developments
- In March 2026, Zendesk announced its acquisition of AI startup Forethought through an all-cash deal, its largest acquisition to date, to integrate self-learning AI agents into its Resolution Platform and enhance AI-driven customer experience automation; the move was part of a reported approximately USD 500 million AI acquisition strategy across seven deals.
- In June 2026, Medallia acquired Zingle to expand omnichannel CX capabilities by integrating SMS, in-app, and social messaging solutions into Medallia Experience Cloud, adding access to thousands of business customers and hundreds of millions of messages annually.
- In September 2025, NICE announced the acquisition of Cognigy for approximately USD 955 million, including a USD 50 million time-bound holdback, to combine Cognigy’s conversational AI technology with the NICE CXone platform and accelerate AI-powered customer experience solutions.
Report Scope
| Report Features | Description |
|---|---|
| Market Value (2025) | USD 16.3 Billion |
| Forecast Revenue (2035) | USD 60.9 Billion |
| CAGR (2026-2035) | 14.1% |
| Base Year for Estimation | 2025 |
| Historic Period | 2020-2024 |
| Forecast Period | 2026-2035 |
| Report Coverage | Revenue Forecast, Market Dynamics, Competitive Landscape, Recent Developments |
| Segments Covered | By Analytical Tools (Text Analytics, EFM Software, Web Analytics & Content Management, Speech Analytics, Other Analytical Tools), By Technology Touch Point Type (Call Centers, Stores/Branches, Email, Social Media Platform, Web Services, Mobile, Other Touch Point Types), By Deployment (On-premise and Cloud), By End-use Industry (Retail, BFSI, Healthcare, Manufacturing, IT & Telecommunications, Construction, Government, Other End-use Industries) |
| Regional Analysis | North America – US, Canada; Europe – Germany, France, The UK, Spain, Italy, Rest of Europe; Asia Pacific – China, Japan, South Korea, India, Australia, Singapore, Rest of APAC; Latin America – Brazil, Mexico, Rest of Latin America; Middle East & Africa – GCC, South Africa, Rest of MEA |
| Competitive Landscape | Adobe Inc., SAP SE, Oracle Corporation, IBM Corporation, Salesforce, Inc., Avaya LLC, Genesys Cloud Services, Inc., Freshworks, Inc., Medallia, Inc., OpenText Corporation, NICE Systems Ltd., Zendesk, Inc., Other Key Players |
| Customization Scope | Customization for segments and region/country-level will be provided. Moreover, additional customization can be done based on the requirements. |
| Purchase Options | We have three licenses to opt for: Single User License, Multi-User License (Up to 5 Users), Corporate Use License (Unlimited Users and Printable PDF) |





























