
Global Enterprise Data Observability Software Market Size, Share and Analysis Report By Deployment Mode (Cloud-based, On-premises), By Organization Size (Large Enterprises, Small and Medium-sized Enterprises (SMEs)), By Application (Data Quality Monitoring, Data Pipeline Monitoring, Data Lineage & Governance, Incident Detection & Resolution, Others), By End-User Industry (IT & Telecommunications, Banking, Financial Services, and Insurance (BFSI), Retail & E-commerce, Healthcare, Manufacturing, Others), By Regional Analysis, Global Trends and Opportunity, Future Outlook By 2025-2035
- Published date: Dec. 2025
- Report ID: 172083
- Number of Pages: 383
- Format:
-
keyboard_arrow_up
Quick Navigation
- Report Overview
- Top Market Takeaways
- Quick Market Facts
- By Deployment Mode
- By Organization Size
- By Application
- By End-User Industry
- By Region
- Key Market Segments
- Emerging Trends
- Growth Factors
- Driver Analysis
- Restraint Analysis
- Opportunity Analysis
- Challenge Analysis
- Competitive Analysis
- Recent Developments
- Report Scope
Report Overview
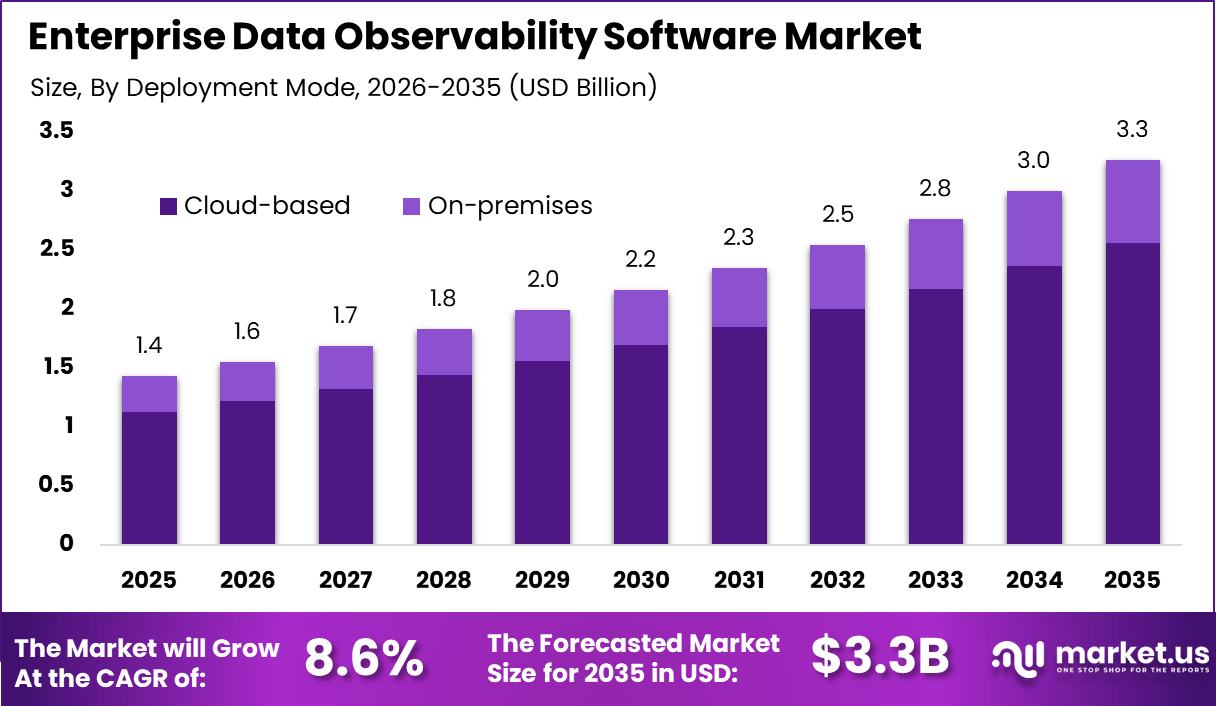
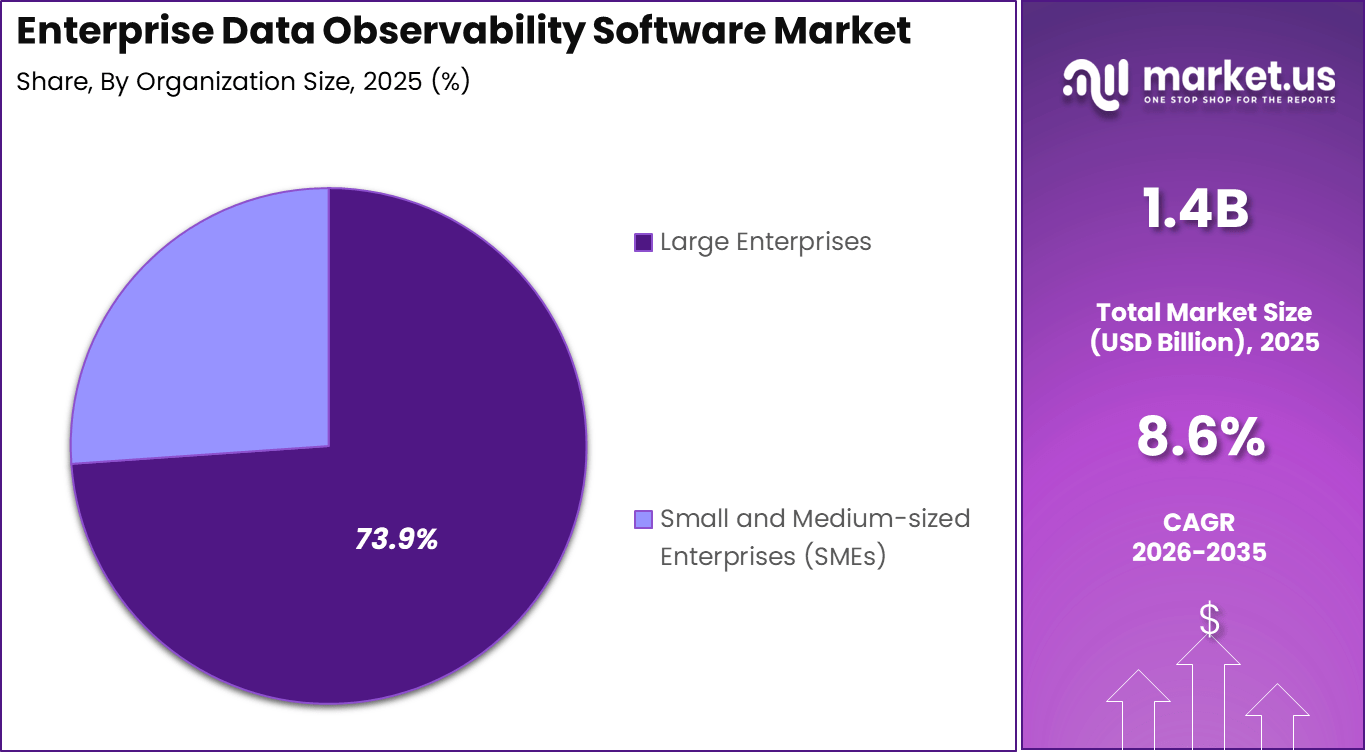
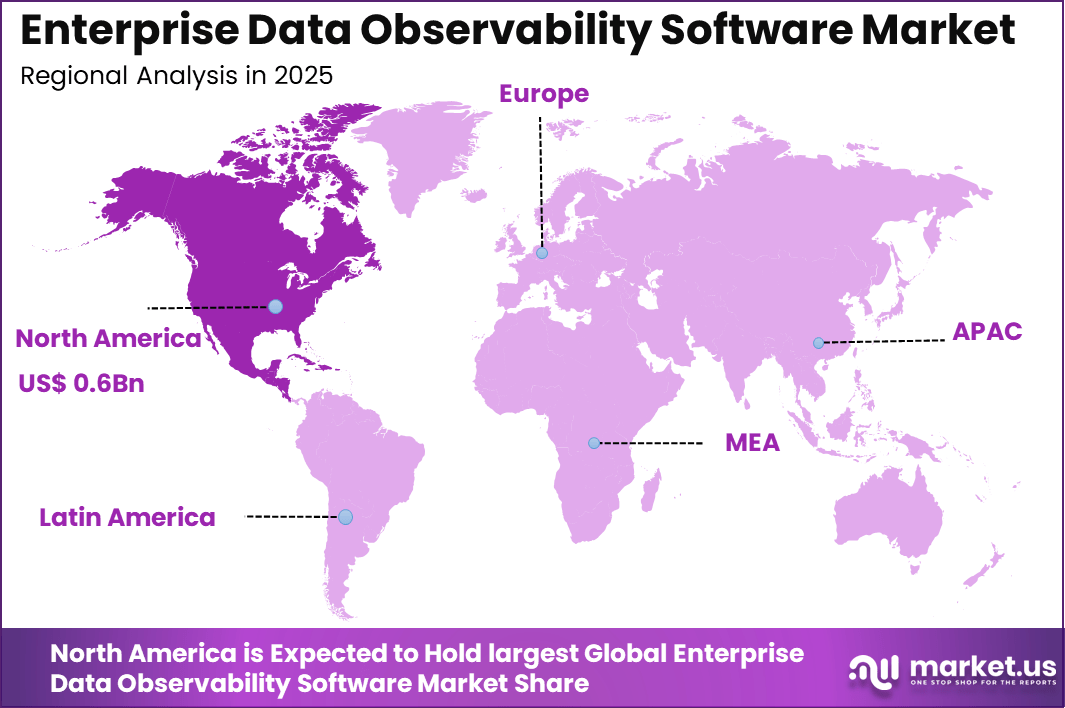
The Global Enterprise Data Observability Software Market size is expected to be worth around USD 3.3 Billion By 2035, from USD 1.4 billion in 2025, growing at a CAGR of 8.6% during the forecast period from 2026 to 2035. North America held a dominan Market position, capturing more than a 45.6% share, holding USD 0.6 Billion revenue.
The enterprise data observability software market refers to solutions that help organizations monitor, understand, and manage the health, quality, and behavior of their data across complex systems. Data observability platforms collect signals from databases, data pipelines, and business applications to identify anomalies, performance issues, and data quality problems. These systems support IT teams, data engineers, and business users by providing transparency into data flows and enabling faster detection of issues.
Growth in this market is supported by the increasing volume of data generated by modern enterprise systems and the expansion of analytics, artificial intelligence, and business intelligence initiatives. Organizations rely on consistent and reliable data for decision making, reporting, regulatory compliance, and customer insights. Data observability tools help ensure that data remains accurate, consistent, and trustworthy as it moves through storage, transformation, and consumption layers.
Top Market Takeaways
- Cloud-based deployment dominated the enterprise data observability software market with a 78.6% share, reflecting strong preference for scalable, flexible, and centrally managed monitoring environments.
- Large enterprises accounted for 73.9%, driven by complex data ecosystems, high data volumes, and stricter governance requirements.
- Data quality monitoring led applications with 36.8%, as organizations focused on accuracy, consistency, and reliability of analytics and AI-driven insights.
- The BFSI sector captured 41.5%, supported by regulatory pressure, risk management needs, and heavy reliance on real-time data integrity.
- North America held a leading 45.6% share, backed by mature cloud adoption and advanced data infrastructure.
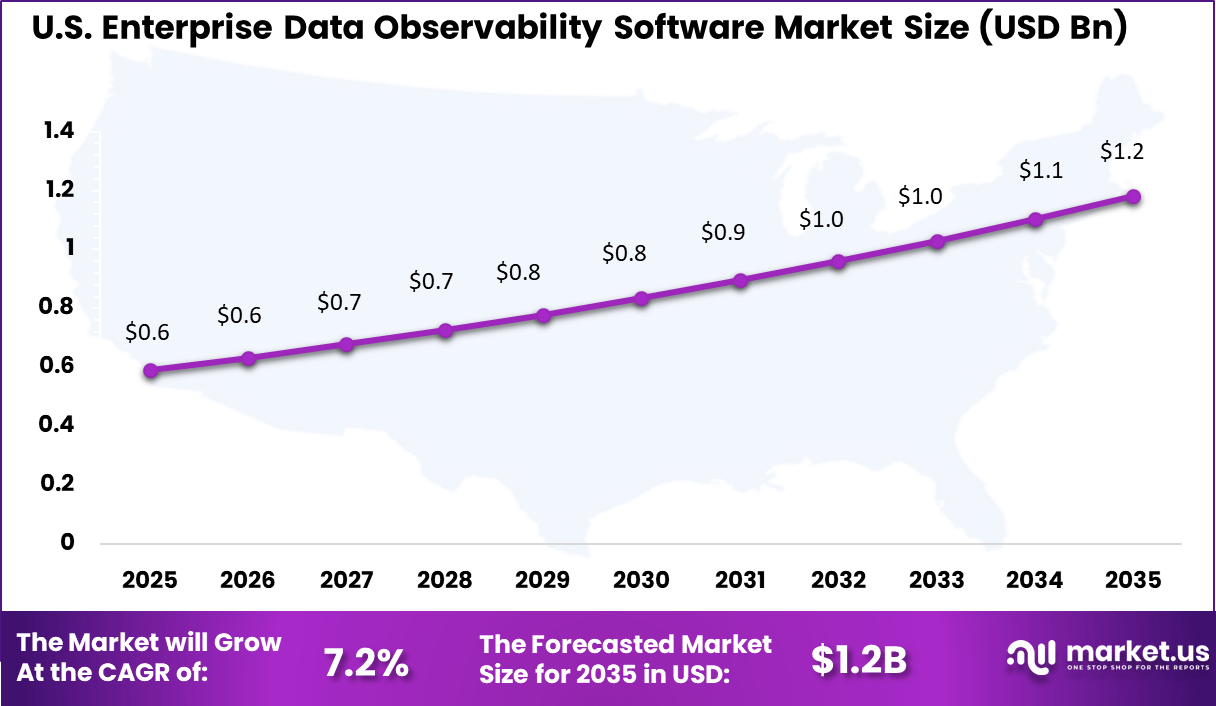
- The U.S. market reached USD 0.59 billion in 2024 and is expanding at a 7.26% CAGR, driven by rising demand for data reliability, observability across pipelines, and enterprise analytics modernization.
Quick Market Facts
Enterprise Impact and Cost Statistics
- Poor data quality continues to create material financial impact, costing organizations an average of USD 12.9 million per year.
- As data environments grow more complex, the average time required to resolve data incidents has increased from 9 hours to 15 hours year over year.
- Data observability is becoming a strategic priority, with about 92% of data leaders indicating it will be a core focus over the next 1-3 years.
- Investment momentum remains strong, as roughly 83.9% of executives plan to increase spending on data and analytics tools within the current year.
Operational Impact Statistics
- Poor data quality imposes a heavy financial burden, costing organizations an average of USD 12.9 million each year.
- Revenue exposure is significant, as data quality issues affect roughly 31% of business revenue on average.
- Data teams spend close to 50% of their time fixing data problems instead of focusing on analysis and value creation.
- Incident management is becoming more complex, with average resolution time increasing from 9 hours to 15 hours year over year.
- Organizations implementing data observability have reported up to 50% reductions in investigation time by enabling faster issue detection and root-cause analysis.
- Rapid data expansion adds pressure, as enterprise data volumes are growing by about 63% per month, reinforcing the need for automated monitoring and observability tools.
By Deployment Mode
Cloud-based deployment accounts for 78.6%, showing strong preference for scalable and flexible data observability platforms. Organizations use cloud-based tools to monitor data pipelines, data flows, and system health in real time. Cloud environments support faster deployment and easier updates. This helps enterprises manage growing data volumes efficiently.
The dominance of cloud-based deployment is driven by widespread cloud adoption across enterprises. Organizations benefit from reduced infrastructure management and improved accessibility. Cloud platforms also support integration with modern data architectures. These factors continue to support strong adoption.
By Organization Size
Large enterprises represent 73.9%, highlighting their leading role in adopting data observability software. These organizations manage complex data ecosystems across multiple departments and regions. Data observability tools help maintain accuracy and reliability at scale. Centralized monitoring supports enterprise-wide governance.
Adoption among large enterprises is driven by data complexity and compliance needs. These organizations rely on observability tools to detect data issues early. Improved visibility supports better decision-making. Long-term digital initiatives further increase demand.
By Application
Data quality monitoring holds 36.8%, making it the leading application segment. Enterprises use observability software to detect errors, inconsistencies, and anomalies in data sets. Maintaining high data quality is essential for analytics and reporting. Continuous monitoring reduces the risk of incorrect insights.
Growth in this application is driven by increased reliance on data-driven decisions. Organizations seek early detection of data failures to avoid operational impact. Observability tools provide alerts and diagnostics for faster resolution. This supports consistent data reliability.
By End-User Industry
The BFSI sector accounts for 41.5%, making it the largest end-user industry. Financial institutions depend heavily on accurate and timely data for transactions and risk management. Data observability software supports monitoring of critical data pipelines. This helps maintain service reliability.
Adoption in BFSI is driven by regulatory requirements and operational risk control. Institutions use observability tools to ensure data integrity and audit readiness. Early detection of data issues reduces financial risk. These needs support continued adoption.
By Region
North America holds 45.6%, supported by advanced data infrastructure and strong enterprise adoption. Organizations in the region invest in observability tools to manage complex data environments. High cloud usage supports software deployment. Data governance remains a priority.
The United States reached USD 0.59 Billion with a CAGR of 7.26%, reflecting steady market growth. Expansion is driven by increasing data volumes and analytics usage. Enterprises continue to strengthen data monitoring practices. Observability software remains essential for data reliability.
Key Market Segments
By Deployment Mode
- Cloud-based
- On-premises
By Organization Size
- Large Enterprises
- Small and Medium-sized Enterprises (SMEs)
By Application
- Data Quality Monitoring
- Data Pipeline Monitoring
- Data Lineage & Governance
- Incident Detection & Resolution
- Others
By End-User Industry
- IT & Telecommunications
- Banking, Financial Services, and Insurance (BFSI)
- Retail & E-commerce
- Healthcare
- Manufacturing
- Others
Regional Analysis and Coverage
- North America
- US
- Canada
- Europe
- Germany
- France
- The UK
- Spain
- Italy
- Russia
- Netherlands
- Rest of Europe
- Asia Pacific
- China
- Japan
- South Korea
- India
- Australia
- Singapore
- Thailand
- Vietnam
- Rest of Latin America
- Latin America
- Brazil
- Mexico
- Rest of Latin America
- Middle East & Africa
- South Africa
- Saudi Arabia
- UAE
- Rest of MEA
Emerging Trends
Shift Toward Integrated Observability and Automated Anomaly Detection
A key trend in the enterprise data observability software market is the integration of observability features with broader data management platforms. Instead of separate tools for monitoring, lineage, and quality, enterprises increasingly adopt unified systems that provide a single view of data health. These integrations reduce the need for manual coordination between different tools and provide more consistent reporting.
Another emerging trend is the use of automated anomaly detection and root-cause analysis. Modern observability platforms use models that establish normal data behavior and flag deviations in real time. This automation helps organizations detect issues such as data drift, missing records, or schema changes without continuous manual oversight. The result is faster resolution and improved reliability of data assets.
Growth Factors
Expansion of Data Volumes and Dependence on Data-Driven Decisions
A major growth factor for this market is the rapid expansion of data volumes across enterprise applications, cloud services, and connected devices. As data ecosystems become more complex, the risk of errors, delays, and inconsistencies increases. Observability solutions help ensure that data from multiple sources remains accurate and flow integrity is maintained, supporting trustworthy analytics and reporting.
Another growth factor is the growing reliance on data for business decisions. Organizations use analytical models, operational dashboards, and compliance reporting to answer strategic questions. Errors or gaps in data can lead to incorrect conclusions and downstream impacts in areas such as finance, sales forecasting, or customer engagement. Data observability helps mitigate these risks by enhancing data reliability and trust.
Driver Analysis
Need for Faster Issue Detection and Operational Efficiency
A key driver of the enterprise data observability software market is the need for rapid detection and resolution of data issues. In traditional environments, finding the source of a data problem can require manual investigation across multiple tools and teams. Observability platforms automate this process by tracing data flows and highlighting anomalies. This reduced investigation time improves operational efficiency.
Another driver is the requirement for consistent data performance across distributed systems. Enterprises operate hybrid environments that include cloud data warehouses, streaming platforms, and legacy systems. Ensuring consistent data behavior across these environments requires observability that monitors performance, latency, and data quality. This helps prevent disruptions in data consumption and analysis.
Restraint Analysis
Integration Complexity and Implementation Costs
A significant restraint in the data observability market is the complexity of integrating observability tools with existing data infrastructure. Enterprises often use a mix of databases, data lakes, ETL tools, and business applications. Connecting all these components to an observability platform requires technical expertise, configuration work, and careful planning to ensure coverage without performance impact.
Another restraint is the cost of implementing and maintaining these solutions. Advanced observability platforms may require subscription fees, infrastructure resources, and ongoing support. Smaller organizations or teams with limited budgets may delay adoption until clear return on investment can be demonstrated.
Opportunity Analysis
Adoption in Regulated Industries and Cross-Platform Visibility
There is strong opportunity in regulated industries such as finance, healthcare, and government where data accuracy and auditability are critical. Observability platforms can help meet regulatory requirements by providing traceable data lineage, quality reports, and historical snapshots of data behavior. Solutions that support compliance documentation and reporting can attract investment in these sectors.
Another opportunity lies in providing cross-platform visibility across hybrid cloud and multi-cloud environments. Organizations increasingly mix on-premise systems with cloud data services. Observability vendors that offer seamless support across varied environments can help enterprises maintain consistent monitoring and governance, which supports broader adoption.
Challenge Analysis
Data Privacy Requirements and Scalability
A major challenge in this market is ensuring data privacy while providing detailed observability. Observability platforms collect metadata, performance metrics, and usage patterns that may include sensitive information. Organizations must implement access controls, encryption, and compliance checks to protect this data. Meeting privacy requirements increases governance efforts and operational complexity.
Another challenge involves scalability as data volumes and sources grow. As enterprises add new systems, observability tools must process increasing signals without lag or loss of coverage. Ensuring that platforms remain responsive under high load requires efficient architecture and ongoing optimization. Scalability concerns may slow adoption in rapidly growing data environments.
Competitive Analysis
Datadog, Inc., Splunk, Inc., Dynatrace, LLC, and New Relic, Inc. lead the enterprise data observability software market with platforms that unify metrics, logs, and traces to monitor data pipelines and platform health. Their solutions help enterprises detect data incidents, reduce downtime, and improve reliability across cloud and hybrid environments. These companies focus on scale, AI driven anomaly detection, and tight integration with application observability.
Monte Carlo Data, Inc., Acceldata, Inc., Bigeye Data, Inc., Observe, Inc., Metaplane, Inc., Anomalo, Inc., and Soda Data, Inc. strengthen the market with purpose built data quality monitoring, lineage awareness, and freshness validation. Their tools help data teams identify root causes quickly and maintain trust in analytics. These providers emphasize ease of deployment and proactive alerting.
Unravel Data Systems, Inc., IBM Corporation, Oracle Corporation, and Informatica, Inc. expand the landscape with enterprise grade governance, performance optimization, and metadata management. Their offerings integrate observability with data management stacks used at scale. These companies focus on compliance, optimization, and enterprise integration. Growing reliance on analytics and AI continues to drive steady demand for data observability software.
Top Key Players in the Market
- Datadog, Inc.
- Splunk, Inc.
- Dynatrace, LLC
- New Relic, Inc.
- Monte Carlo Data, Inc.
- Acceldata, Inc.
- Bigeye Data, Inc.
- Observe, Inc.
- Metaplane, Inc.
- Anomalo, Inc.
- Soda Data, Inc.
- Unravel Data Systems, Inc.
- IBM Corporation
- Oracle Corporation
- Informatica, Inc.
- Others
Recent Developments
- Splunk rolled out key updates to its Observability Cloud throughout the year, like hybrid app monitoring and better synthetics alerts in September 2025, making troubleshooting smoother for ITOps teams handling mixed environments. They kept the momentum with database performance fixes and log correlations in October 2025, plus more cloud service monitoring in November 2025.
- Dynatrace deepened its AWS partnership in April 2025 with a multiyear deal focused on co-innovation for cloud modernization and observability. By November 2025, they launched a preview of a new cloud operations solution for Azure, with full rollout eyed for early 2026.
- New Relic pushed AI-driven features hard, announcing over 20 innovations like RAG integration and cloud cost intelligence back in February 2025 to cut toil in complex stacks. Later in November 2025, their NOW conference highlighted intelligent observability with ML anomaly forecasting.
Report Scope
Report Features Description Market Value (2025) USD 1.4 Bn Forecast Revenue (2035) USD 3.3 Bn CAGR(2026-2035) 8.6% Base Year for Estimation 2025 Historic Period 2020-2024 Forecast Period 2026-2035 Report Coverage Revenue forecast, AI impact on Market trends, Share Insights, Company ranking, competitive landscape, Recent Developments, Market Dynamics and Emerging Trends Segments Covered By Deployment Mode (Cloud-based, On-premises), By Organization Size (Large Enterprises, Small and Medium-sized Enterprises (SMEs)), By Application (Data Quality Monitoring, Data Pipeline Monitoring, Data Lineage & Governance, Incident Detection & Resolution, Others), By End-User Industry (IT & Telecommunications, Banking, Financial Services, and Insurance (BFSI), Retail & E-commerce, Healthcare, Manufacturing, Others) Regional Analysis North America – US, Canada; Europe – Germany, France, The UK, Spain, Italy, Russia, Netherlands, Rest of Europe; Asia Pacific – China, Japan, South Korea, India, New Zealand, Singapore, Thailand, Vietnam, Rest of Latin America; Latin America – Brazil, Mexico, Rest of Latin America; Middle East & Africa – South Africa, Saudi Arabia, UAE, Rest of MEA Competitive Landscape Datadog, Inc., Splunk, Inc., Dynatrace, LLC, New Relic, Inc., Monte Carlo Data, Inc., Acceldata, Inc., Bigeye Data, Inc., Observe, Inc., Metaplane, Inc., Anomalo, Inc., Soda Data, Inc., Unravel Data Systems, Inc., IBM Corporation, Oracle Corporation, Informatica, Inc., Others Customization Scope Customization for segments, region/country-level will be provided. Moreover, additional customization can be done based on the requirements. Purchase Options We have three license to opt for: Single User License, Multi-User License (Up to 5 Users), Corporate Use License (Unlimited User and Printable PDF)  Enterprise Data Observability Software MarketPublished date: Dec. 2025add_shopping_cartBuy Now get_appDownload Sample
 -
-
Our Clients
- 172083
- Dec. 2025


