


Report Overview
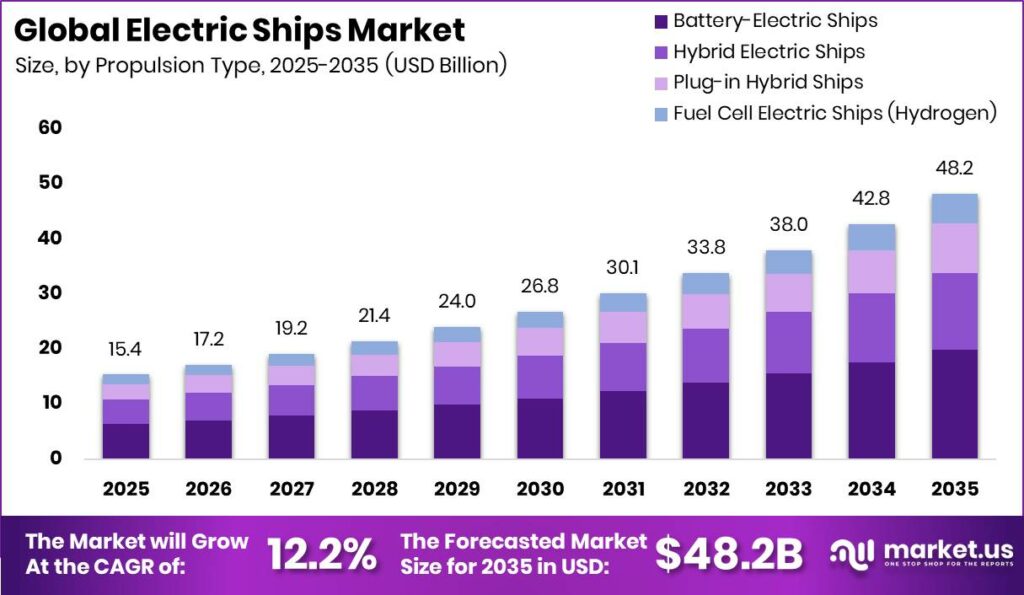
Global Electric Ships Market size is expected to be worth around USD 48.20 Billion by 2035 from USD 15.40 Billion in 2025, growing at a CAGR of 12.2% during the forecast period 2026 to 2035. This expansion reflects a structural shift away from fossil-fuelled propulsion toward battery and hybrid systems. Shipowners now treat electrification as a cost lever, not just a compliance step.
The electric ships market covers vessels that use battery, hybrid, or fuel cell propulsion instead of pure diesel power. Therefore, the structure spans eight segment groups, including vessel type, propulsion, battery chemistry, and charging infrastructure. Ferries, cargo ships, and naval vessels anchor the demand base, while ports and battery suppliers form the enabling backbone that makes each new deployment commercially viable.
Key Takeaways
- Global market size will reach USD 48.20 Billion by 2035 from USD 15.40 Billion in 2025, at a CAGR of 12.2%.
- Ferries led the By Vessel Type segment with a 34.60% share.
- Battery-Electric Ships dominated the By Propulsion Type segment with a 41.20% share.
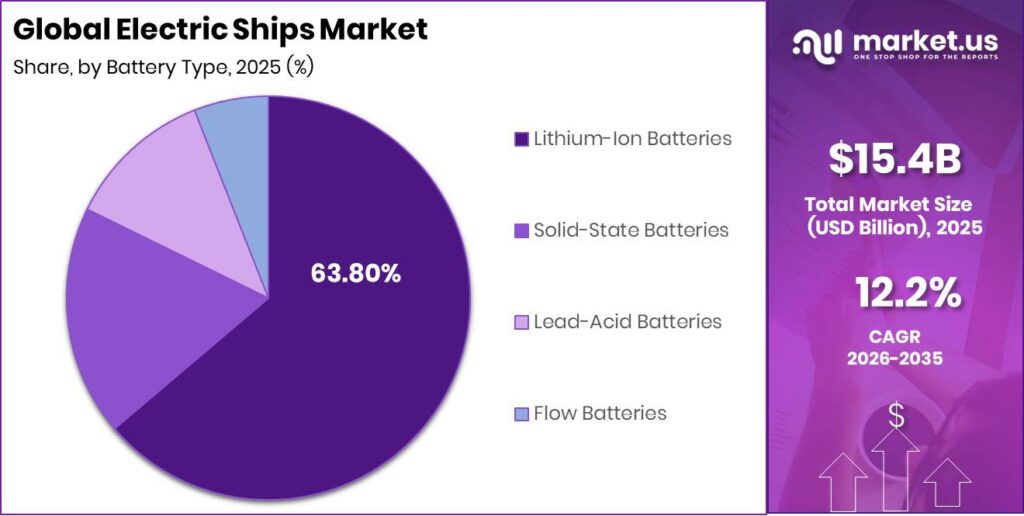
- Lithium-Ion Batteries held the By Battery Type segment with a 63.80% share.
- Fully Electric led the By Power Source Integration segment with a 38.40% share.
- Passenger Transport led the By Application segment with a 36.70% share.
- Commercial Shipping Companies led the By End User segment with a 45.90% share.
- Shore Power Charging led the By Charging Infrastructure segment with a 58.10% share.
- Short-Range Ships led the By Range Capability segment with a 52.30% share.
- Europe dominated with a 39.40% share, valued at USD 6.05 Billion.
Government policy shapes buying behavior across this market. Norway ties ferry route concessions to zero-emission conditions, forcing operators to electrify or lose contracts. This creates a captive demand pipeline for battery and propulsion suppliers. Therefore, vendors who secure early framework agreements with public transport authorities lock in multi-year revenue before private commercial demand fully matures.
Operating economics now drive the switch as hard as regulation. The MF Ampere cut its operational cost per crossing by 85 to 90% versus diesel, generating nearly USD 15 Million in cumulative savings over its life, as confirmed in February 2025. As a result, buyers see electric propulsion as a fuel-cost hedge. Suppliers who quantify lifetime savings, not just purchase price, will win procurement decisions.
Emission cuts reinforce the commercial case. The MF Ampere reduces annual CO2 emissions by 5,700 tonnes against a comparable diesel ferry. This means operators can meet tightening port and coastal emission rules without buying offsets. Consequently, end-use growth in short-haul passenger routes directly lifts demand for lithium-ion battery packs and shore charging systems along fjord and coastal corridors.
Vessel Type Analysis
Ferries dominates with 34.60% due to fixed short routes enabling charging.
In 2025, Ferries held a dominant market position in the By Vessel Type segment of Electric Ships Market, with a 34.60% share. Norway alone operates roughly 70 battery-electric ferries, over half its national ferry fleet, according to the European Alternative Fuels Observatory. Fixed crossings let operators size batteries precisely and charge at both docks. This means vendors targeting scheduled ferry routes face lower technical risk and faster payback than open-sea segments.
Cargo ships anchor the fastest-growing sub-segment because freight owners chase fuel savings on repeatable coastal lanes. The Norwegian Fredrikstad pilot recorded up to an 88% reduction in energy consumption versus diesel reference systems, as reported by the project’s April 2026 final report. Lower energy draw shrinks operating cost per voyage. Therefore, short-sea cargo operators become a priority target for battery and drivetrain suppliers seeking volume orders.
Passenger ships serve dense urban and tourist waterways where emission limits bite hardest. Oslo runs about 80 electric commuter ferries across a network of roughly 130 ferry connections, based on operator fleet data. City authorities favor quiet, zero-emission vessels near residential shorelines. As a result, municipal transport bodies form a reliable buyer group for compact, high-turnaround electric passenger vessels.
Offshore support vessels, naval and defense ships, and yachts and leisure boats hold the remaining share collectively. Offshore support vessels adopt hybrid systems to cut fuel on standby duty, naval and defense ships pilot electric drives for stealth, and electric motor boats already make up more than 55% of electric leisure boat sales. Each niche opens a distinct entry point for specialist suppliers.
Propulsion Type Analysis
Battery-Electric dominates with 41.20% due to zero-emission short-route operating advantage.
In 2025, Battery-Electric Ships held a dominant market position in the By Propulsion Type segment of Electric Ships Market, with a 41.20% share. Norway converted about 34 ferry crossings to fully electric or hybrid-electric operation, based on maritime electrification research. Pure battery drive removes fuel and maintenance costs on predictable routes. This means suppliers of high-density battery packs gain first claim on the largest propulsion sub-segment.
Hybrid electric ships form the fastest-growing sub-segment because they extend range without full charging dependence. Up to 70% of new ferry orders are now electric or hybrid, according to CleanTechnica data cited in the Central Baltic REISFER report. Hybrid systems let operators enter longer routes today while ports upgrade charging. Therefore, drivetrain firms offering scalable hybrid architectures capture buyers not yet ready for full electrification.
Plug-in hybrid ships bridge the gap for operators with partial shore power access. These vessels charge at port and burn fuel only on overflow legs, cutting emissions on the busiest segments. This structure suits mixed-route fleets that cannot justify full battery capacity. As a result, plug-in hybrids give suppliers a route into cost-sensitive operators testing electrification before committing capital.
Fuel cell electric ships using hydrogen target long-range duty where batteries fall short. Norway’s zero-emission mandates push developers toward hydrogen for extended coastal and deep-sea legs. High energy density supports routes that battery-only vessels cannot serve. Consequently, early hydrogen propulsion suppliers position for premium contracts on long-haul zero-emission corridors as fueling networks expand.
Battery Type Analysis
Lithium-Ion dominates with 63.80% due to proven energy density and scale.
In 2025, Lithium-Ion Batteries held a dominant market position in the By Battery Type segment of Electric Ships Market, with a 63.80% share. The European Maritime Safety Agency flagged lithium-ion safety and reliability standards for onboard use in 2023, as reported by the Faraday Institution. Mature supply chains keep cell costs falling. This means shipbuilders standardize on lithium-ion, giving established cell makers a durable volume advantage.
Solid-state batteries lead the fastest-growing sub-segment because they promise higher density and lower fire risk. Regulators such as EMSA continue tightening onboard battery safety rules, which favors solid-state chemistry as it matures. Safer packs reduce insurance and certification friction for operators. Therefore, cell developers investing early in marine solid-state gain a defensible edge as safety compliance costs climb.
Lead-acid batteries persist in low-cost auxiliary and small-vessel roles where energy density matters less. These packs power backup and hotel loads on hybrid and leisure craft cheaply. Their low upfront cost suits budget operators and small yards. As a result, lead-acid suppliers retain a stable niche even as lithium-ion dominates primary propulsion.
Flow batteries target stationary and long-duration onboard storage where cycle life outweighs weight. Their scalable capacity fits shore-side buffering and large support vessels with space to spare. Long lifespan lowers replacement cost over decades. Consequently, flow battery makers find opportunity in port storage and heavy-duty vessels rather than compact passenger craft.
Power Source Integration Analysis
Fully Electric dominates with 38.40% due to lowest operating cost per voyage.
In 2025, Fully Electric held a dominant market position in the By Power Source Integration segment of Electric Ships Market, with a 38.40% share. Norway’s roughly 70 battery-electric ferries each displace close to 1 million liters of diesel per year, based on European Alternative Fuels Observatory figures. Zero fuel spend transforms voyage economics. This means fully electric integration attracts operators focused on long-term cost control over upfront savings.
Hybrid diesel-electric systems form the fastest-growing sub-segment because they cut fuel use without route restrictions. Historical industry data shows hybrid propulsion held the majority share of the broader electric ship market, reflecting its transitional appeal. Operators gain efficiency while keeping diesel backup for range. Therefore, hybrid integration suppliers serve the widest buyer base during the shift to full electrification.
Shore-powered charging systems let vessels draw grid power at berth instead of running generators. Ports adopting cold-ironing cut dockside emissions and diesel burn during turnaround. This structure ties vessel demand directly to port infrastructure spend. As a result, integrators bundling ship and shore systems capture value on both sides of each deployment.
Renewable energy-integrated ships add solar and wind assist to stretch battery range. Small passenger and leisure craft use onboard solar to trim consumption on daylight routes. Added generation reduces charging frequency and grid dependence. Consequently, suppliers of marine solar and integrated renewables find early traction in tourism and short-range passenger fleets.
Application Analysis
Passenger Transport dominates with 36.70% due to dense short-haul urban route demand.
In 2025, Passenger Transport held a dominant market position in the By Application segment of Electric Ships Market, with a 36.70% share. The Fredrikstad electric passenger ferry earned an average rider rating of 4.72 out of 5 across continuous winter service, according to the project’s 2026 report. Strong acceptance de-risks public investment. This means transport authorities expand electric passenger fleets faster than other applications.
Cargo transport forms the fastest-growing sub-segment because freight lanes reward fuel savings at scale. Short-sea cargo routes with predictable schedules let operators size batteries for repeat voyages. Lower cost per ton-mile improves freight margins. Therefore, cargo owners become a high-volume target for battery and propulsion suppliers seeking large single orders.
Marine tourism and leisure applications favor quiet, emission-free vessels near sensitive coastlines and lakes. Electric motor boats already exceed 55% of electric leisure boat sales, based on leisure boat market data. Clean, silent operation is a selling point for tour operators. As a result, tourism buyers form a premium niche willing to pay for zero-emission passenger experiences.
Defense applications and offshore energy operations hold the remaining share collectively. Navies pilot electric and hybrid drives for stealth and fuel logistics, while offshore energy operators use hybrid support vessels to cut standby fuel burn. Both segments carry high specification requirements. Each opens premium, specialized contracts for suppliers with proven marine-grade systems.
End User Analysis
Commercial Shipping dominates with 45.90% due to fuel-cost pressure on fixed routes.
In 2025, Commercial Shipping Companies held a dominant market position in the By End User segment of Electric Ships Market, with a 45.90% share. Up to 70% of new ferry orders now specify electric or hybrid propulsion, according to CleanTechnica figures. Fleet operators chase predictable fuel-free economics on scheduled routes. This means commercial buyers drive the bulk of near-term order volume for suppliers.
Government and defense agencies form the fastest-growing sub-segment because public mandates and stealth goals push adoption. EU member states lifted total defense expenditure by more than 30% between 2021 and 2024, based on European Council data. Rising budgets fund electric and hybrid naval trials. Therefore, defense procurement offers suppliers high-value, long-cycle contracts with strong funding stability.
Tourism operators buy electric vessels to meet coastal emission rules and market clean travel. Silent, zero-emission craft suit protected waters and heritage sites where diesel is restricted. Green branding lifts passenger appeal and pricing power. As a result, tourism buyers accept premium pricing for compact, low-emission passenger boats.
Private yacht owners adopt electric propulsion for quiet cruising and lower running costs on leisure craft. Electric motor boats already dominate leisure sales, signaling strong owner demand. This buyer group values comfort and brand prestige over payback speed. Consequently, yacht builders offering electric drivetrains capture a small but high-margin customer base.
Charging Infrastructure Analysis
Shore Power Charging dominates with 58.10% due to grid access at fixed berths.
In 2025, Shore Power Charging held a dominant market position in the By Charging Infrastructure segment of Electric Ships Market, with a 58.10% share. Each Norwegian electric ferry avoids emitting roughly 2,680 tonnes of CO2 per year by charging from clean grid power, according to the European Alternative Fuels Observatory. Berth-side charging suits scheduled vessels. This means shore power suppliers hold the largest infrastructure opportunity.
Port-based fast charging stations form the fastest-growing sub-segment because tight ferry schedules demand rapid top-ups. High-power dock chargers let vessels recharge during short passenger turnarounds. Faster charging keeps route frequency intact. Therefore, fast-charge equipment makers gain priority as operators scale electric fleets on busy crossings.
Onboard renewable charging systems reduce grid dependence by generating power during transit. Solar-assisted passenger craft trim charging needs on daylight routes and remote stops. Added generation supports islands with weak grid access. As a result, onboard renewable suppliers find niche demand in remote and tourism-focused operations.
Battery swapping systems offer a fast alternative where dwell time is minimal. Swappable packs let vessels exchange depleted batteries in minutes rather than waiting to charge. This model suits high-frequency short routes with standardized fleets. Consequently, swapping providers target dense commuter corridors where charging downtime is costly.
Range Capability Analysis
Short-Range Ships dominates with 52.30% due to battery limits favoring brief crossings.
In 2025, Short-Range Ships held a dominant market position in the By Range Capability segment of Electric Ships Market, with a 52.30% share. Fredrikstad electric ferries consume only about 10 to 12 kWh per hour on a 225-meter crossing, based on the project’s 2026 report. Short routes match current battery capacity cleanly. This means short-range vessels remain the safest bet for suppliers.
Medium-range ships form the fastest-growing sub-segment because rising battery density unlocks longer coastal legs. Improving cell energy density steadily extends viable route distance without diesel backup. Longer range widens the addressable route map. Therefore, battery makers advancing energy density directly enable the next wave of medium-range deployments.
Long-range electric ships serve extended coastal and deep-sea routes where batteries alone still fall short. These vessels pair large packs with hydrogen or hybrid systems to reach distant ports. High capacity demands premium engineering. As a result, long-range projects create specialized contracts for suppliers with advanced integrated propulsion capability.
Key Market Segments
By Vessel Type
- Ferries
- Cargo Ships
- Passenger Ships
- Offshore Support Vessels
- Naval & Defense Ships
- Yachts & Leisure Boats
By Propulsion Type
- Battery-Electric Ships
- Hybrid Electric Ships
- Plug-in Hybrid Ships
- Fuel Cell Electric Ships (Hydrogen)
By Battery Type
- Lithium-Ion Batteries
- Solid-State Batteries
- Lead-Acid Batteries
- Flow Batteries
By Power Source Integration
- Fully Electric
- Hybrid (Diesel-Electric)
- Shore-Powered Charging Systems
- Renewable Energy-Integrated Ships
By Application
- Passenger Transport
- Cargo Transport
- Marine Tourism & Leisure
- Defense Applications
- Offshore Energy Operations
By End User
- Commercial Shipping Companies
- Government & Defense Agencies
- Tourism Operators
- Private Yacht Owners
By Charging Infrastructure
- Shore Power Charging
- Port-Based Fast Charging Stations
- Onboard Renewable Charging Systems
- Battery Swapping Systems
By Range Capability
- Short-Range Ships
- Medium-Range Ships
- Long-Range Electric Ships
Regional Analysis
Europe Dominates the Electric Ships Market with a Market Share of 39.40%, Valued at USD 6.05 Billion
Europe led the electric ships market with a 39.40% share, valued at USD 6.05 Billion. Norway anchors this lead through zero-emission ferry mandates and dense fjord routes ideal for electrification. Strong policy pressure converts regulation into firm orders. This means suppliers with a European base capture the deepest current demand and set technical standards others follow globally.
Asia Pacific stands as the fastest-growing region as shipbuilding hubs scale electric vessel output. Major yards in China, Japan, and South Korea integrate electric and hybrid systems into new builds. Rising coastal freight and passenger demand accelerates adoption. Therefore, suppliers expanding into Asia Pacific position early for the steepest volume growth over the forecast period.
North America, Latin America, and the Middle East and Africa contribute the remaining regional share. North America advances shore power at major ports, Latin America adopts electric ferries on river and coastal routes, and Middle East and Africa pilot marine tourism vessels. Each region offers distinct entry points for suppliers building early presence.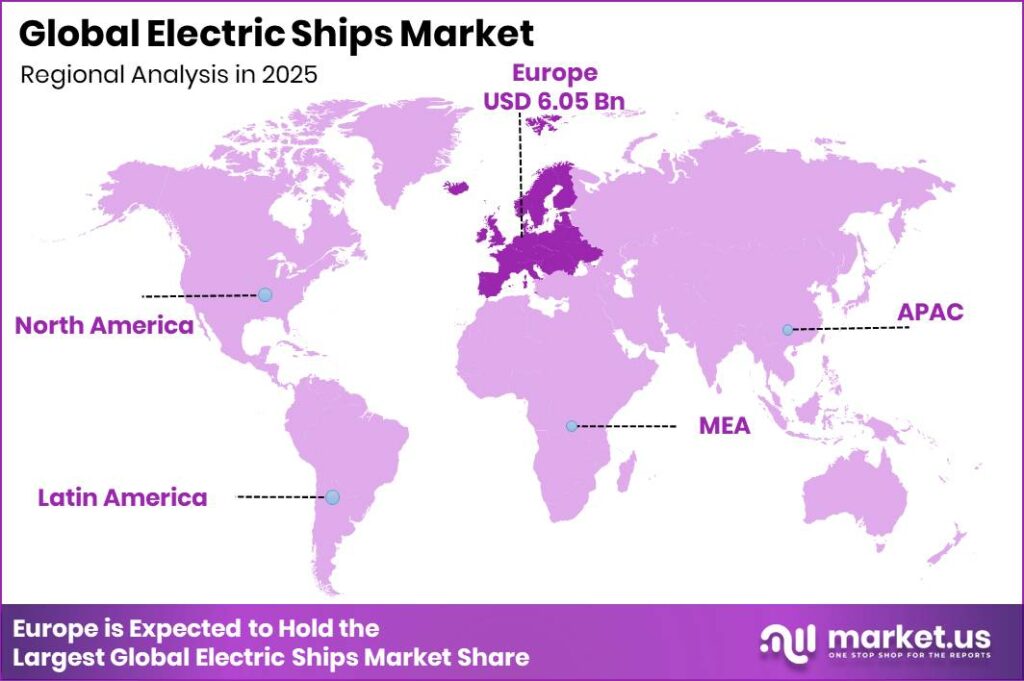
Key Regions and Countries
North America
- US
- Canada
Europe
- Germany
- France
- The UK
- Spain
- Italy
- Rest of Europe
Asia Pacific
- China
- Japan
- South Korea
- India
- Australia
- Rest of APAC
Latin America
- Brazil
- Mexico
- Rest of Latin America
Middle East and Africa
- GCC
- South Africa
- Rest of MEA
Market Dynamics
Market Opportunity Analysis - Underserved regions, cargo electrification, and fast charging open entry points for new players
Cargo transport remains underexploited despite ranking as the fastest-growing application segment. Short-sea freight lanes with fixed schedules suit battery propulsion, yet adoption trails passenger routes. This gap leaves volume orders open for early suppliers. Therefore, drivetrain and battery firms targeting coastal cargo operators can capture large single contracts before incumbents crowd the segment.
Asia Pacific stands underexploited relative to its shipbuilding capacity and rising coastal demand. Europe holds the current lead, but Asia Pacific ranks as the fastest-growing region with major yards ready to integrate electric systems. This creates open ground for early positioning. Consequently, suppliers building regional partnerships now secure share before European incumbents expand east.
Port-based fast charging remains underdeveloped despite being the fastest-growing infrastructure segment. Shore power leads today, yet tight ferry schedules demand rapid top-ups few ports can deliver. This shortfall limits fleet scaling on busy routes. As a result, fast-charge equipment makers can win priority contracts by solving the turnaround bottleneck operators face.
Medium-range vessels offer an opening as battery density improves beyond short-crossing limits. Short-range ships dominate now, but medium-range ranks as the fastest-growing capability segment. This shift widens the addressable route map. Instead of competing on saturated short routes, battery innovators can lead the emerging medium-range niche where technical barriers still deter rivals.
Technology and Innovation Landscape – Battery advances, shore charging, and hybrid integration reshape competitive edges
Lithium-ion battery technology anchors current innovation across the market. Proven energy density and falling cell costs let shipbuilders standardize propulsion around lithium-ion packs. This maturity reduces technical risk for buyers electrifying fixed routes. Therefore, cell makers with marine-certified, high-density products hold a durable edge as fleet standardization accelerates across ferry and commercial segments.
Solid-state battery development signals the next innovation front. Higher density and lower fire risk position solid-state chemistry to meet tightening onboard safety rules from bodies such as EMSA. Safer packs cut certification friction for operators. Consequently, developers investing early in marine solid-state gain a defensible advantage as safety compliance grows more demanding across the fleet.
Shore power and fast charging systems drive infrastructure innovation. Berth-side grid connection lets scheduled vessels charge without running generators, while high-power dock chargers support rapid turnarounds. This integration ties vessel demand to port upgrades. As a result, suppliers bundling ship and shore technology capture value on both sides of each deployment.
Hybrid propulsion architecture advances flexibility for operators not ready for full electrification. Scalable diesel-electric and plug-in hybrid systems extend range while cutting fuel use on longer routes. This adaptability widens the addressable buyer base. Instead of forcing a full switch, hybrid innovators serve transitional fleets and build long-term supplier relationships.
Market Drivers
| Driver | (~) % Impact on CAGR Forecast | Geographic Relevance | Impact Timeline |
|---|---|---|---|
| IMO Net-Zero Framework & Mandatory GHG Fuel Intensity Targets Compelling Fleet Electrification | +3.5% | Global (all vessels ≥ 5,000 GT operating internationally) | Short term (≤ 2 years) |
| Ferry & Short-Sea Route Electrification Driven by Government Procurement Mandates | +2.8% | Norway, Denmark, Sweden, Finland, Japan, South Korea, India, China | Short term (≤ 2 years) |
| Falling Marine Battery Costs & Rising Energy Density Improving Electric Propulsion Economics | +1.9% | Global, led by lithium-ion marine battery manufacturing scale-up in Asia & North America | Medium term (2–4 years) |
| Port Emission Control Area (ECA) Enforcement Driving Harbor & Offshore Support Vessel Electrification | +1.2% | North America, Northern Europe, Baltic Sea, Mediterranean ECA zones | Short term (≤ 2 years) |
| National Shipbuilding Subsidies & Green Vessel Financing Schemes Reducing CapEx Barrier | +0.8% | India (SBFAS 2.0), South Korea, China, Norway, EU (FuelEU Maritime) | Medium term (2–4 years) |
IMO Net-Zero Framework & Mandatory GHG Fuel Intensity Targets Compelling Fleet Electrification
The primary driver reshaping commercial shipbuilding investment is the IMO’s binding regulatory architecture, which has moved beyond aspirational policy into mandatory compliance obligation. The IMO’s 2023 Revised GHG Strategy requires international shipping to cut GHG emissions by at least 20% by 2030 and at least 70% by 2040 versus the 2008 baseline. Building on this, MEPC 83 in April 2025 approved the IMO Net-Zero Framework (NZF), the first mandatory GHG fuel intensity limit and emissions pricing mechanism across an entire global sector, imposing penalty prices of $380 per tonne CO2eq for Tier 2 deficit ships. DNV modeling indicates the NZF will effectively double fleet-average fuel costs by approximately 2036 under a business-as-usual fuel mix scenario.
For battery-electric vessels, the NZF introduces a structural financial benefit. Zero-emission ships generate Surplus Units transferable to deficit vessels, creating a compliance credit revenue stream estimated at $100 to $380 per tonne CO2eq avoided. Combined with diesel cost avoidance of $0.8 to $1.4 million USD per vessel annually, this improves project IRR by 2 to 4 percentage points and compresses payback periods from 8 to 12 years down to 5 to 8 years in regulated geographies.
Market Restraints
| Restraint | (~) % Impact on CAGR Forecast | Geographic Relevance | Impact Timeline |
|---|---|---|---|
| Marine Battery Energy Density Ceiling Rendering Battery-Only Propulsion Commercially Unviable for Large Ocean-Going Vessels | -3.2% | Global; structurally limits pure electric adoption to vessels below ~5,000 DWT on routes ≤ 400 nm | Long term (≥ 4 years) |
| High Upfront Capital Cost of New Electric Vessel Construction vs. Conventional Newbuilds | -1.8% | Emerging markets, price-sensitive ferry operators globally, SME coastal freight operators | Short term (≤ 2 years) |
| Underdeveloped Shore Power & High-Power Charging Infrastructure at Global Ports | -1.0% | Asia-Pacific (ex-Japan/South Korea), Middle East, Sub-Saharan Africa, Latin America | Medium term (2–4 years) |
| NZF Adoption Delay & Regulatory Timeline Uncertainty Deferring Fleet Investment Decisions | -0.7% | Global, most acute for operators planning multi-vessel fleet conversion programs | Short term (≤ 2 years) |
| Limited Availability of Marine-Grade Battery Recycling & Second-Life Infrastructure | -0.3% | Global | Long term (≥ 4 years) |
Marine Battery Energy Density Ceiling Rendering Battery-Only Propulsion Commercially Unviable for Large Ocean-Going Vessels
A hard thermodynamic constraint embedded in current lithium-ion cell chemistry defines the fundamental boundary of battery-electric marine propulsion. Commercially deployed marine battery systems as of 2025 deliver energy densities of approximately 150 to 250 Wh/kg at cell level and 100 to 180 Wh/kg at pack level, compared to marine diesel fuel at approximately 12,000 Wh/kg, a gap of approximately 50 to 80 times. For a Panamax-class container vessel on a 6,000 to 8,000 nautical mile transoceanic route, replacing the propulsive energy equivalent of 1,500 to 2,000 tonnes of VLSFO would require a battery bank weighing approximately 80,000 to 120,000 tonnes, exceeding the vessel’s entire deadweight capacity. Even solid-state batteries projected at 400 to 500 Wh/kg by 2030 would still require a 20,000 to 30,000 tonne installation for equivalent energy storage.
This constraint creates a structural addressable market ceiling. Pure battery-electric propulsion is technically and economically viable only for vessels operating below approximately 200 to 400 nautical miles per charge cycle, covering coastal ferries, harbor tugs, and inland waterway freight. This segment constitutes only approximately 8 to 12% of total global shipping energy consumption. Manufacturers that overinvest in pure battery-electric systems beyond this viable range envelope face unacceptable commercial risk, while the market’s headline CAGR systematically overstates the pure battery-electric opportunity for the deep-sea segment when this constraint is not explicitly quantified in investment models.
Market Challenges
| Challenge | (~) % CAGR Friction Drag | Geographic Relevance | Mitigation Horizon |
|---|---|---|---|
| Shipyard Electrification Capability & Retrofit Skill Gap | -1.2% | Global, acute in South Asia, Southeast Asia, Eastern Europe shipbuilding clusters | Long term (≥ 4 years) |
| Grid Capacity & Renewable Energy Mix at Port Locations | -0.9% | Developing-market ports globally; inland river ports in India, Bangladesh, Africa | Long term (≥ 4 years) |
| Marine Battery Thermal Safety & Classification Society Approval Complexity | -0.7% | Global; DNV, Lloyd’s Register, Bureau Veritas, ClassNK certification timelines | Medium term (2–4 years) |
| Lifecycle Cost Uncertainty Deterring Long-Term Financing Commitments | -0.5% | Global, most acute for project finance structures in emerging markets | Medium term (2–4 years) |
| Crew Training & Competency Deficit for Electric Propulsion Systems | -0.3% | Global, concentrated in existing diesel-trained maritime workforce | Medium term (2–4 years) |
Shipyard Electrification Capability & Retrofit Skill Gap
A critical structural vulnerability in the electric ships market is the mismatch between the pace of electric vessel demand creation and the rate at which the global shipbuilding industry is acquiring the engineering competencies needed to deliver at commercial scale. While Norway’s leading electric ferry shipyards and South Korea’s Tier-1 naval shipbuilders have developed mature battery integration capabilities, the majority of the world’s commercial shipbuilding capacity, concentrated in China’s secondary yards, India’s Tier-2 clusters in Kochi, Kolkata, and Surat, and mid-tier operations across Turkey and Romania, lacks the high-voltage electrical engineering expertise, battery system integration tooling, and certified testing infrastructure required to execute electric vessel contracts to classification society standards within competitive timelines.
The quantitative friction is significant and compounding. A conventional diesel newbuild in a mid-tier Asian yard requires approximately 150,000 to 400,000 labor hours to complete. Integrating a marine battery system rated at 1 to 10 MWh adds an estimated 15,000 to 45,000 incremental specialized labor hours per vessel, adding $500,000 to $2.5 million USD to construction costs and extending delivery timelines by 3 to 6 months versus equivalent diesel newbuilds. Shipyards targeting electric vessel contracts must invest in high-voltage electrical engineering training programs requiring a minimum 18 to 24 month certification curriculum under IEC 60092 standards, alongside formal technology transfer partnerships representing a human capital investment of approximately $3 to $8 million per yard per competency domain before autonomous electric vessel construction capability is achievable.
Market Opportunities
| Opportunity | (~) % Potential CAGR Upside | Geographic Relevance | Execution Window |
|---|---|---|---|
| Autonomous & Remotely Operated Electric Vessel Development for Cargo & Logistics Routes | +2.0% | Norway, Japan, South Korea, Netherlands, Singapore, United States | Long term (≥ 4 years) |
| Vessel-to-Grid (V2G) & Floating Energy Storage Monetization at Port Microgrids | +1.4% | Norway, Denmark, Netherlands, Japan, Singapore, United States (California) | Medium term (2–4 years) |
| Inland Waterway Electric Freight Fleet Build-Out in India & Southeast Asia | +1.0% | India, Bangladesh, Vietnam, Myanmar, Cambodia, Indonesia | Medium term (2–4 years) |
| Electric Cruise & Expedition Tourism Vessel Premium Segment Creation | +0.6% | Norway (fjords), Galápagos, Antarctica routes, Southeast Asian island tourism | Long term (≥ 4 years) |
| NZF Surplus Unit (SU) Brokerage & Compliance Credit Trading Platform Development | +0.4% | Global, anchored in leading maritime finance hubs — London, Singapore, Oslo | Medium term (2–4 years) |
Autonomous & Remotely Operated Electric Vessel Development for Cargo & Logistics Routes
The convergence of electric propulsion, sensor-fusion navigation, and AI-driven autonomous control represents the highest-upside strategic white space in the electric ships market, yet remains commercially untapped at meaningful cargo-carrying scale. Milestone demonstrations across 2024 to 2025 have progressively proven technical feasibility: Norway’s 80-meter autonomous container vessel on the Horten to Moss coastal route completed its first fully crewless commercial cargo operation in 2024, and Japan’s 2025 DFFAS program successfully completed a 790 nautical mile autonomous voyage with a 1,000-tonne coastal bulk carrier, triggering formal regulatory review at the IMO’s Maritime Safety Committee for a binding MASS Code targeting implementation by 2028. The primary commercial opportunity lies in defined cargo corridors, including port-to-port short-sea container feeder routes, offshore wind farm supply runs, and inter-island freight services, where route predictability and port call frequency create ideal conditions for autonomous operation.
The unit-economic transformation underpinning this opportunity is compelling. Crew costs account for approximately 20 to 35% of total operating expenditure for a short-sea cargo vessel, typically $1.2 to $2.8 million USD annually per vessel for a fully crewed complement of 8 to 14 officers and ratings. Autonomous or remotely operated electric vessels could reduce operating costs by an estimated 18 to 28% per vessel per year while improving voyage utilization through 24-hour continuous schedules unrestricted by mandatory seafarer rest periods. Gross margin improvement for operators executing this transition is estimated at 8 to 15 percentage points above conventional crewed vessel economics, making the 2028 to 2032 window the critical execution period once a binding IMO MASS Code enables crewless international operations.
Key Company Insights
ABB Ltd. holds a structural advantage through its integrated electric propulsion and shore power systems used across ferry and commercial fleets. Its broad marine portfolio lets operators source propulsion, charging, and controls from one supplier. This bundling reduces integration risk for buyers electrifying fixed routes. Consequently, ABB locks in multi-year system contracts that smaller specialists struggle to match on scope.
Corvus Energy commands strong positioning as a marine battery supplier with proven long-life deployments. Its packs power the MF Ampere, which reduces annual CO2 emissions by 5,700 tonnes against a diesel ferry. This track record de-risks battery selection for cautious operators. Therefore, Corvus converts field-proven reliability into a competitive edge as fleet buyers prioritize safety and lifespan over lowest price.
Key Players
- ABB Ltd.
- Siemens AG
- Wärtsilä Corporation
- Corvus Energy
- Kongsberg Gruppen
- Yara International ASA
- Rolls-Royce Holdings plc
- MAN Energy Solutions
- Damen Shipyards Group
- Fincantieri S.p.A.
- Hyundai Heavy Industries
- Mitsubishi Heavy Industries
- Naval Group
- Vard Group
- Torqeedo GmbH
Recent Developments
- February 2025: The MF Ampere, the world’s first all-electric ferry in Norway, marked its 10 year operating anniversary, having cut operational cost per crossing by 85 to 90% versus diesel and delivered nearly USD 15 Million in cumulative savings.
Geopolitical Impact Analysis
According to the WTO, global merchandise trade tensions have raised average applied tariffs, with some sectoral duties climbing above 25% on imported industrial goods, lifting costs for imported ship components. Lithium and battery-grade materials face concentrated supply, and processing sits heavily in a few nations. This exposure raises pack costs for European shipbuilders. As a result, suppliers diversify sourcing to protect margins on electric vessel programs.
Data from UNCTAD shows shipping freight rates spiked over 150% on some routes during Red Sea rerouting, while vessels added roughly 10 extra transit days around Africa. Longer routes delay delivery of imported batteries and propulsion parts for shipyards. This means builders face schedule risk on electric vessel orders. Therefore, operators favor regional suppliers to shield projects from logistics volatility and rising transit cost.
Report Scope
| Report Features | Description |
|---|---|
| Market Value (2025) | USD 15.40 Billion |
| Forecast Revenue (2035) | USD 48.20 Billion |
| CAGR (2026-2035) | 12.2% |
| Base Year for Estimation | 2025 |
| Historic Period | 2020-2024 |
| Forecast Period | 2026-2035 |
| Report Coverage | Revenue Forecast, Market Dynamics, Market Opportunity Analysis, Technology and Innovation Landscape, Competitive Landscape, Recent Developments |
| Segments Covered | By Vessel Type (Ferries, Cargo Ships, Passenger Ships, Offshore Support Vessels, Naval & Defense Ships, Yachts & Leisure Boats), By Propulsion Type (Battery-Electric Ships, Hybrid Electric Ships, Plug-in Hybrid Ships, Fuel Cell Electric Ships), By Battery Type (Lithium-Ion Batteries, Solid-State Batteries, Lead-Acid Batteries, Flow Batteries), By Power Source Integration (Fully Electric, Hybrid Diesel-Electric, Shore-Powered Charging Systems, Renewable Energy-Integrated Ships), By Application (Passenger Transport, Cargo Transport, Marine Tourism & Leisure, Defense Applications, Offshore Energy Operations), By End User (Commercial Shipping Companies, Government & Defense Agencies, Tourism Operators, Private Yacht Owners), By Charging Infrastructure (Shore Power Charging, Port-Based Fast Charging Stations, Onboard Renewable Charging Systems, Battery Swapping Systems), By Range Capability (Short-Range Ships, Medium-Range Ships, Long-Range Electric Ships) |
| Regional Analysis | North America (US and Canada), Europe (Germany, France, The UK, Spain, Italy, and Rest of Europe), Asia Pacific (China, Japan, South Korea, India, Australia, and Rest of APAC), Latin America (Brazil, Mexico, and Rest of Latin America), Middle East and Africa (GCC, South Africa, and Rest of MEA) |
| Competitive Landscape | ABB Ltd., Siemens AG, Wärtsilä Corporation, Corvus Energy, Kongsberg Gruppen, Yara International ASA, Rolls-Royce Holdings plc, MAN Energy Solutions, Damen Shipyards Group, Fincantieri S.p.A., Hyundai Heavy Industries, Mitsubishi Heavy Industries, Naval Group, Vard Group, Torqeedo GmbH |
| Customization Scope | Customization for segments, region / country-level will be provided. Additional customization can be done based on requirements. |
| Purchase Options | We have three licenses to opt for: Single User License | Multi-User License (Up to 5 Users) | Corporate Use License (Unlimited User and Printable PDF) |





































