


Report Overview
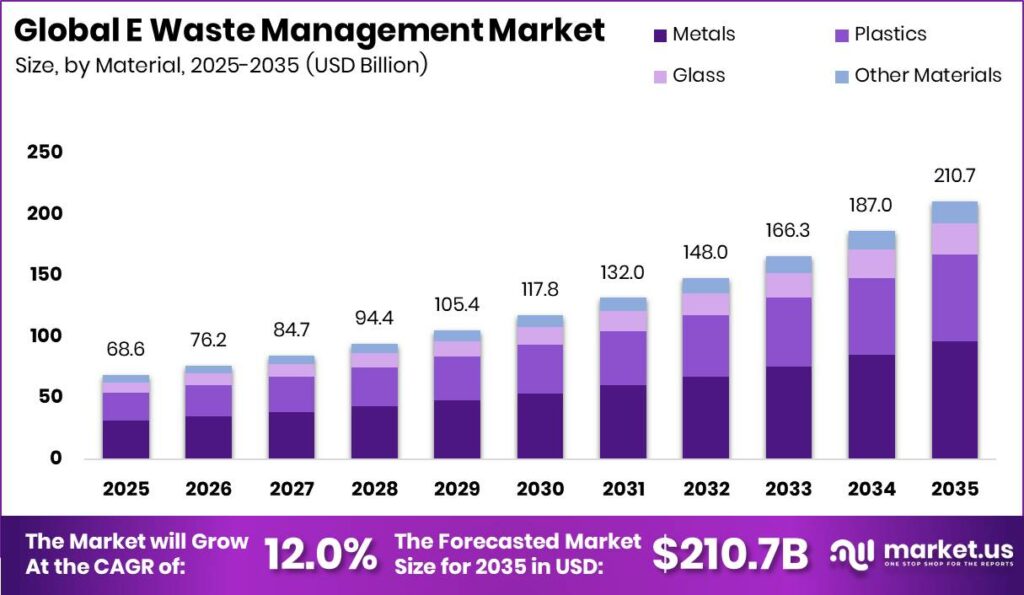
Global E-Waste Management Market size is expected to be worth around USD 210.7 Billion by 2035 from USD 68.6 Billion in 2025, growing at a CAGR of 12.0% during the forecast period 2026 to 2035. This growth reflects a structural shift from disposal toward material recovery. Investors gain a long runway because rising device volumes lock in feedstock supply. This creates durable revenue for operators who secure collection early.
The market covers collection, sorting, dismantling, and recovery of discarded electrical and electronic equipment. Operators process metals, plastics, and glass into secondary raw materials sold back into manufacturing. Therefore the industry sits between waste handling and commodity supply. This structure lets high recovery facilities earn commodity margin rather than fee income. Buyers value operators who convert waste streams into certified material output.
Key Takeaways
- Global E-Waste Management Market size reached USD 68.6 Billion in 2025 and will hit USD 210.7 Billion by 2035 at a CAGR of 12.0%.
- Metals led the By Material segment with a 45.6% share and ranked as the fastest growing material stream.
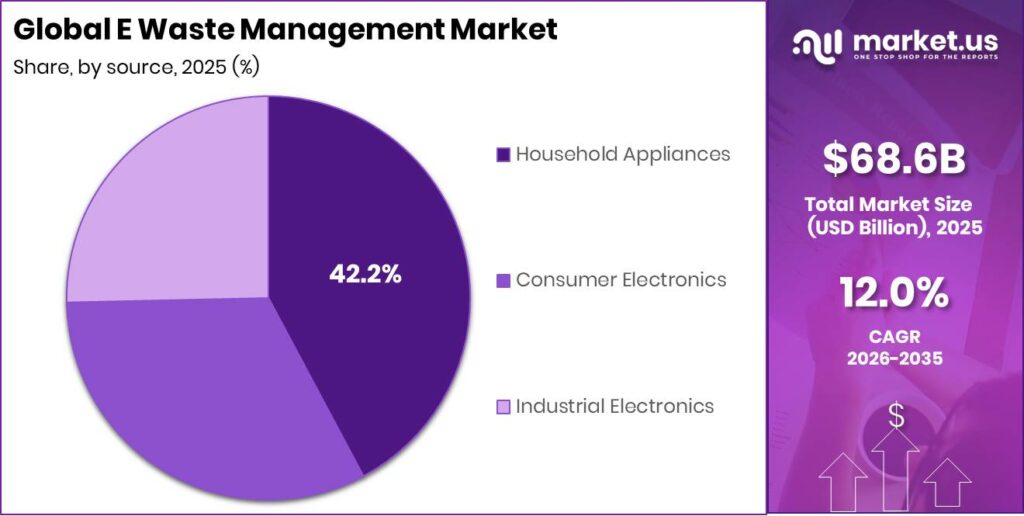
- Household Appliances held the By Source segment with a 42.2% share, while Consumer Electronics grew fastest.
- Recycling and Reuse dominated the By Application segment with a 75.2% share.
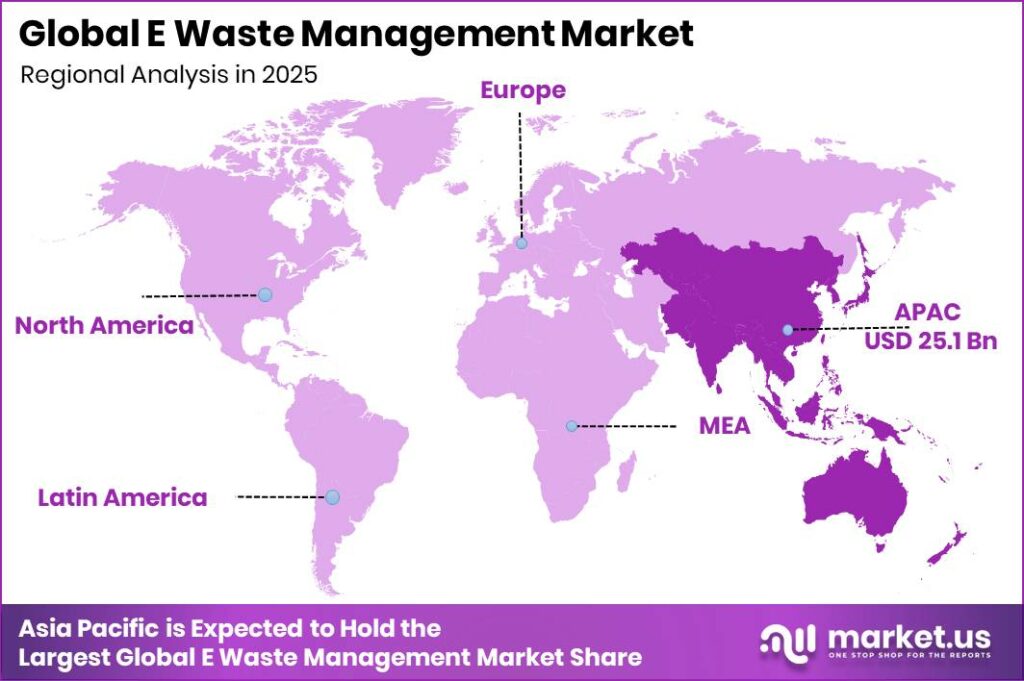
- Asia Pacific led all regions with a 36.7% share, valued at USD 25.18 Billion.
Government action anchors demand across major markets. As of June 2023, only 81 countries, or 42%, had an e-waste policy, legislation, or regulation, according to the ITU Global E-waste Monitor 2024. This gap leaves most of the world without formal rules. This signals a long policy expansion cycle that will pull volume into regulated channels and reward compliant operators.
Public discipline still lags policy intent. As reported by the WEEE Forum, around 14 billion kg of electronic products enter ordinary household waste each year instead of formal collection. This loss equals roughly one quarter of annual e-waste generation. As a result, operators who build convenient drop-off networks can capture stranded feedstock and convert wasted material into recovered commodity value. In October 2025, Attero partnered with India’s Ministry of Mines and JNARDDC on a Pan-India recycling drive that targets exactly this gap.
Material Analysis
Metals dominate with 45.6% due to high recovered commodity resale value.
In 2025, Metals held a dominant market position in the By Material segment of E-Waste Management Market, with a 45.6% share. ITU data shows global e-waste reached 62 million metric tonnes in 2022, equal to 7.8 kg per person, so metal content scales directly with device volume. This means recyclers who refine copper, gold, and palladium in-house capture margin instead of selling low-value concentrate.
Plastics form the second material stream by weight and by processing effort. UN Comtrade trade flows show large cross-border volumes of scrap plastic tied to electronics dismantling. However, contamination and mixed polymers lower resale value. This creates a clear advantage for operators who invest in polymer sorting and can sell clean recyclate at a premium.
Glass covers cathode ray tube and display components that carry legacy hazards. National statistical offices report shrinking glass volumes as flat-panel displays replace older screens. This shift lowers hazardous handling cost over time. Consequently, operators can redirect capital from glass treatment toward higher-value metal and battery recovery lines.
Other Materials cover ceramics, composites, and residual fractions that hold the remaining share collectively. These streams offer limited resale value and mainly add compliance cost. Therefore operators treat them as a documentation obligation rather than a revenue line, focusing recovery investment on metal-rich fractions instead.
Source Analysis
Household Appliances dominate with 42.2% due to high replacement and disposal volume.
In 2025, Household Appliances held a dominant market position in the By Source segment of E-Waste Management Market, with a 42.2% share. Figures from the WEEE Forum show around 14 billion kg of electronics reach household waste yearly, and large appliances make up much of that bulk. This means collection operators must build heavy-item logistics to capture this dense, high-tonnage stream.
Consumer Electronics rank as the fastest growing source as replacement cycles shorten. National statistical offices link falling device lifespans to rising phone and laptop returns. This churn feeds high-grade printed circuit boards into recovery lines. As a result, recyclers targeting this stream earn strong margin from precious metal content per tonne.
Industrial Electronics cover servers, network gear, and factory equipment with long service lives. UNIDO manufacturing data ties this stream to enterprise refresh cycles and data-center upgrades. This equipment carries strict data-security handling needs. Therefore operators offering certified data destruction win enterprise contracts that smaller recyclers cannot serve.
Application Analysis
Recycling and Reuse dominates with 75.2% due to material recovery revenue potential.
In 2025, Recycling and Reuse held a dominant market position in the By Application segment of E-Waste Management Market, with a 75.2% share. ITU figures show only 22.3% of global e-waste was formally documented as collected and recycled in 2022. This gap means recovery capacity has substantial room to grow, rewarding operators who scale certified recycling now.
Disposal and Trash covers landfill and incineration routes for non-recoverable fractions. Europe achieved the world’s highest documented collection and recycling rate at 42.8% in 2022, which shows disposal shrinks as policy tightens. This means operators anchored in disposal face declining volume. Consequently, they must pivot toward recovery services to protect long-term revenue.
Key Market Segments
By Material
- Metals
- Plastics
- Glass
- Other Materials
By Source
- Household Appliances
- Consumer Electronics
- Industrial Electronics
By Application
- Recycling and Reuse
- Disposal / Trash
Regional Analysis
Asia Pacific Dominates the E-Waste Management Market with a Market Share of 36.7%, Valued at USD 25.18 Billion
Asia Pacific led the market in 2025 with a 36.7% share worth USD 25.18 Billion. As per our research, high device production and consumption across China and India drive volume here. This means operators face the largest feedstock pool but also strong informal competition. In October 2025, Attero partnered with India’s Ministry of Mines and JNARDDC on a nationwide recycling drive that expands formal collection reach.
Europe stands out as the fastest maturing region on recovery performance. As reported by the ITU Global E-waste Monitor 2024, Europe achieved the highest documented collection and recycling rate at 42.8% in 2022. This lead reflects strict EPR enforcement. As a result, vendors offering certified, traceable recovery gain premium pricing power across European markets.
North America pairs high per-capita generation with expanding treatment capacity. In June 2026, Veolia completed the acquisition of Clean Earth, doubling its U.S. hazardous waste business and broadening recycling capability across the continent. This consolidation signals rising scale advantage. Therefore smaller regional recyclers face pressure to specialize or partner to stay competitive.
Key Regions and Countries
North America
- US
- Canada
Europe
- Germany
- France
- The UK
- Spain
- Italy
- Rest of Europe
Asia Pacific
- China
- Japan
- South Korea
- India
- Australia
- Rest of APAC
Latin America
- Brazil
- Mexico
- Rest of Latin America
Middle East and Africa
- GCC
- South Africa
- Rest of MEA
Market Dynamics
Market Opportunity Analysis - Underserved metal streams and low-recovery regions offer entry points for new players
The Metals segment holds a 45.6% share yet stays under-monetized where operators lack refining depth. Most sell concentrate rather than certified metal. This creates room for entrants who build in-house recovery and capture full commodity value. Therefore new players with refining capability can win margin that incumbents currently leave on the table.
Asia Pacific leads with a 36.7% share worth USD 25.18 Billion, yet formal recovery remains thin against informal handling. This gap leaves large volumes outside regulated channels. This signals a clear entry point for operators who build convenient formal collection. Consequently, early movers can lock in feedstock before competition intensifies.
Consumer Electronics ranks fastest growing within the By Source segment but stays underserved on high-grade recovery. Shorter device cycles feed rich circuit boards into the stream. This creates a targeted opening for specialists focused on precious-metal extraction. As a result, focused entrants can outperform generalists on margin per tonne.
The Recycling and Reuse segment holds a 75.2% share, yet certified refurbishment capacity lags demand. Much recoverable equipment still exits through disposal routes. This signals an opening for recommerce-linked processors. By contrast, disposal-anchored operators face shrinking volume and must adapt toward reuse to defend revenue.
Technology and Innovation Landscape - Automated sorting and high-efficiency recovery redefine competitive edges
Deep-learning sorting reshapes processing accuracy. A 2026 recycling system known as A.R.I.S. achieved 90% overall precision for automated identification of shredded e-waste materials during recycling operations. This means operators can raise throughput while cutting manual sorting cost. Therefore firms adopting automated identification gain a clear efficiency edge over manual-heavy competitors.
Advanced metal recovery sets a new benchmark. Attero commercially deployed patented technology recovering 22 critical and precious metals from electronics and lithium-ion batteries at over 98% recovery efficiency. This high yield converts more input into salable metal. As a result, operators with such recovery depth capture margin that concentrate sellers surrender to third-party smelters.
Rare-earth recovery innovation targets a scarce material class. The EU Critical Raw Materials Act aims to recycle 25% of the bloc’s annual rare-earth demand, setting a measurable benchmark for advanced recovery technology. This target pulls investment toward specialized processing. Consequently, early developers of rare-earth recovery gain a durable position as regulation tightens supply expectations.
Drivers
Rising e-waste volume anchors market growth. The Global E-waste Statistics Partnership estimated approximately 62 million tonnes generated globally in 2022, growing near 2.5 million tonnes per year. Shorter replacement cycles push this higher, with smartphone lifespans falling from 33 months in 2019 to about 27 to 29 months by 2024. This means recyclers gain a rising, predictable feedstock base that supports long-term capacity investment.
EV batteries add a large new stream. One pack from the 2018 to 2020 cohort holds about 400 to 600 kg of material, and end-of-life volume may reach 200,000 to 400,000 tonnes yearly by 2026. Recovered cobalt at USD 25,000 to 40,000 per tonne lets operators shift from gate fees toward commodity revenue. This creates positive margin that pulls more volume into formal channels.
| Driver | (~) % Impact on CAGR Forecast | Geographic Relevance | Impact Timeline |
|---|---|---|---|
| Escalating E-Waste Generation from Consumer Electronics & EV Battery End-of-Life Volumes | +3.60% | Global — China, United States, Europe, India, Southeast Asia | Short term (≤ 2 years) |
| Mandatory Extended Producer Responsibility (EPR) Legislation Forcing Formal Collection Infrastructure | +2.80% | European Union, India, China, Brazil, South Korea, Australia | Short term (≤ 2 years) |
| Critical Raw Material Scarcity & Secondary Metal Recovery Value Driving Recycling Investment | +2.20% | Global — Europe, Japan, South Korea, United States most active | Medium term (2–4 years) |
| Corporate ESG Commitments & Scope 3 Emission Reduction Mandates Increasing Certified Recycling Demand | +1.55% | North America, Europe, Japan, Australia | Short term (≤ 2 years) |
| Government Green Recovery & Circular Economy Investment Programs Funding Infrastructure Buildout | +1.10% | European Union, China, India, South Korea, United States | Medium term (2–4 years) |
| Rising Public Environmental Awareness & Consumer E-Waste Drop-Off Participation Rates | +0.55% | Europe, North America, Japan, Australia, South Korea | Short term (≤ 2 years) |
Restraints
Informal recyclers block formal growth in price-sensitive markets. They carry near-zero overhead and no compliance cost, so they outbid certified operators who must absorb USD 150 to 600 per tonne in compliant handling. In India, the informal sector handled roughly 90 to 95% of e-waste in 2022 to 2023. This means formal recyclers struggle to secure feedstock without subsidy support.
Feedstock shortfalls stall investment. A hydrometallurgical plant sized at 50,000 tonnes per year and costing USD 40 to 80 million needs about 85 to 90% utilization for positive EBITDA. Weak formal collection stretches payback from 6 to 8 years toward 10 to 14 years. As a result, private capital hesitates, slowing capacity buildout below the 12.0% growth path.
| Restraint | (~) % Impact on CAGR Forecast | Geographic Relevance | Impact Timeline |
|---|---|---|---|
| Informal Sector Dominance & Unregulated Processing Diverting Volume from Formal Recycling Channels | -2.50% | India, China, Southeast Asia, Sub-Saharan Africa, Latin America | Short term (≤ 2 years) |
| Transboundary E-Waste Export Controls under Basel Convention Restricting Cross-Border Volume Flows | -1.40% | Global — developing nation importers most affected | Short term (≤ 2 years) |
| High Capital Cost of Advanced Hydrometallurgical & Pyrometallurgical Processing Plant | -0.95% | Global — most acute in emerging markets lacking project finance | Short term (≤ 2 years) |
| Volatile Secondary Metal Commodity Prices Undermining Recycler Revenue Predictability | -0.65% | Global — most acute for cobalt & lithium-dependent operators | Short term (≤ 2 years) |
| Low Consumer Collection Participation in Emerging Markets Limiting Formal Channel Feedstock | -0.42% | India, Southeast Asia, Sub-Saharan Africa, Latin America | Medium term (2–4 years) |
Challenges
Lithium-ion battery disassembly raises severe safety cost. Packs from BEVs weigh 400 to 700 kg and hold 40 to 100 kWh, and a pack may arrive with 20 to 80% charge. Damage can trigger thermal runaway reaching 700 to 1,000 degrees Celsius. This means processors must add costly containment before they can safely handle EV volume.
Adding battery capability strains capital plans. A facility needs USD 3 to 10 million in new discharge, suppression, and robotic tooling, raising asset intensity by 30 to 60%. Missing battery passport data forces 2 to 4 hours of engineering per new pack design. This creates a clear opening for firms that master safe, standardized battery processing first.
| Challenge | (~) % CAGR Friction Drag | Geographic Relevance | Mitigation Horizon |
|---|---|---|---|
| Lithium-Ion Battery Safe Disassembly Complexity | -1.80% | Global — most acute in facilities processing EV & consumer battery packs | Long term (≥ 4 years) |
| Data Security & Device Sanitisation Compliance Burden | -1.20% | North America, Europe, Japan, South Korea, Australia | Medium term (2–4 years) |
| Fragmented EPR Registry & Producer Compliance Tracking | -0.90% | India, Southeast Asia, Latin America, Africa | Long term (≥ 4 years) |
| Skilled Workforce Deficit in Hazardous Material Handling | -0.65% | Sub-Saharan Africa, South Asia, Latin America, Southeast Asia | Long term (≥ 4 years) |
| Design-for-Recycling Incompatibility in Legacy Consumer Electronics | -0.45% | Global — most acute for pre-2020 device cohorts | Long term (≥ 4 years) |
Opportunities
Urban mining opens a new profit center. One tonne of mobile phone circuit boards holds about 200 to 400 grams of gold and 60 to 120 kg of copper, worth USD 15,000 to 35,000 per tonne against a processing cost near USD 2,000 to 6,000. This means high-grade streams can earn 50 to 80% gross margin far above bulk processing.
Few operators capture this value today. Fewer than 20 to 25% of formal processors in 2025 held advanced refining capability at 98 to 99.9% purity, so most sell concentrate at 25 to 40% discounts. Building full capability costs USD 30 to 80 million over 3 to 5 years. This creates a first-mover margin window of 4 to 8 years for early investors.
| Opportunity | (~) % Potential CAGR Upside | Geographic Relevance | Execution Window |
|---|---|---|---|
| Urban Mining & Critical Mineral Recovery as a Revenue-Generating Asset Class | +2.40% | Europe, Japan, South Korea, United States, China | Medium term (2–4 years) |
| EV Battery Second-Life Repurposing & Grading as a Service for Energy Storage Markets | +1.80% | Europe, China, North America, Australia | Medium term (2–4 years) |
| Blockchain-Enabled EPR Compliance Tracking & Recycled Content Certification Platforms | +1.10% | European Union, India, Brazil, South Korea, Australia | Long term (≥ 4 years) |
| Formalised E-Waste Collection Network Expansion in Sub-Saharan Africa & South Asia | +0.85% | Nigeria, Kenya, Ghana, India, Bangladesh, Pakistan | Long term (≥ 4 years) |
| Refurbishment & Recommerce Platform Integration with Certified E-Waste Processing | +0.58% | North America, Europe, India, Southeast Asia | Short term (≤ 2 years) |
Key Company Insights
Waste Management, Inc. (WM) holds a structural advantage through its vast North American collection and logistics network. This reach lets it aggregate high volumes that smaller recyclers cannot match on cost. As per our research, scale in collection secures reliable feedstock, which underpins recovery economics. However, its broad waste focus leaves specialized precious-metal refining as a gap that pure-play recyclers can exploit for margin.
Sims Limited positions itself as a metals recovery specialist with global processing depth. This focus lets it monetize high-grade streams that generalist operators undervalue. Sims converts recovered copper and precious metals directly into commodity revenue, strengthening margin resilience. However, its concentration in metals exposes it to price volatility, creating risk when secondary commodity markets soften across cycles.
Key Players
- Waste Management, Inc. (WM)
- Sims Limited
- Electronic Recyclers International, Inc. (ERI)
- Umicore SA
- Aurubis AG
- Veolia Environnement S.A.
- Stena Metall Group
- Enviro-Hub Holdings Ltd.
- Tetronics Technologies
- Boliden AB
- Capital Environment Holdings Ltd.
- MBA Polymers, Inc.
- Global Electric Electronic Processing
- Attero Recycling Pvt. Ltd.
- Kuusakoski Group
- Others
Recent Developments
- June 2026: Veolia completed the acquisition of Clean Earth, doubling its U.S. hazardous waste business and expanding recycling and waste treatment capabilities across North America.
- May 2025: Attero commercially expanded deployment of its patented technology, recovering 22 critical and precious metals from end-of-life electronics and lithium-ion batteries at over 98% recovery efficiency.
Geopolitical Impact Analysis
Trade tensions reshape e-waste and recovered-metal flows. According to the WTO, world merchandise trade volume growth slowed to about 2.7% in recent readings as tariff friction rose. New reciprocal tariffs reaching 25% or more on some metal imports lift the value of domestically recovered copper and gold. This means regional recyclers gain pricing advantage as cross-border metal supply grows costlier and slower.
Supply chain rerouting adds cost and delay to material movement. As reported by UNCTAD, Red Sea disruptions cut Suez Canal transits by roughly 50%, forcing longer routes that add 10 or more days per shipment. Higher freight raises landed cost for imported components and virgin metals alike. Therefore secondary recovery from local e-waste becomes a more resilient supply source for regional manufacturers.
Report Scope
| Report Features | Description |
|---|---|
| Market Value (2025) | USD 68.6 Billion |
| Forecast Revenue (2035) | USD 210.7 Billion |
| CAGR (2026-2035) | 12.0% |
| Base Year for Estimation | 2025 |
| Historic Period | 2020-2024 |
| Forecast Period | 2026-2035 |
| Report Coverage | Revenue Forecast, Market Dynamics, Market Opportunity Analysis, Technology and Innovation Landscape, Competitive Landscape, Recent Developments |
| Segments Covered | By Material (Metals, Plastics, Glass, Other Materials), By Source (Household Appliances, Consumer Electronics, Industrial Electronics), By Application (Recycling and Reuse, Disposal / Trash) |
| Regional Analysis | North America (US and Canada), Europe (Germany, France, The UK, Spain, Italy, and Rest of Europe), Asia Pacific (China, Japan, South Korea, India, Australia, and Rest of APAC), Latin America (Brazil, Mexico, and Rest of Latin America), Middle East and Africa (GCC, South Africa, and Rest of MEA) |
| Competitive Landscape | Waste Management, Inc. (WM), Sims Limited, Electronic Recyclers International, Inc. (ERI), Umicore SA, Aurubis AG, Veolia Environnement S.A., Stena Metall Group, Enviro-Hub Holdings Ltd., Tetronics Technologies, Boliden AB, Capital Environment Holdings Ltd., MBA Polymers, Inc., Global Electric Electronic Processing, Attero Recycling Pvt. Ltd., Kuusakoski Group |
| Customization Scope | Customization for segments, region / country-level will be provided. Additional customization can be done based on requirements. |
| Purchase Options | We have three licenses to opt for: Single User License | Multi-User License (Up to 5 Users) | Corporate Use License (Unlimited User and Printable PDF) |





































