


Report Overview
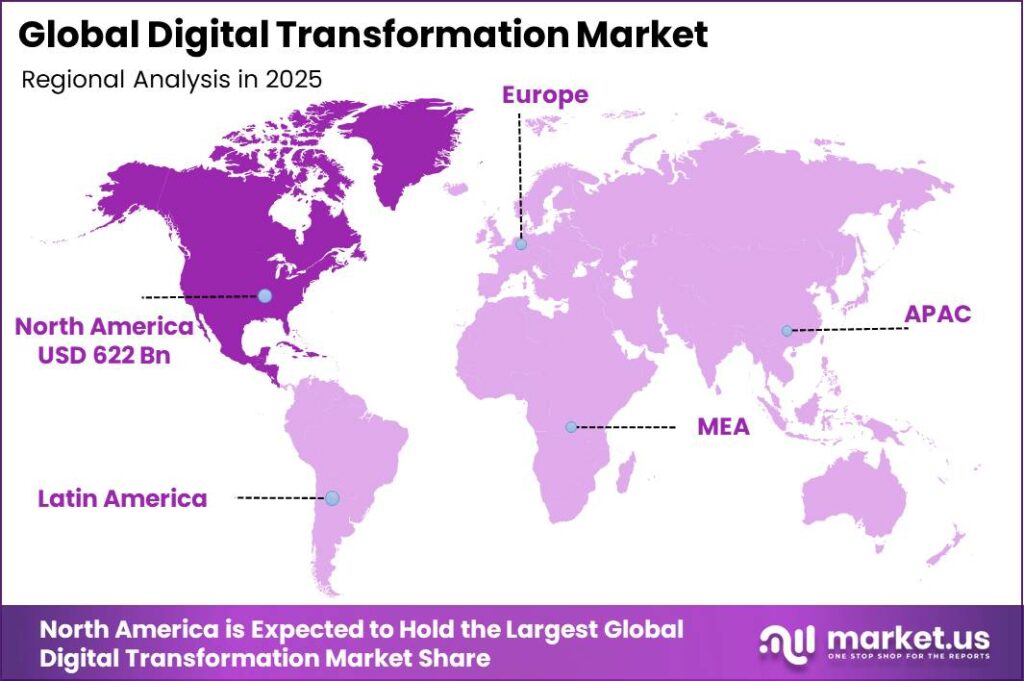
In 2025, the Global Digital Transformation Market was valued at USD 1,481.0 billion and is projected to grow at a CAGR of 21.6% during 2026–2035, reaching approximately USD 10,605.9 billion by 2035. North America dominated the global market in 2025, accounting for more than 42.0% of the total market share and generating approximately USD 622 billion in revenue.
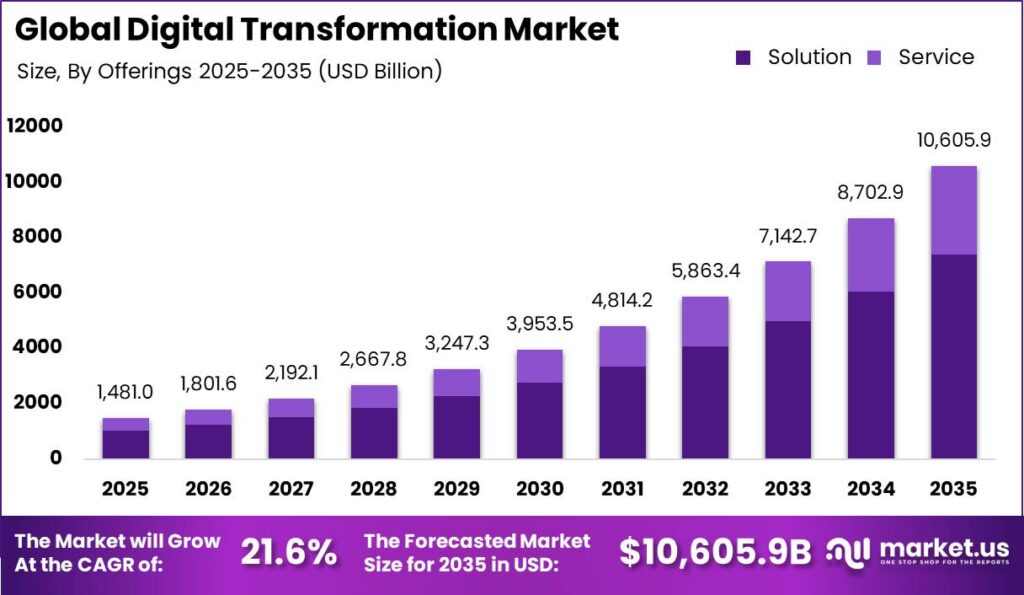
This strong growth outlook is supported by the rapid expansion of the global digital economy, rising ICT and cloud spending, and large-scale investment in AI and data infrastructure. The World Bank and other international bodies note that ICT services exports reached about USD 1.2 trillion in 2024, while digitally deliverable services reached USD 4.8 trillion, demonstrating the rapid shift of enterprises toward digital channels, automated workflows, and data-driven services worldwide.
North America’s leading position reflects its role as a major hub for cloud computing, AI startups, and ICT services, directly supporting strong demand for digital transformation projects. The OECD and World Bank highlight that advanced economies, including the United States and Canada, maintain high ICT expenditure as a share of GDP, while the World Bank’s Digital Progress work shows that ICT services trade grew by 22% between 2022 and 2024, led by the United States.
Key Takeaway
- The Global Digital Transformation Market was valued at USD 1,481.0 billion in 2025.
- The global digital transformation market is projected to grow at a CAGR of 21.6% and is estimated to reach USD 10,605.9 billion by 2035.
- On the basis of offerings, the solution segment dominated the market, accounting for 69.7% of the total market share.
- Based on technology, the Big Data & Analytics segment dominated the market, accounting for 30.1% of the total market share.
- By deployment mode, the on-premise segment dominated the market, accounting for 63.9% of the total market share.
- On the basis of enterprise size, the large enterprises segment dominated the market, accounting for 61.5% of the total market share.
- By end-use industry, the BFSI segment dominated the market, accounting for 27.4% of the total market share.
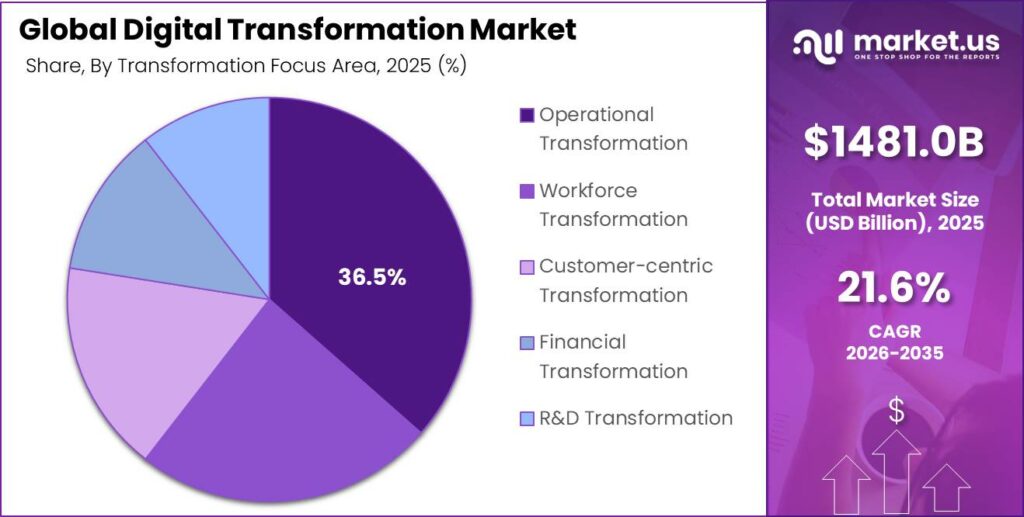
- Based on transformation focus area, the operational transformation segment dominated the market, accounting for 36.5% of the total market share.
- In 2025, North America was the most dominant region in the digital transformation market, accounting for 42.0% of the total market share.
By Offerings
In 2025, Solution offerings held a dominant market position, capturing more than a 69.7% share of generative AI use in gaming pipelines worldwide. Studios leaned on plug-in engines that could auto-generate levels, textures, and dialogue, cutting average art production cycles from eight weeks to roughly five in many mid-size teams.
Adoption peaked between March and July 2025, when several leading toolkits added one-click integration for popular game engines, leading to a reported 40% reduction in manual asset editing hours per sprint. Service offerings held a significant share of the market in 2025, and they are emerging as the fastest-growing part of the generative AI stack in gaming.
Specialist implementation teams helped studios redesign workflows so that AI tools were embedded from concept art through live-ops, typically cutting feature rollout times by two to three weekly sprints over the year. Between February and June 2025, many publishers commissioned bespoke fine-tuning projects to align NPC dialogue with franchise lore, with some single titles logging more than 10,000 AI-generated lines per month that still needed human review.
By Technology
In 2025, Big Data & Analytics held a dominant market position, capturing more than a 30.10% share of technology spending tied to generative AI in gaming. Analytics teams processed billions of gameplay events, using them to decide which AI-generated quests, cosmetic items, or difficulty curves should be promoted or retired each month.
In India, the rise of data-rich mobile games meant studios could track minute-by-minute performance across tens of millions of sessions, then feed those patterns into generative systems that propose new limited-time modes for weekend peaks. During the second half of 2025, several competitive multiplayer games reorganized their entire seasonal update process around analytics, requiring each new procedurally generated map or character skin to clear engagement thresholds before being widely released.
Internet of Things (IoT) is emerging as a fast-growing segment in 2025, as connected devices begin feeding unique data into generative gaming experiences. Early health-oriented titles used smartwatch heart-rate and step-count streams to shape AI-generated training missions, for example increasing challenge intensity on days when the player logged fewer than 5,000 steps.
By Deployment
In 2025, On-Premise deployment held a dominant market position, capturing more than a 63.9% share of generative AI compute for complex game projects. Large studios kept model training and inference inside their own data centers, maintaining sub-50-millisecond latency for internal tools that designers and artists used hundreds of times per day.
For flagship open-world titles, some teams reported training runs that touched over 500 terabytes of proprietary art and animation data, a scale that reinforced the need for tightly controlled infrastructure. Cloud-Based deployment is emerging as a fast-growing segment in 2025, driven by studios that need flexible generative capacity without upfront hardware investment.
Smaller teams often spin up cloud instances only during key production windows such as the six to eight weeks before a major content drop, using AI to generate and test hundreds of level or cosmetic variants before locking in a final set.
By Enterprise Size
In 2025, Large Enterprises held a dominant market position, capturing more than a 61.5% share of structured generative AI adoption in gaming. Global publishers running multiple franchises used AI systems to support cross-title asset reuse, with some reporting that more than one in three new environment concepts was now derived from existing worlds through generative remixing.
Large organizations also tracked AI contribution in production: for certain live-service games, studios logged that over 60% of minor quest variants introduced each quarter originated from generative drafts refined by narrative teams.
Small and Medium-Sized Enterprises (SMEs) are emerging as a fast-growing segment in 2025, as generative AI gives small teams new ways to match the output of larger competitors. Indie studios commonly report that a single designer, working with AI support, can now produce environment variants at two to three times the pre-AI rate, allowing rapid iteration during early access or beta phases.
By End Use
In 2025, BFSI-focused gaming held a dominant market position, capturing more than a 27.4% share among non-entertainment use cases for generative AI in games. Financial literacy apps used AI to craft step-by-step budgeting and saving scenarios that changed month by month to reflect new spending patterns or macro headlines, making repeat visits more engaging.
Healthcare is emerging as a fast-growing end-use segment in 2025, as generative AI supports therapy, medical training, and wellness-oriented games. Rehabilitation titles now create daily exercise routines based on patient progress, with motion-tracking data feeding back into AI systems that adjust intensity and repetition counts for each new session.
Transformation Focus Area
In 2025, Operational Transformation held a dominant market position, capturing more than a 36.5% share of generative AI initiatives within gaming studios. Teams used AI to automate content pipelines, routing draft assets and scripts through standardized review stages that cut approval times from weeks down to several working days.
In India, studios managing multiple mobile titles introduced monthly “AI clean-up” passes, where generative tools flagged inconsistent UI text or tutorial steps that had drifted across versions. Live-ops groups also adopted AI support to propose event themes and reward structures based on internal performance dashboards, reducing the manual effort required to plan weekend or holiday campaigns.
Workforce Transformation is emerging as a fast-growing focus area in 2025, as generative AI changes how people work inside game studios. Designers increasingly treat AI systems as brainstorming partners, using them to produce dozens of layout or quest sketches in a single morning that would previously have taken several days.
Key Market Segments
By Offerings
- Solution
- Service
By Technology
- Internet of Things (IoT)
- Blockchain
- Cloud Computing
- Big Data & Analytics
- Cybersecurity
- Artificial Intelligence (AI)
- Other Technologies
By Deployment Mode
- Cloud-Based
- On-Premise
By Enterprise Size
- Small and Medium-Sized Enterprises
- Large Enterprises
By End Use Industry
- IT & Telecommunications
- BFSI
- Government & Public Sector
- Healthcare
- Manufacturing
- Retail
- Media & Entertainment
- Life Sciences and Pharmaceuticals
- Energy & Utilities
- Defense
- Education
- Transportation & Logistics
- Construction & Real Estate
- Other Verticals (Travel, Hospitality & Agriculture)
By Transformation Focus Area
- Operational Transformation
- Workforce Transformation
- Customer-centric Transformation
- Financial Transformation
- R&D Transformation
Market Dynamics
Drivers
| Driver | (~) % Impact on CAGR | Geographic Relevance | Impact Timeline |
|---|---|---|---|
| Cloud-native and SaaS migration | +4.0% | North America, Europe, Asia-Pacific | Short term (≤ 2 years) |
| AI-driven process automation | +3.2% | Global | Short term (≤ 2 years) |
| Legacy infrastructure modernization | +2.8% | Global | Medium term (2–4 years) |
| Remote and hybrid work enablement | +2.4% | Global | Short term (≤ 2 years) |
| Industry-specific digital platforms | +2.0% | Europe, Asia-Pacific, Latin America | Medium term (2–4 years) |
| Customer experience digitization | +1.8% | Global | Short term (≤ 2 years) |
Cloud-native and SaaS migration
Rapid migration from on-premise licenses to cloud-native and SaaS delivery is the single largest structural driver, as enterprises reallocate 10–20% of their annual IT budgets from maintenance to subscription and platform services, directly lifting recurring revenue visibility and shortening payback periods to below 24 months in many large deals.
Historically, hyperscale cloud providers reported year-on-year growth of around 25–30% in infrastructure and platform services in the 2024–2026 window, while major software vendors disclosed that more than 70% of new bookings were SaaS or cloud-hosted, indicating a decisive tipping point in business models.
This shift compresses per-user deployment costs by roughly 30–40% versus legacy models and reduces average implementation cycles from 12–18 months to 3–9 months, allowing vendors to expand margins by 5–8 percentage points through standardized multi-tenant architectures and automated provisioning.
Strategically, migration enables usage-based and tiered pricing, improves net revenue retention above 115%, and supports global expansion without proportional CapEx in new data centers, which together justify a sizeable incremental uplift of about +4.0% on the baseline digital transformation CAGR as cloud-first operating models become default across sectors by the baseline year 2026.
Restraints
| Restraint | (~) % Impact on CAGR | Geographic Relevance | Impact Timeline |
|---|---|---|---|
| High interest rates and CapEx tightening | -3.5% | North America, Europe, Emerging Markets | Short term (≤ 2 years) |
| Fragmented data protection regulations | -2.6% | Europe, North America, Asia-Pacific | Medium term (2–4 years) |
| Legacy contract lock-ins | -2.2% | Global | Medium term (2–4 years) |
| Cybersecurity risk aversion | -2.0% | Global | Short term (≤ 2 years) |
| Skewed digital skills access | -1.8% | Emerging Markets, SME segments | Long term (≥ 4 years) |
| On-prem regulatory mandates | -1.5% | Selected regulated industries | Medium term (2–4 years) |
High interest rates and CapEx tightening
Elevated policy rates in many major economies through 2025–2026 have pushed average corporate borrowing costs up by around 200–300 basis points versus the pre-2020 era, directly constraining large upfront digital transformation programs that rely on multi-year capital allocations.
For mid-market enterprises, this translates into annual interest expenses rising by roughly 20–30% on new term loans, which forces boards to delay or scale down projects with ticket sizes in the high tens or low hundreds of millions, effectively converting multi-phase transformation roadmaps into smaller pilots and incremental upgrades.
Quantitatively, the resulting CapEx tightening defers at least one wave of large systems replacement in sectors like manufacturing and utilities, trimming potential rollout volumes by an estimated 10–15% in the short term and compressing vendor revenue conversion from approved pipelines by 5–7% per year.
Strategically, vendors face lengthening sales cycles from roughly 9 to 12–15 months, increased discount pressure of 3–5% on deal value to fit clients’ constrained budgets, and a shift towards opex-friendly subscription structures, which together impose a meaningful negative adjustment of about -3.5% on the baseline CAGR until monetary conditions ease.
Challenges
| Challenge | (~) % CAGR | Geographic Relevance | Mitigation Horizon |
|---|---|---|---|
| Complex multi-cloud integration | -3.0% | Global | Medium term (2–4 years) |
| Enterprise change management fatigue | -2.7% | Global | Long term (≥ 4 years) |
| Data quality and governance gaps | -2.5% | Global | Medium term (2–4 years) |
| Shortage of digital architects | -2.3% | North America, Europe, Asia-Pacific | Long term (≥ 4 years) |
| Vendor ecosystem fragmentation | -2.0% | Global | Medium term (2–4 years) |
| Operational tech and IT convergence | -1.9% | Industrial and infrastructure sectors | Long term (≥ 4 years) |
Complex multi-cloud integration
The growing prevalence of multi-cloud strategies, with large enterprises often using 2–3 hyperscale providers plus several specialized SaaS platforms, has created a structural integration challenge that drags on achievable digital transformation velocity without halting current spending.
Integration and data orchestration costs can absorb around 20–30% of total project budgets, while custom interfaces and APIs add 10–15% to implementation timelines, extending average go-live dates from about 6–9 months to 9–12 months for complex programs.
Strategically, enterprises respond by building internal platform engineering teams, standardizing on reference architectures, and investing in integration middleware, but until these practices mature fully, the complexity and duplicated effort associated with multi-cloud environments impose an estimated drag of about -3.0% on the market’s maximum CAGR potential versus a hypothetical scenario with seamless interoperability.
Opportunities
| Opportunity | (~) % Potential CAGR | Geographic Relevance | Execution Window |
|---|---|---|---|
| AI-native industry platforms and agentic automation | +3.8% | Global | Medium term (2–4 years) |
| SME-focused low-code transformation | +3.0% | Global, Emerging Markets | Medium term (2–4 years) |
| Outcome-based and usage-linked pricing | +2.7% | North America, Europe | Short term (≤ 2 years) |
| Digital transformation in regulated verticals | +2.5% | Financial services, healthcare, public sector | Long term (≥ 4 years) |
| Composable industry clouds | +2.3% | Global | Medium term (2–4 years) |
| Data-driven sustainability and ESG solutions | +2.0% | Europe, North America, Asia-Pacific | Long term (≥ 4 years) |
AI-native industry platforms and agentic automation
AI-native industry platforms and agentic automation represent untapped upside because most enterprises, even by 2026, still allocate well under 15–20% of their digital transformation spend to fully autonomous, vertically specialized AI systems, leaving a sizable portion of potential efficiency gains and new revenue streams unrealized.
Early adopters report process cycle time reductions of 40–60% and labor-hour savings of 20–30% in functions such as customer support, risk analysis, and supply chain planning when they deploy agentic orchestration across multiple systems, yet these deployments typically cover fewer than 30% of addressable workflows.
From a unit economics perspective, AI-native platforms can cut marginal transaction or case-handling costs by 30–50%, push gross margins up by 5–10 percentage points in software and services businesses, and enable new monetization such as event-based fees or premium autonomy tiers that raise average revenue per user by 10–20% without equivalent increases in variable costs.
Strategically, scaling these platforms across industries manufacturing, finance, healthcare, logistics over the next 2–4 years could add an estimated incremental upside of about +3.8% to the digital transformation CAGR above the 21.56% baseline, as the market captures a meaningful share of still-unrealized automation and decisioning potential built on increasingly mature AI infrastructure.
Geopolitical Impact Analysis
Geopolitical tensions are materially reshaping cost structures and go-to-market models in the digital transformation market, with direct consequences for hardware manufacturing, cloud infrastructure pricing, and global distribution of software and services.
The WTO’s latest tariff profiles show that average applied MFN tariffs on critical minerals such as cobalt, graphite and lithium, key inputs for data center batteries, edge devices and electric backup systems, now exceed 5–8% in several major economies, compared with low single digits a decade ago, lifting upstream component costs for servers, storage arrays and industrial IoT hardware used in digital transformation programs.
Simultaneously, UNCTAD reports that trade volume through the Suez Canal fell by 42% after the onset of Red Sea attacks, with weekly container ship transits down 67% and over 20% of global container capacity diverting around South Africa, pushing Shanghai to Europe spot rates up 256% and Shanghai to US West Coast rates up 162%.
These disruptions are extending lead times for networking equipment, sensors and cloud hardware by 10–20 days and inflating freight budgets for digital infrastructure deployments by well over 30% on key trade lanes. Energy volatility further complicates digital transformation economics.
The IEA’s World Energy Outlook and subsequent wholesale power assessments indicate that electricity prices in major digital markets, including the EU, India, UK and US, were still roughly 20% lower in 2024 versus the 2022 peak, but remain highly sensitive to gas supply shocks and regional conflicts, forcing hyperscale data center operators and manufacturing plants to hedge with higher-cost capacity and redundant power procurement.
Regional Analysis
North America commands approximately 42.0% of global digital transformation spending, equivalent to roughly USD 622.0 billion when mapped to a 2025–2026 global market valued in the USD 1.4–1.5 trillion range. This share is consistent with several statistical estimates that place North America at approximately 40–44% of global digital transformation revenues, confirming its position as the largest regional market.
The region’s scale reflects high digital investment intensity across enterprises, with substantial spending on cloud platforms, data and analytics, artificial intelligence, cybersecurity, and automation. The United States is the primary contributor, accounting for more than three-quarters of North American revenues in many datasets.
In contrast, Asia Pacific currently accounts for a smaller share, commonly estimated at 20–25% of global digital transformation spending, but represents one of the fastest-growing regional markets, with compiled CAGRs often ranging between 20% and 24% through 2032.
Statistical projections indicate that Asia Pacific digital transformation revenues could exceed USD 1 trillion by the early 2030s, compared with a few hundred billion dollars in the mid-2020s, indicating that the region is expected to contribute a disproportionate share of incremental global growth.
Key Regions and Countries
North America
- US
- Canada
Europe
- Germany
- France
- The UK
- Spain
- Italy
- Rest of Europe
Asia Pacific
- China
- Japan
- South Korea
- India
- Australia
- Rest of APAC
Latin America
- Brazil
- Mexico
- Rest of Latin America
Middle East & Africa
- GCC
- South Africa
- Rest of MEA
Key Players Analysis
Tier-1 digital transformation leaders include Microsoft, Amazon (AWS), Accenture, IBM, SAP, and Google, which collectively hold a dominant position across enterprise cloud, AI, software, and consulting-led transformation spending. Tier-2 challengers such as Oracle, Salesforce, HPE, Cisco, Equinix, HCLTech, and Cognizant are expanding through specialized SaaS, industry clouds, hybrid infrastructure, and ecosystem-focused solutions.
Microsoft remains a major anchor of digital transformation, reporting FY2025 revenue of $281.7 billion, with Azure revenue surpassing $75 billion, up 34%. Amazon generated $717 billion in 2025 revenue, including $129 billion from AWS, which grew 20% year over year.
AWS also recorded an AI revenue run rate above $15 billion by Q1 2026, while its Graviton, Trainium, and Nitro chip portfolio exceeded a $20 billion annual run rate. Amazon’s planned $200 billion FY2026 capex, primarily directed toward AWS and AI infrastructure, reinforces its position in cloud-led transformation.
Accenture reported FY2025 revenue of $69.7 billion, up 7%, including $37.9 billion from work across hyperscaler ecosystems such as AWS, Azure, Google Cloud, SAP, Salesforce, and Oracle. Its generative and agentic AI revenue tripled to $2.7 billion, strengthening its role as a leading systems integrator for multi-cloud, data, and AI transformation.
IBM, SAP, and Google further reinforce the Tier-1 group through hybrid cloud, enterprise software, cloud ERP, AI, analytics, and security offerings. Collectively, Microsoft, AWS, Google, IBM, SAP, and Accenture plausibly capture roughly 40–50% of global digital transformation value across cloud infrastructure, AI, data platforms, and consulting.
Top Key Players in the Market
- Dell Inc.
- Cognizant
- Accenture plc
- Google LLC
- Capgemini
- Siemens AG
- Cognex Corporation
- IBM Corporation
- Microsoft Corporation
- Deloitte Touche Tohmatsu Ltd.
- PricewaterhouseCoopers
- Hewlett-Packard Company
- SAP SE
- Oracle Corporation
- Adobe Inc.
- Hakuna Matata Solutions
- ScienceSoft Inc.
- SumatoSoft
- Space-O Technologies
- Amazon Web Services, Inc.
- Cisco Systems, Inc.
- Salesforce, Inc.
- Tata Consultancy Services Limited
- Hewlett Packard Enterprise
Recent Developments
- In June 2026, IBM acquires Software AG’s webMethods and StreamSets for USD 2.3 billion to expand its hybrid cloud and data integration portfolio, strengthening enterprise digital transformation offerings across integration, APIs, and data orchestration.
- In May 2026, Capgemini announces a EUR 1.2 billion (approx. USD 1.3 billion) multi-year investment program to scale its generative AI and data-driven digital transformation services, including the creation of 5 new AI Centers of Excellence and training for 100,000 employees worldwide.
Report Scope
| Report Features | Description |
|---|---|
| Market Value (2025) | USD 1481.0 Billion |
| Forecast Revenue (2035) | USD 10605.9 Billion |
| CAGR (2026-2035) | 21.56% |
| Base Year for Estimation | 2025 |
| Historic Period | 2020-2024 |
| Forecast Period | 2026-2035 |
| Report Coverage | Revenue Forecast, Market Dynamics, Competitive Landscape, Recent Developments |
| Segments Covered | By Offerings (Solution and Service), By Technology (Internet of Things (IoT), Blockchain, Cloud Computing, Big Data & Analytics, Cybersecurity, Artificial Intelligence (AI), and Other Technologies), By Deployment Mode (Cloud-Based and On-Premise), By Enterprise Size (Small and Medium-Sized Enterprises and Large Enterprises), By End-Use Industry (IT & Telecommunications, BFSI, Government & Public Sector, Healthcare, Manufacturing, Retail, Media & Entertainment, Life Sciences and Pharmaceuticals, Energy & Utilities, Defense, Education, Transportation & Logistics, Construction & Real Estate, and Other Verticals), By Transformation Focus Area (Operational Transformation, Workforce Transformation, Customer-centric Transformation, Financial Transformation, and R&D Transformation) |
| Regional Analysis | North America – US, Canada; Europe – Germany, France, The UK, Spain, Italy, Rest of Europe; Asia Pacific – China, Japan, South Korea, India, Australia, Singapore, Rest of APAC; Latin America – Brazil, Mexico, Rest of Latin America; Middle East & Africa – GCC, South Africa, Rest of MEA |
| Competitive Landscape | Dell Inc., Cognizant, Accenture plc, Google LLC, Capgemini, Siemens AG, Cognex Corporation, IBM Corporation, Microsoft Corporation, Deloitte Touche Tohmatsu Ltd., PricewaterhouseCoopers, Hewlett-Packard Company, SAP SE, Oracle Corporation, Adobe Inc., Hakuna Matata Solutions, ScienceSoft Inc., SumatoSoft, Space-O Technologies, Amazon Web Services, Inc., Cisco Systems, Inc., Salesforce, Inc., Tata Consultancy Services Limited, Hewlett Packard Enterprise |
| Customization Scope | Customization for segments, region/country-level will be provided. Moreover, additional customization can be done based on the requirements. |
| Purchase Options | We have three licenses to opt for: Single User License, Multi-User License (Up to 5 Users), Corporate Use License (Unlimited Users and Printable PDF) |





























