
Quick Navigation
Report Overview
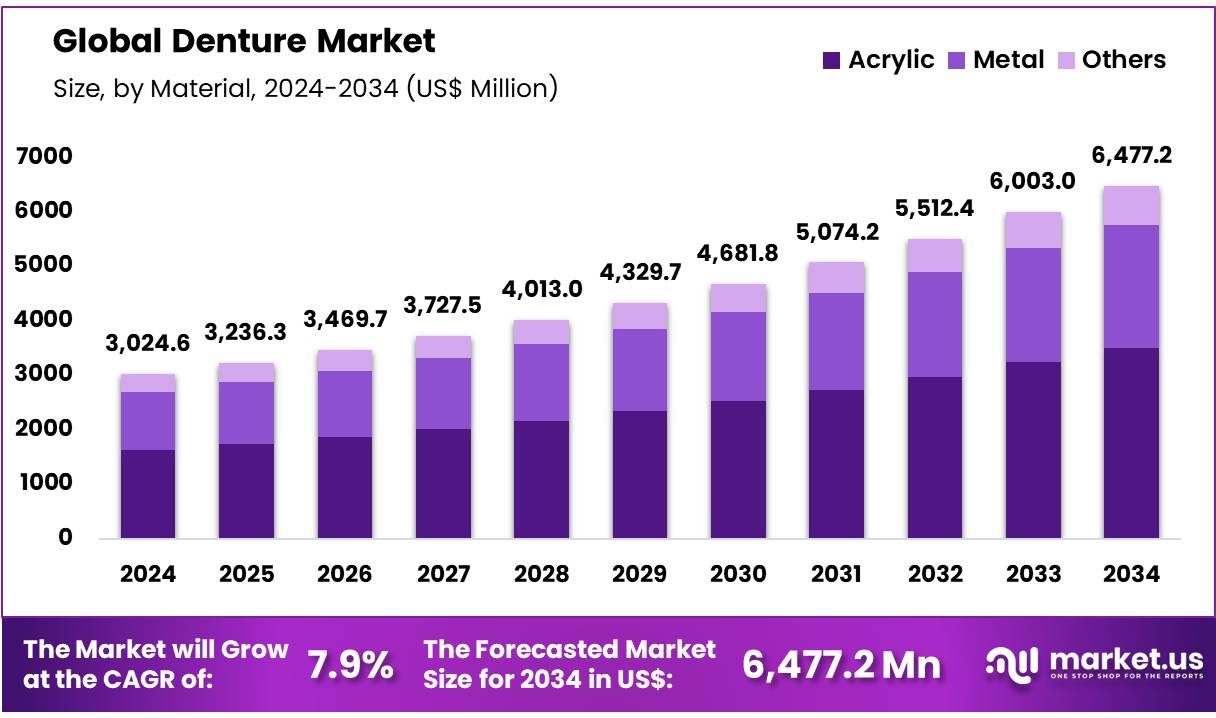
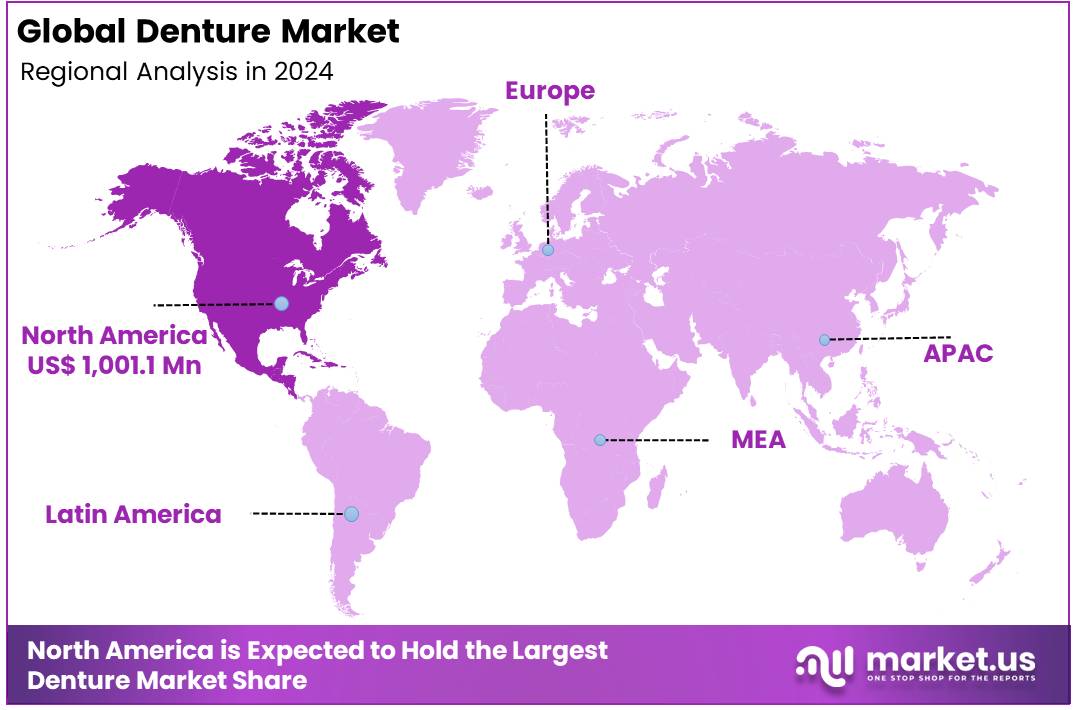
Global Denture Market was valued at US$ 3,024.6 Million in 2024 and is expected to grow at a CAGR of 7.9% from 2024 to 2034. In 2024, North America led the market, achieving over 33.1% share with a revenue of US$ 1001.1 Million.
Denture Market, Global Analysis, 2020-2024 (US$ Million)
| Global | 2020 | 2021 | 2022 | 2023 | 2024 | CAGR |
|---|---|---|---|---|---|---|
| Revenue | 2,136.3 | 2,178.2 | 2,319.9 | 2,832.3 | 3,024.6 | 7.9% |
The global dentures market is experiencing significant growth, driven by the increasing prevalence of edentulism and the rising geriatric population. Technological advancements in dental prosthetics, such as 3D printing and CAD/CAM systems, have improved the precision and aesthetics of dentures, further boosting market demand. Additionally, the growing awareness of oral health and the availability of advanced dental care services contribute to the market expansion.
North America and Europe dominate the market due to their well-established healthcare infrastructure and high adoption of advanced dental technologies. However, the Asia-Pacific region is expected to witness the fastest growth, attributed to increasing healthcare expenditure and a large aging population.
Key players are focusing on mergers, acquisitions, and product innovations to strengthen their market position. The market is projected to continue its upward trajectory, driven by ongoing technological advancements and the increasing need for effective dental solutions.
- According to the U.S. Census Bureau, the population aged 65 and older is projected to double from 52 million in 2018 to 95 million by 2060, representing about 23% of the total U.S. population.
Key Takeaways
- The global denture market was valued at USD 3,024.6 million in 2024 and is anticipated to register substantial growth of USD 6,477.2 million by 2034, with 7.9% CAGR.
- In 2024, the acrylic segment took the lead in the global market, securing 54.4% of the total revenue share.
- The complete segment took the lead in the global market, securing 56.1% of the total revenue share.
- North America maintained its leading position in the global market with a share of over 33.1% of the total revenue.
Material Analysis
Based on material the market is fragmented into acrylic, metal, and others. Amongst these, acrylic segment dominated the global denture market capturing a significant market share of 54.4% in 2024. Acrylic dentures are favored for their cost-effectiveness and versatility, making them accessible to a broad range of patients, including those with limited financial resources or inadequate insurance coverage.
- Major companies such as VITA Zahnfabrik, Kulzer GmbH, and Dentsply Sirona offer a variety of high-quality acrylic denture materials, contributing to the segment’s prominence.
Acrylic materials allow for extensive customization, enabling dental technicians to shape and color-match dentures to closely mimic the natural appearance of teeth and gums. This capability ensures high patient satisfaction due to the natural and aesthetically pleasing results. Advances in acrylic formulations have enhanced their strength and fracture resistance, making modern acrylic dentures more durable than their predecessors.
This durability, combined with their relative affordability, ensures that acrylic dentures remain a practical choice for many patients. One of the key advantages of acrylic dentures is their ease of repair and maintenance. While they may not be as strong as metal-based dentures, acrylic dentures can be easily adjusted and repaired, which is crucial for long-term use.
Denture Market, Material Analysis, 2020-2024 (US$ Million)
| Material | 2020 | 2021 | 2022 | 2023 | 2024 |
|---|---|---|---|---|---|
| Acrylic | 1,145.1 | 1,171.8 | 1,252.7 | 1,535.1 | 1,645.4 |
| Metal | 585.4 | 594.6 | 631.0 | 767.5 | 816.6 |
| Others | 405.9 | 411.7 | 436.1 | 529.6 | 562.6 |
Type Analysis
The market is fragmented by type into complete and partial. Complete dominated the global denture market capturing a significant market share of 56.1% in 2024. These prosthetics are essential for restoring oral function and aesthetics in patients who have lost all their natural teeth in one or both dental arches. Typically crafted from acrylic resin due to its durability, affordability, and ability to mimic natural gum tissues, complete dentures are custom-made to fit each patient’s oral anatomy.
They play a crucial role in improving chewing ability, speech clarity, and overall facial appearance, thereby enhancing quality of life for individuals experiencing complete tooth loss. Technological advancements, particularly in CAD/CAM technology, have streamlined the fabrication process, allowing for precise measurements and personalized designs that optimize comfort and functionality.
Denture Market, Type Analysis, 2020-2024 (US$ Million)
| Type | 2020 | 2021 | 2022 | 2023 | 2024 |
|---|---|---|---|---|---|
| Complete | 1,215.6 | 1,235.0 | 1,310.7 | 1,594.6 | 1,696.8 |
| Partial | 920.8 | 943.1 | 1,009.2 | 1,237.7 | 1,327.8 |
Usage Analysis
The market is fragmented by usage into removable and fixed. Removable dominated the global denture market capturing a significant market share of 58.2% in 2024. They are designed to be taken out and reinserted by the patient, facilitating easy cleaning and maintenance. This segment is particularly beneficial for elderly patients and those with extensive tooth loss, providing a non-invasive alternative to fixed dental prosthetics.
These are commonly fabricated from materials such as acrylic, metal alloys, and flexible nylon, each chosen for its specific benefits in terms of comfort, durability, and aesthetics. Acrylic dentures are widely favored for their cost-effectiveness and ease of customization, allowing for a close match to the patient’s natural gum color and tooth shape.
Denture Market, Usage Analysis, 2020-2024 (US$ Million)
| Usage | 2020 | 2021 | 2022 | 2023 | 2024 |
|---|---|---|---|---|---|
| Removable | 1,234.8 | 1,261.2 | 1,345.5 | 1,645.5 | 1,760.3 |
| Fixed | 901.5 | 917.0 | 974.4 | 1,186.7 | 1,264.3 |
End-User Analysis
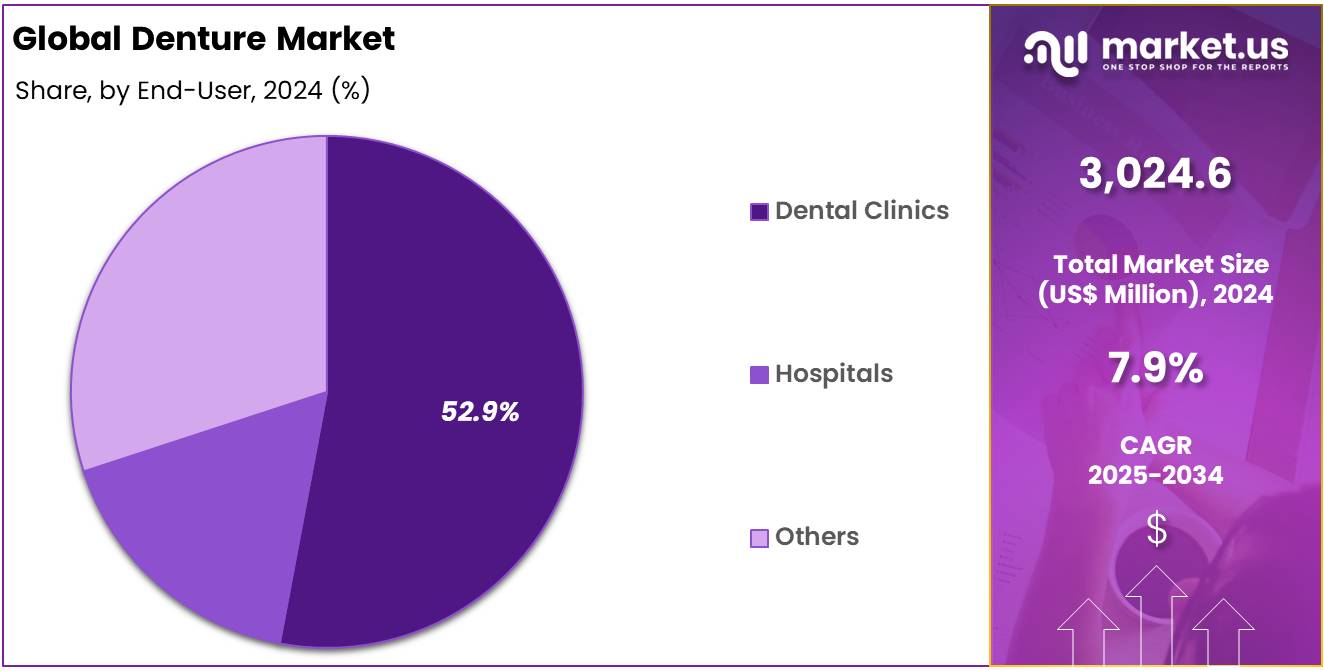
The market is fragmented by end-user into dental clinics, hospitals, and others. Dental clinics dominated the global denture market capturing a significant market share of 52.9% in 2024. Dental clinics play a crucial role in the provision of denture services due to their accessibility, comprehensive care, and personalized treatment options. These clinics offer a wide range of denture types, including complete and partial dentures, both removable and fixed, catering to the diverse needs of patients.
The primary advantage of dental clinics is their ability to provide customized solutions tailored to individual patient requirements, ensuring optimal fit, comfort, and aesthetic outcomes. Dental clinics are typically equipped with advanced dental technology and staffed by experienced professionals who can offer detailed consultations, precise measurements, and high-quality fabrication of dentures.
The integration of cutting-edge technology such as CAD/CAM systems in dental clinics has revolutionized denture manufacturing, allowing for digital impressions and precise customization, which enhances the accuracy and efficiency of denture production. This technological advancement not only improves the overall patient experience but also reduces the time required for denture fittings and adjustments.
Denture Market, End-User Analysis, 2020-2024 (US$ Million)
| End-User | 2020 | 2021 | 2022 | 2023 | 2024 |
|---|---|---|---|---|---|
| Dental Clinics | 1,113.0 | 1,139.2 | 1,217.9 | 1,492.6 | 1,600.0 |
| Hospitals | 788.3 | 801.6 | 851.4 | 1,036.6 | 1,104.0 |
| Others | 235.0 | 237.4 | 250.5 | 303.1 | 320.6 |
Key Segments Analysis
By Material
- Acrylic
- Metal
- Others
By Type
- Complete
- Partial
By Usage
- Removable
- Fixed
By End-User
- Dental Clinics
- Hospitals
- Others
Market Dynamics
Aging Population and Increasing Edentulism
The aging population is a significant driver of the global denture market, as it directly correlates with the increasing prevalence of edentulism (tooth loss).
- In 2019, the global population of individuals aged 60 years and older was 1 billion. This figure is projected to rise to 1.4 billion by 2030 and to 2.1 billion by 2050. This growth is happening at an unprecedented rate and is expected to accelerate in the coming decades, especially in developing countries.
This demographic shift is crucial because older adults are more likely to experience tooth loss due to factors such as periodontal disease, dental caries, and general wear and tear over time.
- The National Institute of Dental and Craniofacial Research (NIDCR) reports that approximately 26% of seniors over the age of 65 have no remaining teeth, highlighting a substantial demand for dentures in this age group.
Market Restraints
Lack of Insurance Coverage
One significant restraint on the global denture market is the lack of comprehensive insurance coverage for dental care, including dentures. In many countries, dental care is not included in standard health insurance plans, making it an out-of-pocket expense for many individuals. This lack of coverage can significantly limit access to dentures, especially advanced and higher-cost options.
The high cost and lack of insurance coverage can deter many from seeking the dental care they need, contributing to untreated edentulism. The situation is even more challenging in developing countries, where dental insurance coverage is often minimal or non-existent. In these regions, out-of-pocket expenses for dental care are a significant barrier.
For example, the World Health Organization reports that in low-income countries, out-of-pocket health expenditures can account for over 40% of total health spending. This high financial burden discourages individuals from seeking dental care, including dentures, leading to lower market penetration and limited access to necessary treatments.
Market Opportunities
Technological Advancements in Dental Prosthetics
Technological advancements in dental prosthetics are a major driver of the denture market. Innovations such as digital dentures, CAD/CAM (computer-aided design and computer-aided manufacturing) technology, and 3D printing are transforming the production and fitting of dentures, making the process more efficient, accurate, and customizable.
- For example, Ivoclar Vivadent’s introduction of Ivotion in March 2020 marked a significant advancement. Ivotion’s monolithic, single-disc milling solution combines high-quality tooth and denture base materials, streamlining the manufacturing process and improving predictability for digital laboratories.
CAD/CAM technology has enabled dental professionals to design and fabricate dentures with enhanced precision, reducing production time and ensuring a better fit for patients. 3D printing technology is also making significant strides in the denture market. The ability to create highly detailed and customized dentures using 3D printing has reduced production costs and improved patient satisfaction.
IMAGE
Impact of macroeconomic factors / Geopolitical factors
The global denture market is significantly influenced by macroeconomic and geopolitical factors. Economic conditions, such as GDP growth, disposable income, and healthcare spending, impact consumer demand for dentures, with higher economic prosperity typically driving more people to seek dental care. Conversely, economic downturns may lead to reduced spending on non-essential health services, affecting denture sales.
Geopolitical factors, including trade policies, tariffs, and healthcare regulations, also shape the market landscape. For instance, trade tensions or sanctions can disrupt the supply of raw materials used in denture production, raising costs and affecting prices.
Additionally, political instability in certain regions may limit access to dental care, leading to lower demand for dentures. On the other hand, healthcare reforms in emerging markets may increase accessibility and boost the market. Thus, both macroeconomic trends and geopolitical dynamics play a crucial role in determining the growth trajectory of the global denture market.
Latest Trends
The global denture market is witnessing several key trends driven by advancements in dental technology, changing demographics, and evolving consumer preferences. One notable trend is the increasing demand for digital dentures, which utilize 3D printing and CAD/CAM technology to provide more precise, customized, and comfortable dentures. This innovation enhances the speed of production and reduces costs, appealing to both consumers and dental professionals.
Additionally, there is a growing trend toward implant-supported dentures, offering greater stability and comfort compared to traditional removable dentures. The aging population, particularly in developed countries, continues to drive market growth as more people seek solutions for tooth loss.
Regional Analysis
North America held a significant position in the global dentures market, driven by high healthcare expenditure, advanced dental care infrastructure, and an aging population. The region accounted for 33.1% of the global dentures market, reflecting its substantial demand for dental prosthetics.
- In the United States alone, nearly 36 million Americans are edentulous (without teeth), and about 120 million people have at least one missing tooth. This demographic trend underscores the need for both complete and partial dentures.
Furthermore, the prevalence of dental diseases and the increasing awareness of oral health contribute to the robust market growth in North America. The region is characterized by a well-established network of dental clinics and hospitals, which provide comprehensive denture services, including advanced diagnostic and treatment options facilitated by cutting-edge technology such as CAD/CAM systems. These technological advancements enhance the precision and efficiency of denture fabrication, leading to better patient outcomes and satisfaction.
Dentures Market, Regional Analysis, 2020-2024 (US$ Million)
| Region | 2020 | 2021 | 2022 | 2023 | 2024 |
|---|---|---|---|---|---|
| North America | 715.7 | 727.5 | 772.5 | 940.3 | 1,001.1 |
| Europe | 619.5 | 636.0 | 682.0 | 838.4 | 901.3 |
| Asia Pacific | 431.5 | 446.5 | 482.5 | 597.6 | 647.3 |
Key Regions and Countries
North America
- US
- Canada
Europe
- Germany
- France
- The UK
- Spain
- Italy
- Russia
- Netherland
- Rest of Europe
Asia Pacific
- China
- Japan
- South Korea
- India
- New Zealand
- Singapore
- Thailand
- Vietnam
- Rest of APAC
Latin America
- Brazil
- Mexico
- Rest of Latin America
Middle East & Africa
- South Africa
- Saudi Arabia
- UAE
- Rest of MEA
Key Players Analysis
The global denture market is highly competitive, driven by technological advancements, demographic shifts, and increasing dental healthcare awareness worldwide. Key players in the market include both established companies with extensive market presence and newer entrants focusing on innovative solutions. Major players such as Dentsply Sirona, Zimmer Biomet, Ivoclar Vivadent, and others dominate the market through their wide product portfolios and strategic initiatives.
Dentsply Sirona, a leader in dental products, maintains its competitive edge through continuous product innovation and strategic acquisitions. Zimmer Biomet, known for its orthopedic and dental solutions, leverages its strong R&D capabilities to introduce advanced denture materials and designs that cater to evolving patient needs. Ivoclar Vivadent, renowned for its high-quality dental materials, focuses on expanding its global footprint and enhancing customer satisfaction through service excellence and product reliability.
DENTCA, Inc. is a leading company specializing in the design and manufacturing of custom dentures using 3D printing technology. Based in the United States, DENTCA offers a digital denture solution that provides high-quality, precise, and comfortable dentures for patients. By leveraging advanced CAD/CAM and 3D printing technologies, DENTCA aims to revolutionize the denture production process, making it faster and more efficient while reducing costs.
In addition, Mitsui Chemicals Inc. is a prominent Japanese chemical company involved in a wide range of industries, including automotive, healthcare, electronics, and agriculture. Mitsui Chemicals is known for its innovation and commitment to sustainability, focusing on developing environmentally friendly products.
Top Key Players
- DENTCA, Inc.
- Mitsui Chemicals Inc.
- Glisten Dental Technology Co., Ltd.
- Vitality Technologies LLC
- Ivoclar Vivadent
- Illusion
- Dentsply Sirona
- Modern Dental Group Limited
- SHOFU INC
- Dental Care
Recent Developments
- In March, 2020, Ivoclar Vivadent launched Ivotion, an innovative monolithic milling solution. Ivotion integrates premium tooth and denture base materials into a single bicolor disc, offering digital laboratories an efficient and reliable option for milling. This advancement ensures predictable outcomes, enhancing the production process for dental prosthetics.
- In March 2019, Dentsply Sirona and Carbon® launched Lucitone Digital Print Denture workflow and material system, taking digital dentistry to the next level. The ability to create complex denture designs with greater accuracy and speed makes 3D printing an attractive option for dental professionals and patients alike.
Report Scope
| Report Features | Description |
|---|---|
| Market Value (2024) | US$ 3,024.6 Million |
| Forecast Revenue (2034) | US$ 6,477.2 Million |
| CAGR (2025-2034) | 7.9% |
| Base Year for Estimation | 2024 |
| Historic Period | 2020-2023 |
| Forecast Period | 2025-2034 |
| Report Coverage | Revenue Forecast, Market Dynamics, COVID-19 Impact, Competitive Landscape, Recent Developments |
| Segments Covered | By Material (Acrylic, Metal, and Others), By Type (Complete and Partial), By Usage (Removable and Fixed), By End-User (Dental Clinics, Hospitals, and Others) |
| Regional Analysis | North America – US, Canada; Europe – Germany, France, The UK, Spain, Italy, Russia, Netherlands, Rest of Europe; Asia Pacific – China, Japan, South Korea, India, New Zealand, Singapore, Thailand, Vietnam, Rest of APAC; Latin America – Brazil, Mexico, Rest of Latin America; Middle East & Africa – South Africa, Saudi Arabia, UAE, Rest of MEA |
| Competitive Landscape | DENTCA, Inc., Mitsui Chemicals Inc. , Glisten Dental Technology Co., Ltd., Vitality Technologies LLC, Ivoclar Vivadent, Illusion, Dentsply Sirona, Modern Dental Group Limited , SHOFU INC, and Dental Care |
| Customization Scope | Customization for segments, region/country-level will be provided. Moreover, additional customization can be done based on the requirements. |
| Purchase Options | We have three licenses to opt for: Single User License, Multi-User License (Up to 5 Users), Corporate Use License (Unlimited User and Printable PDF) |


